- Blog /
- Grafana Mimir and VictoriaMetrics: performance tests
Grafana Mimir and VictoriaMetrics: performance tests
Share:


Grafana Labs Mimir is a new time series database under AGPLv3-license. The engineering team did a great job by taking the best from Cortex TSDB, reducing its complexity and improving scalability in the same time.
According to tests by Grafana Labs , Mimir can scale to a billion active time series and 50 million samples/s ingestion rate. The benchmark required running a cluster with 7,000 CPU cores and 30 TiB of RAM, which makes it the largest and the most expensive public benchmark of time series databases that I’ve heard of. Well done!
It is not that easy to reproduce a benchmark on such a scale. Fortunately, in most cases, users have much lower workload requirements that are easier to emulate. In this blogpost, I’ll try comparing the performance and resource usage of VictoriaMetrics and Grafana Mimir clusters running under moderate workload on the same hardware.
Methodology
#
The most complicated thing in comparing two different products is to remain transparent and unbiased. Especially, when you’re pretty familiar with one product and completely new to another. Many thanks on that note to Mimir’s engineering team, whom we’ve contacted as we prepared this benchmark. Their willingness and openness to answer product-related questions and explain implementation details is much appreciated and was really helpful.
VictoriaMetrics and Grafana Mimir are time series databases with support of mostly the same protocols and APIs. However, they have different architectures and components, which makes the comparison more complicated. In the benchmark, I’ll take a limited number of resources and allocate them with my best knowledge to both clusters.
Then, I’ll run a benchmark round to see how both solutions are dealing with identical workloads and how efficient they’re with using the allocated resources.
The benchmark will run in Google Kubernetes Engine consisting of
e2-standard-16 nodes (each node has 16vCPU and 64GiB of RAM) with standard SSD-based persistent volumes.
Prometheus-benchmark tool
#
For generating the load, I’ll use Prometheus-benchmark tool. It is used internally in VictoriaMetrics for testing and benchmarking new releases. The tool, I believe, generates production-like workload due to the following reasons:
- as a source of metrics for ingestion it uses real node_exporter targets, which is usually the case for most production environments;
- as a source of read queries it uses the recommended list of alerting rules for node_exporter;
- non-zero metrics churn rate generates additional pressure, emulating scenario of periodical pods re-deploy in Kubernetes.
Benchmark runs two identical isolated sets of services. Each of them is configured to scrape metrics, forward them via remote-write to the configured storage, and periodically execute alerting rules. The benchmark’s configuration is the following:
# how frequently to scrape node_exporter targets
scrapeInterval: 15s
# how often to execute configured rules
queryInterval: 15s
# defines the number of node_exporter instances to scrape
targetsCount: 6000
# percent of node_exporter targets to update
# in order to generate series churn rate
scrapeConfigUpdatePercent: 1
# specifies how frequently to update targets
# for generating time series churn rate
scrapeConfigUpdateInterval: 10m
See the full list of used configuration params here.
Each node_exporter target in the benchmark generates around
900 (depends on hardware where node_exporter runs) time series.
targetsCount=6000 and scrapeInterval=15s generate around 5.5 million active series at the ingestion rate 360k samples/s
to each configured remote storage.
queryInterval=15s for
configured list of alerts
generates about 1.5 queries/s of a read load via instant queries.
scrapeConfigUpdatePercent=1 and scrapeConfigUpdateInterval=10m generates a churn rate
of ~60k new time series every 10 minutes.
Mimir setup
#
I’ve never used Cortex or Mimir before, so I started exploring the project from these docs and a Helm chart for distributed installation. Its architecture is pictured below:
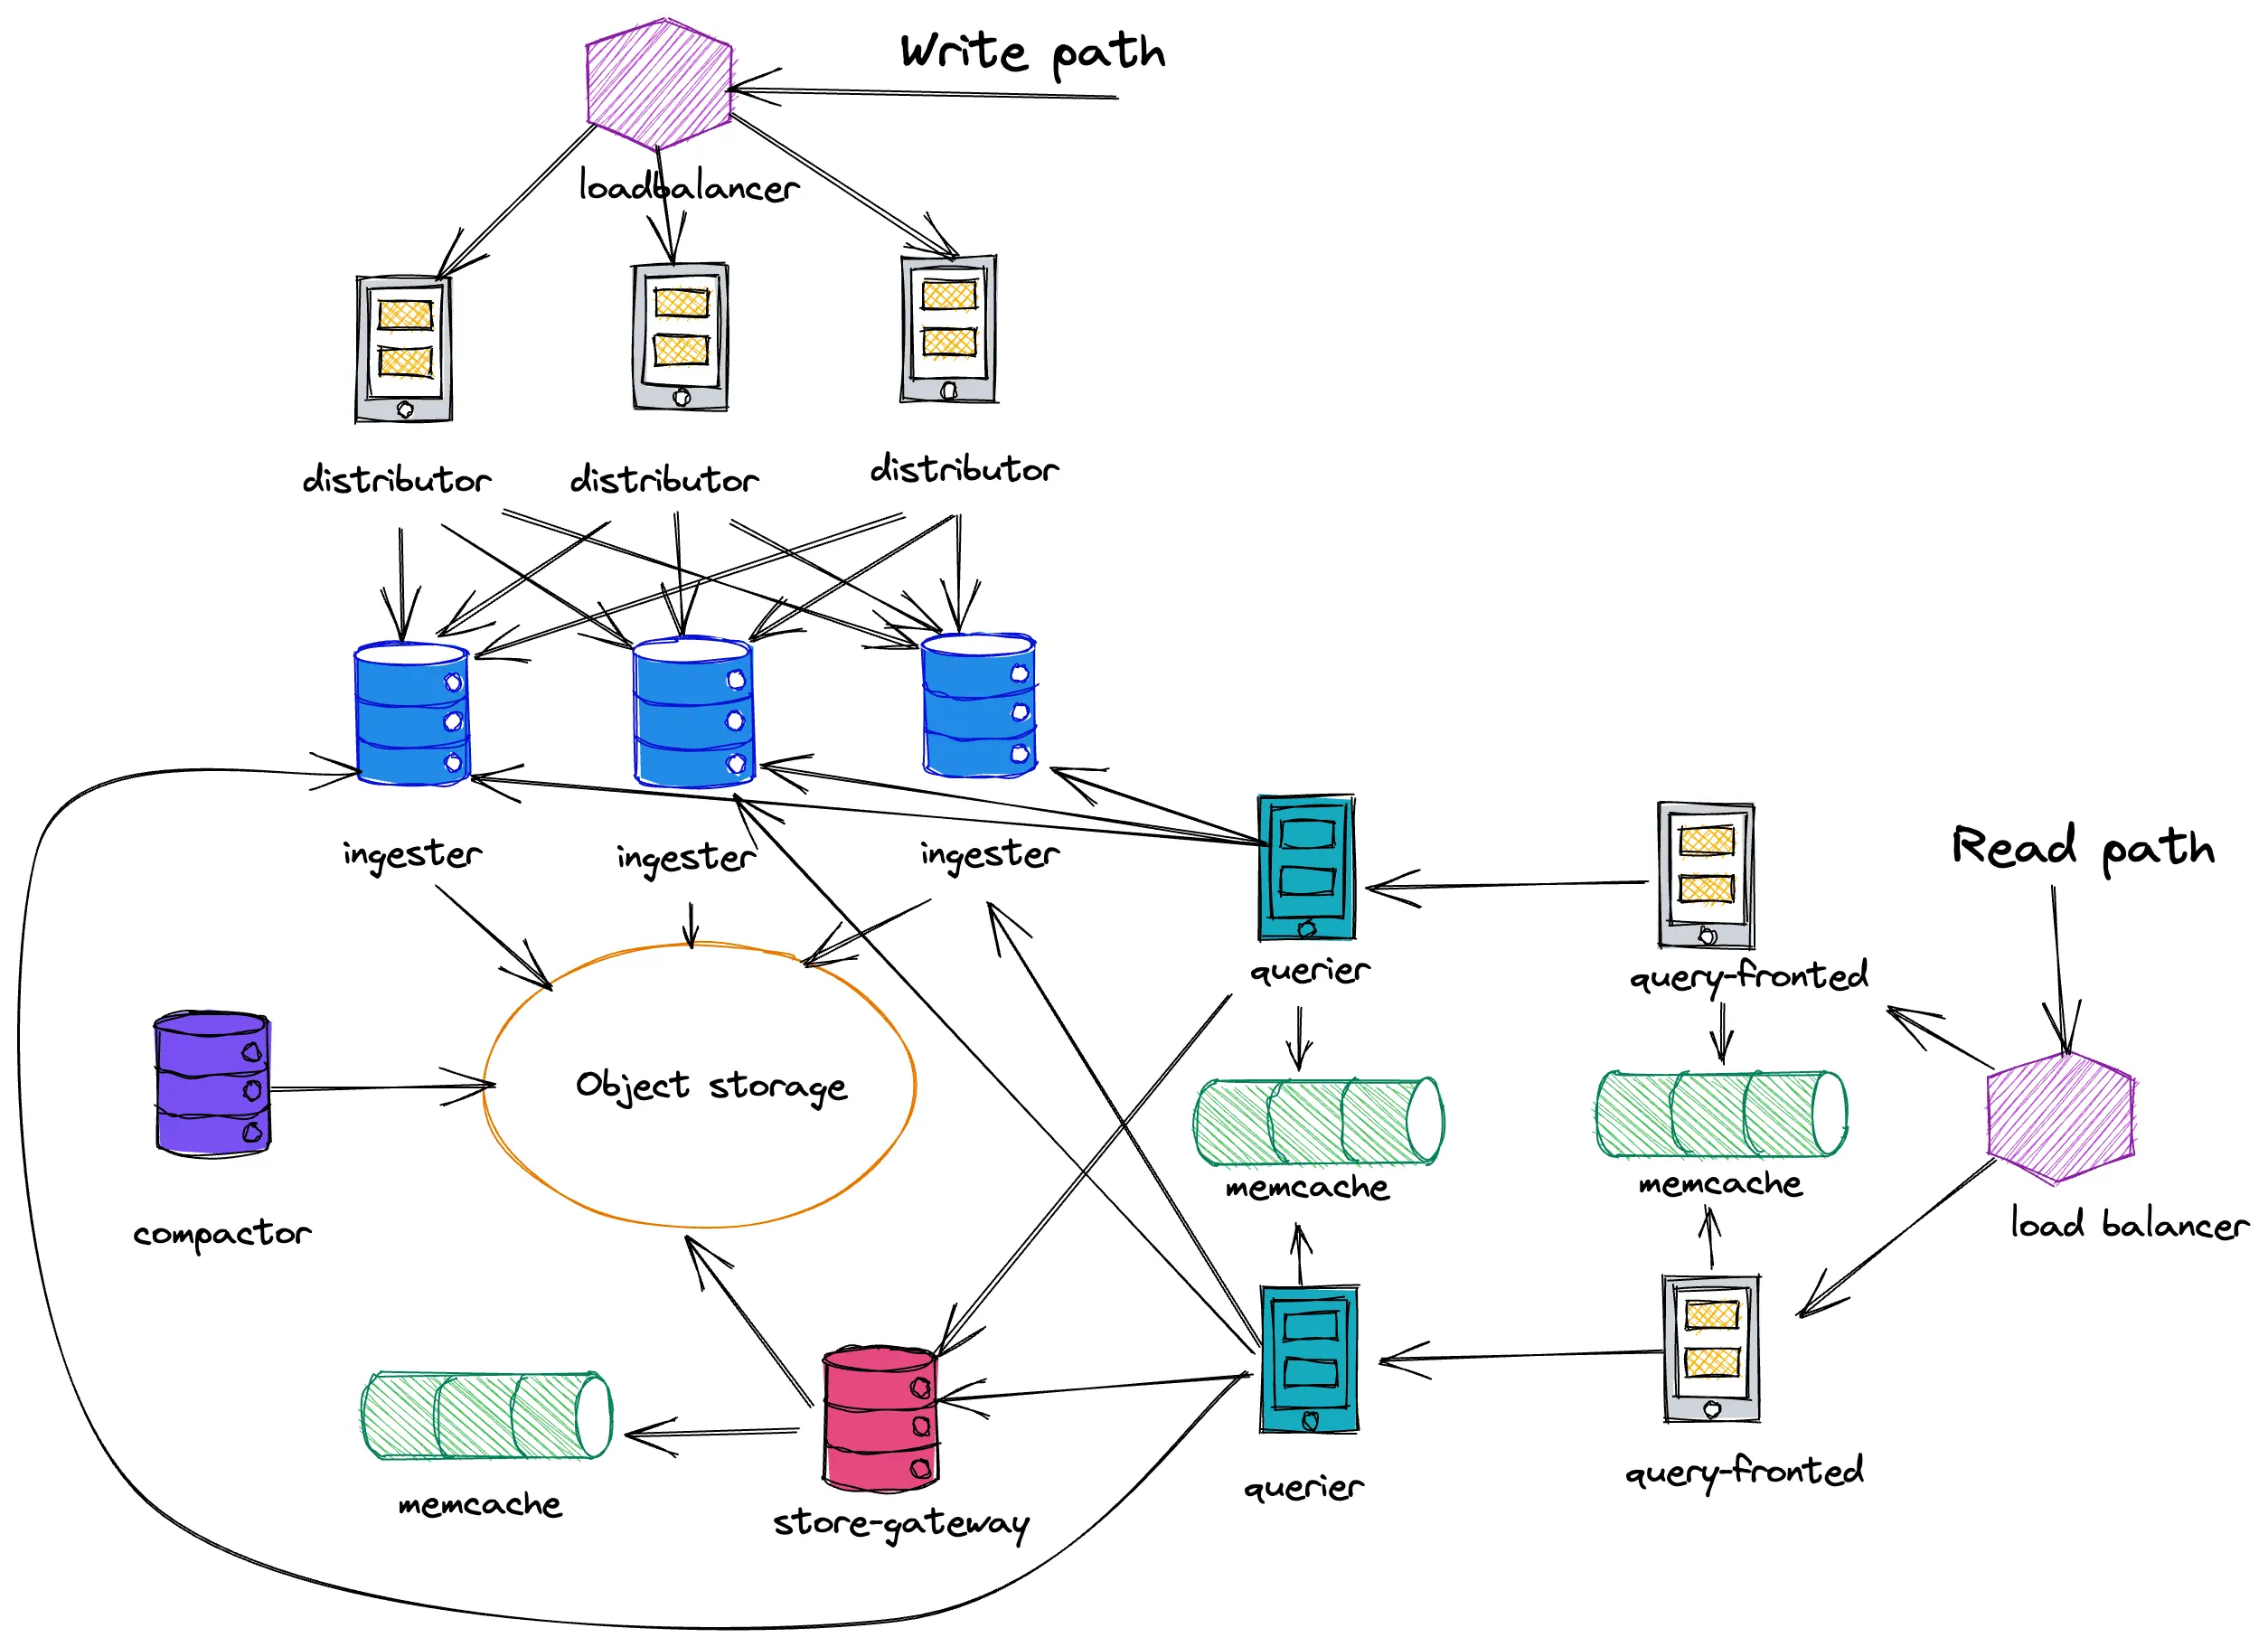 Mimir distributed architecture
Mimir has 7 different components in the picture and makes the first impression of a complicated system. Thankfully, helm chart makes things easier and also has recommendations for resource allocations depending on the payload. The recommendations for large workload require about 140 CPUs and 800GB of memory for 10 million active series. The requirements are way too high for a simple benchmark, so I started with the recommended configuration for small workload oriented on 1 million active series with resource requirements of around 30 CPUs and 200GB of memory.
With a few test runs, I realized that recommended capacity planning is quite conservative. Setup for small workload was perfectly capable of twice more than that. And with some manual tweaks of the component’s resources it was able to handle much more:
| Component | Replicas | CPU | Mem (GiB) |
|---|---|---|---|
| compactor | 1 | 1.2 | 2 |
| distributor | 5 | 2 | 6 |
| ingester | 5 | 4 | 25 |
| querier | 4 | 2 | 24 |
| query-frontend | 1 | 2 | 6 |
| store-gateway | 1 | 1 | 6 |
| various caches | 1* | 18 | |
| Total | 43.2 | 283 |
*1 - there are about 7 cache replicas and overrides_exporter in the helm chart with no
explicit limits set. I assume they altogether consume ~1 CPU.
The complete override list for helm chart values can be found here.
During the tests I had to bump the following limits:
distributor:
  extraArgs:
    distributor.ingestion-rate-limit: "10000000000000"

ingester:
  extraArgs:
    ingester.max-global-series-per-user: "0"
    ingester.max-global-series-per-metric: "0"

querier:
  extraArgs:
    querier.max-fetched-chunks-per-query: "8000000"

mimir:
  structuredConfig:
    limits:
      out_of_order_time_window: 1h
I used release grafana/mimir:2.2.0 in this benchmark.
For monitoring of deployed setup I used dashboards and recording rules listed here. The list of dashboards is very rich and detailed, but I found it not very convenient due to the following reasons:
- I didn’t find a dashboard with a global overview, just to show if everything is ok with the cluster;
- some panels in dashboards require recording rules to be deployed, which is an extra step someone might miss;
- some panels rely on metrics with
cortex_prefixes and selectors likejob=~"(query-frontend.*|cortex|mimir)". Such a mix of Cortex and Mimir prefixed metrics might be confusing at first.
In general, I find Helm chart very useful and easy to understand. Mimir’s team did a great job here by making installation easier for newcomers.
VictoriaMetrics setup
#
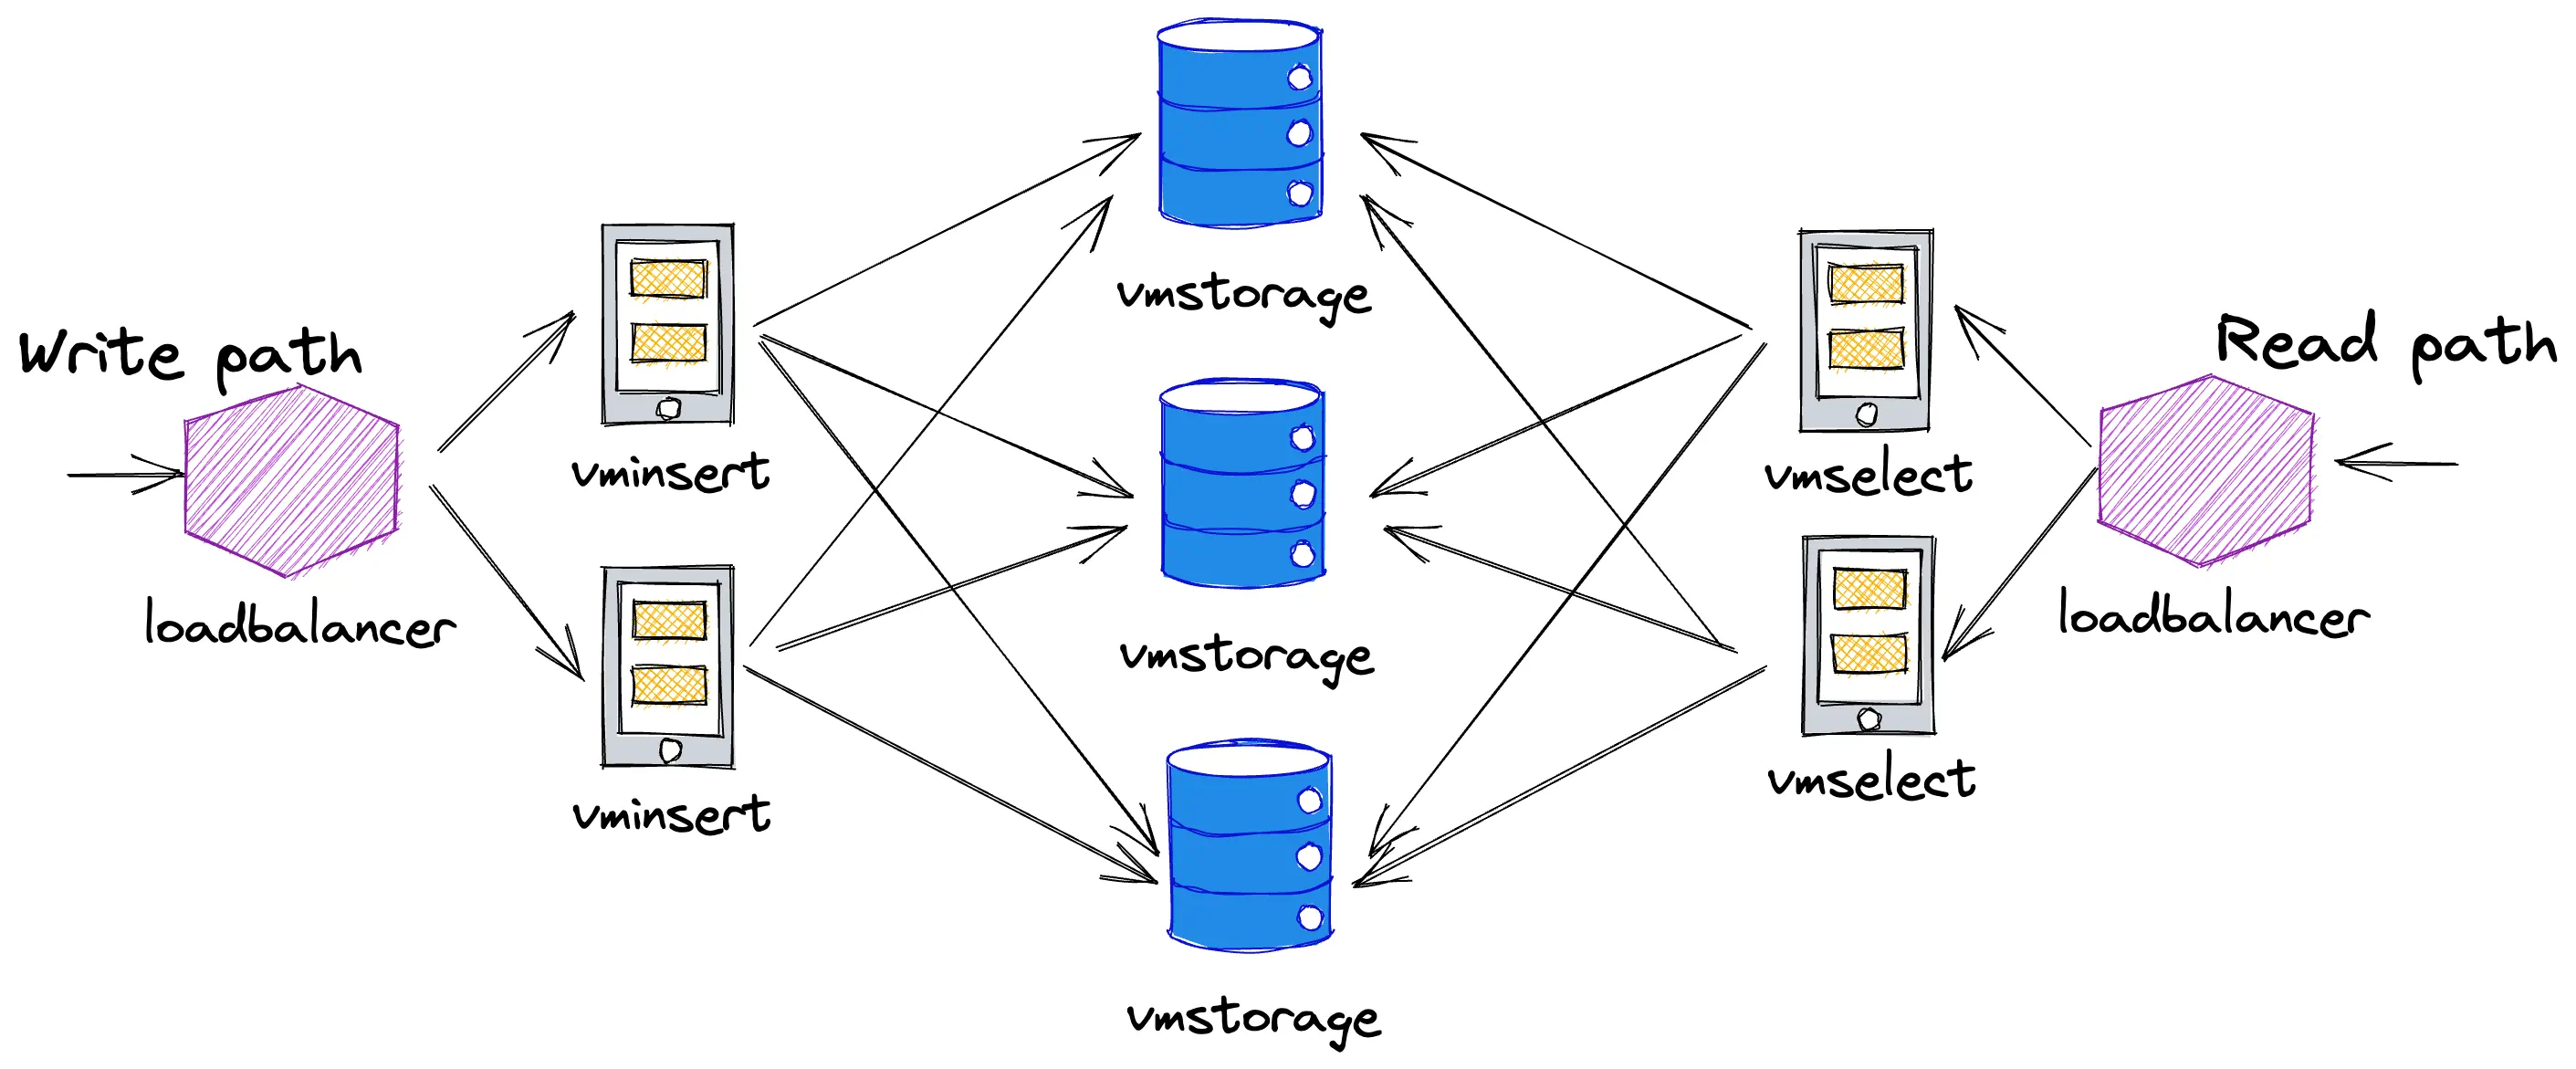
VictoriaMetrics cluster architecture looks as the following:
VictoriaMetrics cluster architecture
VictoriaMetrics has 3 different types of components and also can be deployed via helm chart. Components of VictoriaMetrics cluster are different to Mimir’s components, as well as their resource profiles. While some Mimir’s components need extra memory, VictoriaMetrics components need extra CPUs. So with resource allocation, I’ll try to remain in boundaries set by allocation for Mimir:
| Component | Replicas | CPU | Mem (GiB) |
|---|---|---|---|
| vminsert | 4 | 2 | 4 |
| vmselect | 2 | 8 | 16 |
| vmstorage | 10 | 2 | 16 |
| Total | 44 | 208 |
Please note, we recommended to run a cluster with big number of small vmstorage nodes instead of a cluster with small number of big vmstorage nodes
VictoriaMetrics resource allocation exceeds CPU limit by ~1 core and uses about 80GiB less memory. The complete override list for helm chart values can be found here.
VictoriaMetrics is configured with -replicationFactor=2, which is different
to the default replication factor for Mimir.
This is the recommended value for VictoriaMetrics, and it will be covered in more detail a bit later.
I used release VictoriaMetrics/VictoriaMetrics:1.80.0-cluster in this benchmark.
VictoriaMetrics is equipped with Grafana dashboard and pre-defined alerting rules for self-monitoring.
The benchmark
#
Quick stats
#
- the benchmark has run for 24h;
- the total number of sent samples to VictoriaMetrics and Mimir is ~31 billion:
360K samples/s * 86400; - the total number of new time series generated during the benchmark is ~13.6 million:
5.5M initial series + 6K series/min * 60min * 24.
In the used benchmark utility, the ingestion load is generated by vmagent. It exposes a lot of useful metrics and curious readers can investigate them on the Grafana dashboard snapshot. According to the metrics, both remote storages were fine with the ingestion. No errors were returned, no data was dropped, every metric was delivered as expected.
As was mentioned previously, both VictoriaMetrics and Mimir provide tools and dashboards for monitoring. For being objective while comparing the stats, I’ve compiled the new Grafana dashboard using the same queries for disk, memory and CPU usage which was used in Mimir’s dashboards. Such panels as “Ingestion rate”, “Active time series” or “Latency” are using different metrics because they’re exported by internal components of each solution. The snapshot of this dashboard is available here. Details about each used query can be found in the left top corner of the panel.
Results
#
Both, Mimir and VictoriaMetrics, were perfectly capable of handling ingestion rate of 360k samples/s:
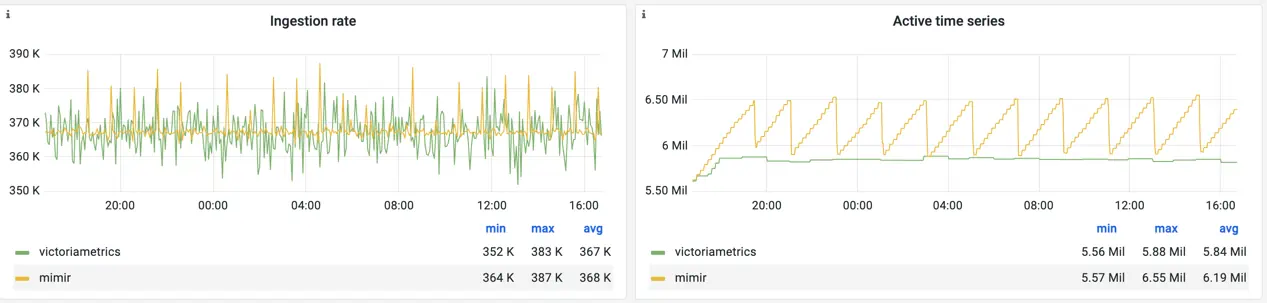 Ingestion rate and number of active time series for Mimir and VictoriaMetrics
The number of active time series between VictoriaMetrics and Mimir is a bit different because both solutions count them differently. Due to the non-zero churn rate, the number of active time series for Mimir is constantly growing and resets back every 2h when a new TSDB block is created.
Ingester, Mimir’s component responsible for receiving and processing writes, stores received data in-memory. Such an approach significantly reduces write amplification and helps touch the disk less frequently. But every 2h (is configurable) ingester needs to flush all buffered data on disk, create a new TSDB block and upload it to the object storage. This operation has an effect on the disk usage metrics:
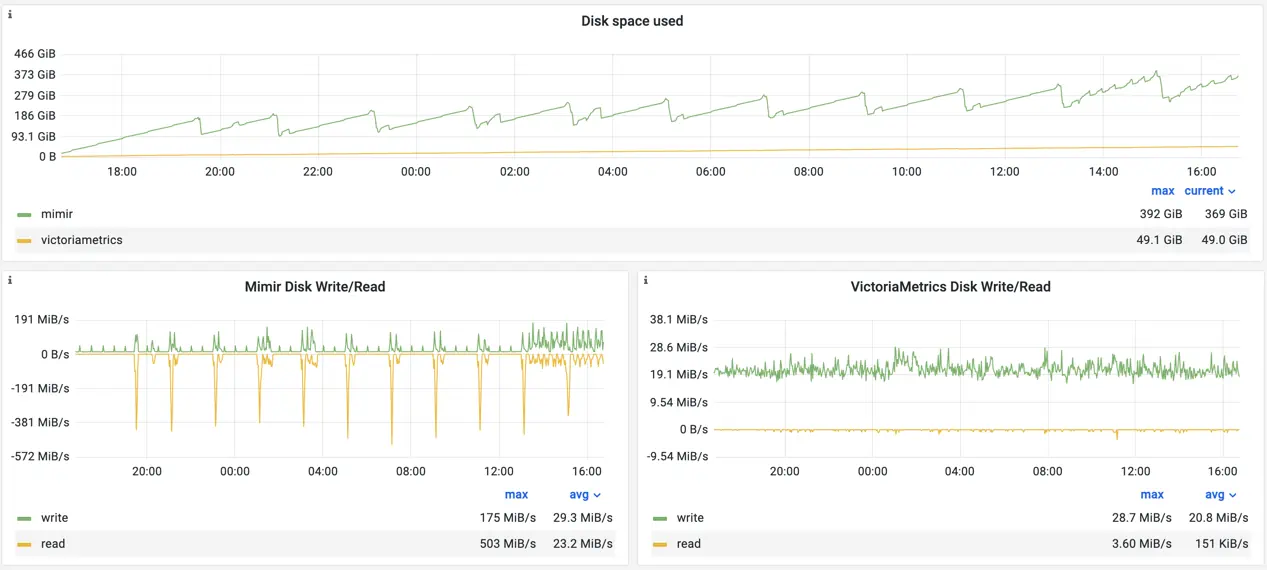 Disk stats for Mimir and VictoriaMetrics
While most of the time Mimir’s disk IO remains quite low and almost 2x times lower than for VictoriaMetrics, every 2h Mimir starts creating a TSDB block and consumes additional disk resources.
The disk space usage between solutions is 49GiB for VictoriaMetrics and 369GiB for Mimir. Please note,
the panel accounts only for local filesystem size. Mimir also uses Google Cloud Storage for long term storing,
which accounts for an additional 149GiB:
gsutil du -sh gs://mimir-bench-tsdb/
149.7 GiB    gs://mimir-bench-tsdb
An important note is that ingester stores TSDB blocks on the local filesystem up to 24h by default, see -blocks-storage.tsdb.retention-period. So the occupied disk size on the local filesystem can be significantly reduced. But still, only long term storage occupies 3x times more space than VictoriaMetrics local storage in this test.
Additional detail has been discovered after the test was made. The compactor
runs compaction jobs for merging data blocks at object storage on multiple time intervals: 2h, 12h and 24h by default.
Since the test was running only for 24h, not all compaction jobs could have happened. The proper compression
comparison would require running the benchmark for multiple days.
The CPU usage of VictoriaMetrics is lower than Mimir’s:
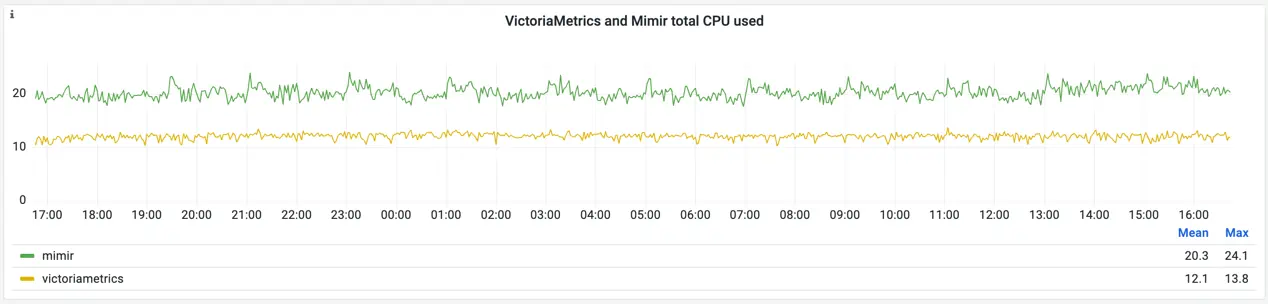 CPU usage for Mimir and VictoriaMetrics
For curious readers, the snapshot contains detailed information about per-pod CPU usage. The metrics prove once again that both solutions have very different architecture and components design. For Mimir, the top CPU users are ingesters - they alone are responsible for consuming 13 CPU cores on average, with spikes up to 18 and utilization of 80% of their limits. For VictoriaMetrics, the most of CPU is used by vmselects: 7 CPUs on average, with spikes up to 12 CPU cores and utilization of 70% of their limits. On average, VictoriaMetrics consumes 1.7 times less CPU than Mimir in this benchmark.
The memory usage is also different between Mimir and VictoriaMetrics:
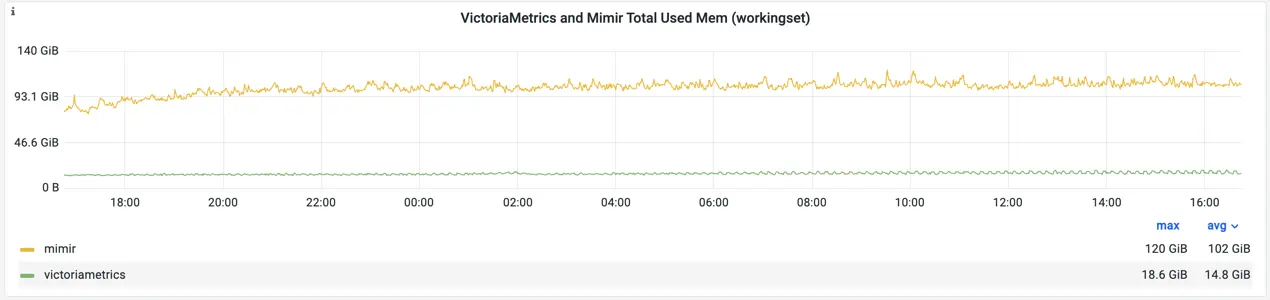 Memory usage for Mimir and VictoriaMetrics
VictoriaMetrics uses about 5 times less memory comparing to Mimir in this benchmark. More detailed comparison between components can be found in the snapshot. The most valuable takeaway is that Mimir’s ingesters are running very close to the limit with 80-90% of utilization. This means that a further increase of the load could lead to OOM exceptions.
The latency for read queries has the following stats:
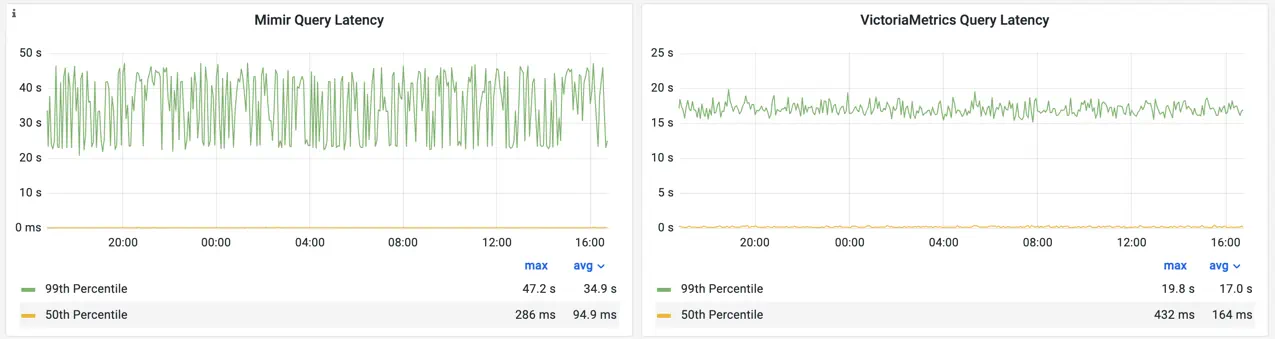 Read queries latency for Mimir and VictoriaMetrics
As was mentioned, read load consists of instant queries only and is generated by an external ruler which executes alerting rules for node_exporter metrics. The list of rules contains lightweight queries and heavy queries touching hours of data. This affects the latency, making the 50th percentile for both solutions between 100 and 500ms. But the 99th percentile hits 47sec at max for Mimir and 20sec at max for VictoriaMetrics.
I didn’t test range queries in this benchmark. This would be a great test to run in the future.
Replication
#
Both solutions have a different approach to replication.
In Mimir, each series is replicated by distributors to the ingesters. If the Mimir cluster loses an ingester, the in-memory series held by the lost ingester are available at least in one other ingester. So read queries will succeed while at least one replica is alive. Write queries would require a quorum of replicas to succeed, so with replication factor of 3 only one replica can be lost.
When ingester comes back, it restores its in-memory state from reading the WAL. Restored ingester might be missing recent data while it was offline, so queriers need to query all ingesters and merge the data to fill the gaps if any. Every 2h, each ingester uploads TSDB data block to the object storage, where compactor merges the blocks, fills gaps if any, and deduplicates the data, so only one sample is stored for long term.
Mimir’s replication protects from losing the recent data held in ingester’s memory in case of planned restarts or unexpected ingester crashes due to hardware issues. Replication on ingesters doesn’t protect from unreachable object storage or data corruption on the object storage (by human mistake or compression bug). Object storage data safety becomes a responsibility of the storage provider.
Replication at VictoriaMetrics protects from data loss when some of vmstorage nodes lose their data.
vminsert at VictoriaMetrics cluster replicates every incoming sample to -replicationFactor distinct vmstorage nodes.
For example, if -replicationFactor=2, then it is safe to drop an arbitrary vmstorage from the cluster
without any data loss - all the queries over arbitrary time ranges continue returning full responses.
See these docs for details.
When some of vmstorage nodes are temporarily unavailable, VictoriaMetrics cluster continues accepting incoming samples
and replicating them among the remaining vmstorage nodes according to the given -replicationFactor.
This means that VictoriaMetrics doesn’t lose incoming samples when some of vmstorage nodes are unavailable.
VictoriaMetrics cluster continues serving incoming queries by fetching the needed data from the remaining vmstorage nodes.
Some queries in this case may return incomplete results if they rely on the historical data stored at unavailable vmstorage nodes.
Responses for such queries are marked as incomplete. See these docs for details.
vmstorage nodes do not have WAL intentionally,
so they could start up and become operational very fast.
VictoriaMetrics cluster architecture allows upgrading and reconfiguring cluster components without interruptions on data ingestion path and with minimal interruptions on query path even if cluster-level replication is disabled. See these docs for details.
While in both cases replication is about data safety, it still does not guarantee it. We run the benchmark in Google Cloud using SSD persistent disks (SSD PD) for local file system and Cloud Storage as object storage for Mimir. SSD PD has durability of 5 nines and uses x3 replication under the hood. If we assume that Cloud Storage has high enough availability level to not replicate it, we can have the same assumption for SSD PD as well and get parity in data availability. Even if Cloud Storage has higher availability promises than SSD PD - both, Mimir and VictoriaMetrics, will face write and read issues if SSD PD fails, despite the replication factor.
Replication does not protect from out of memory exceptions (OOMs) caused by insufficient resources or sudden increase of workload. In VictoriaMetrics and Mimir, ingested time series are evenly sharded across components (vmstorage and ingester respectively). So if one of the components starts to experience OOMs because of being overloaded, it is very likely other components will do as well. This situation may lead to data loss due to a cascading failure, where components start to crash one by one. Only adding more resources or reducing the workload may help to get out of the such situation.
For VictoriaMetrics I recommend having replication factor of 2, which protects from losing a vmstorage node during maintenance or disk failure. If higher availability is required, we recommend offloading replication to durable persistent storages such as SSD PD or allocating extra resources to the cluster.
Mimir’s ability to deduplicate data after replication is very cool. It does not only reduce the storage cost,
but also supposed to improve the read performance. VictoriaMetrics never removes duplicates for the replicated data
in order to guarantee that the data remains available for querying if data at some of vmstorage nodes are lost.
Summary
#
Both solutions did a great job in handling the load. No fails or disruptions happened, and systems were stable during 24h of constant write and read pressure. However, the different architecture of both solutions has their impact. I can say for sure, that Mimir is much more “memory-hungry” than VictoriaMetrics - it needs 5x times more memory for the same load. Memory was the bottleneck for Mimir during further scaling of the workload. Even if I decrease the replication factor for ingesters from 3 to 2, it still will need much more memory than VictoriaMetrics.
While none of the clusters hit their CPU limits, VictoriaMetrics consumed ~x1.7 less CPU on average than Mimir.
Mimir has better 50th percentile latency, but twice as higher for 99th percentile than VictoriaMetrics. It is unclear what causes so high spikes in the latency for Mimir. However, reading the documentation and other tests conducted by Grafana Labs team makes me think that Mimir can outperform VictoriaMetrics while reading metrics on big time ranges where it needs to scan already deduplicated data.
Disk space usage was lower for VictoriaMetrics. If we forget about ingesters local file system and compare only Mimir’s long-term storage to VictoriaMetrics disk usage - the latter is still using 3x times less disk space. And while object storage is much cheaper compared to SSD PD, it also implies additional costs for data access. It would be interesting to read in comments about costs for metrics storing from Mimir’s and VictoriaMetrics users.
Mimir has great scale potential and each component can be easily scaled. It also has regional aware replication out of box, configurable limits on ingesters and queriers, efficient data storage, and plenty of other features like query sharding. The documentation still requires some polishing. But overall I liked the product!
VictoriaMetrics showed itself more resource efficient and performant compared to Mimir on the same hardware in this benchmark. Operationally, VictoriaMetrics scaling is a bit more complicated because data is stored on stateful vmstorage nodes. This makes scaling down the number of vmstorage nodes non-trivial. I recommend always planning cluster’s architecture with a decent number of vmstorage nodes. See more details about scaling in our documentation.
In numbers, benchmark results are the following:
- VictoriaMetrics uses x1.7 less CPU for the same workload;
- VictoriaMetrics uses x5 less RAM for the same amount of active series;
- VictoriaMetrics uses x3 less storage space for the 24h of data collected during the benchmark.
Bonus: exploring the limits
#
In the bonus round of benchmark, I’ll test only VictoriaMetrics, because increase of the load for Mimir starts to result into OOM exceptions on ingesters. Only two params were changed since the previous benchmark:
# defines the number of node_exporter instances to scrape
targetsCount: 8000
# defines how many pods of writers to deploy.
# each replica will scrape targetsCount targets and will have
# its own extra label `replica` attached to written time series.
writeReplicas: 4
The change increases the number of unique targets from 6000 to 8000 and launches 4 replicas of vmagent (each
with unique label), which in total increases the load by 8000 * 4 / 6000 =~ 5 times.
The complete override list for helm chart values can be found here.
Quick stats
#
- the benchmark has run for 3h;
- the total number of sent samples to VictoriaMetrics is ~19.5 billion:
1.8 million samples/s * 3 * 3600; - the total number of new time series generated during the benchmark
is ~31.8 million:
27.5 million initial series + 24K series/min * 60min * 3.
Results
#
Benchmark results are captured on the snapshot of the dashboard used in the previous benchmark round:
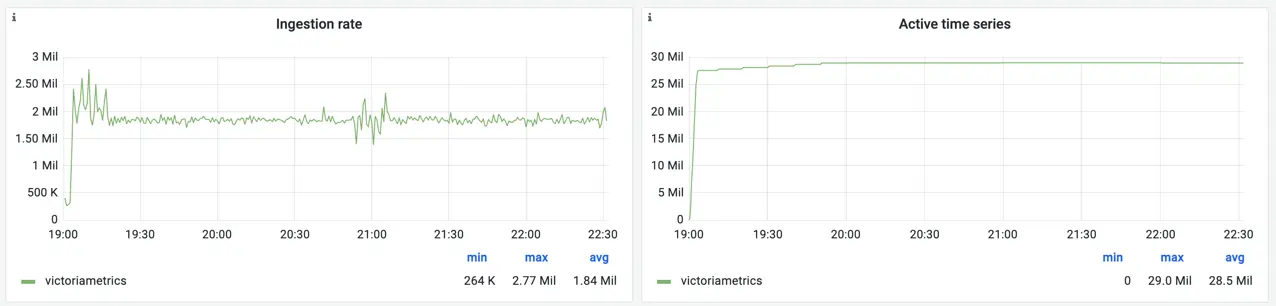 Ingestion rate and active time series for VictoriaMetrics
I’ve also captured a snapshot of VictoriaMetrics cluster dashboard with more detailed metrics for each component.
VictoriaMetrics remained stable during the benchmark, successfully receiving about 1.8 million samples/s and 29 million of active time series (58 million including replication). The CPU utilization significantly increased compared to the previous test:
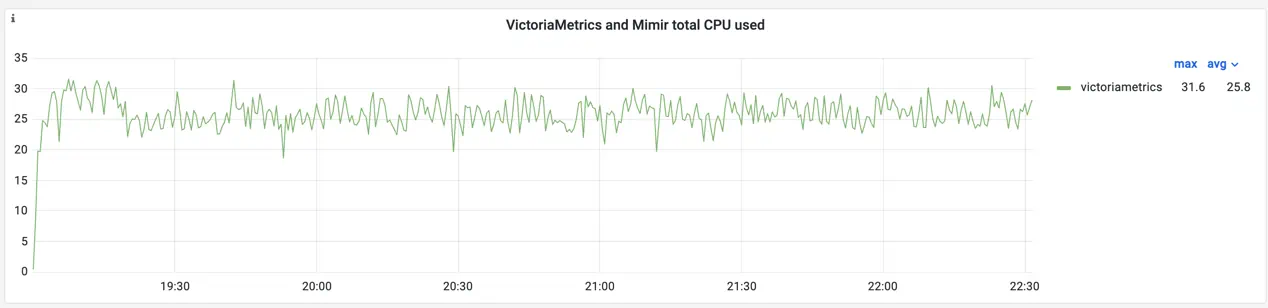 CPU usage for VictoriaMetrics
The average usage now hits ~26 cores out of 32 available. If check CPU utilization per pod we see that vmstorages are running on average at 80% with peaks up to 99%. It means for further scaling requires more CPU for vmstorage nodes.
On contrary, VictoriaMetrics uses only 1/4th of the allowed memory:
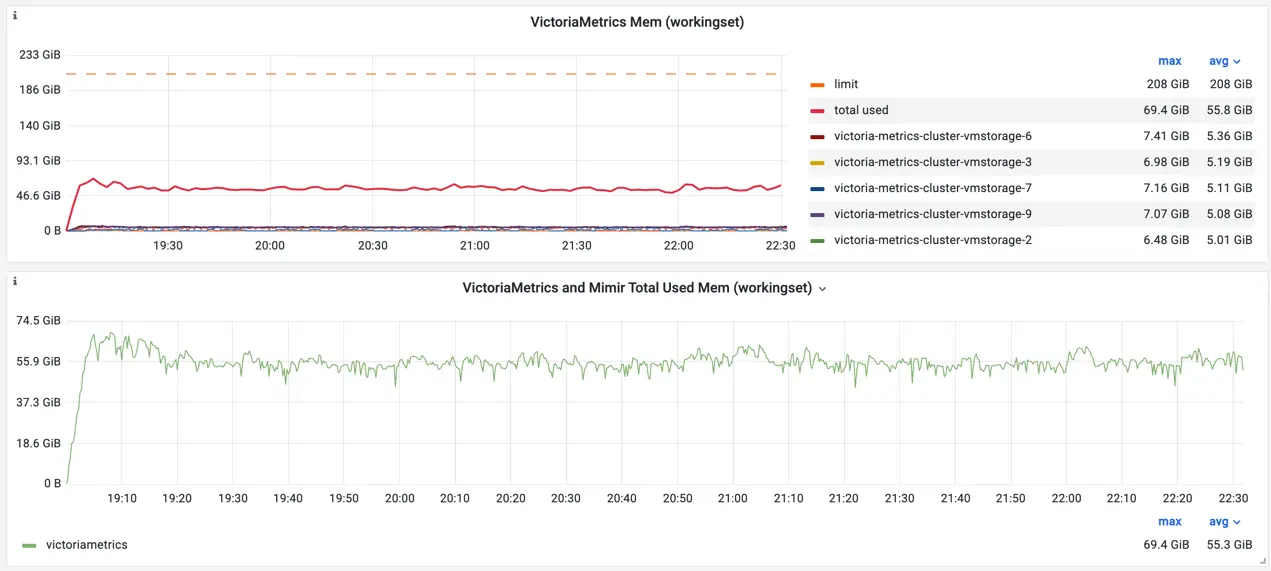 Memory usage for VictoriaMetrics
The average utilization of memory on the storage nodes is about 30%. It means, the number of active time series can be doubled if the ingestion rate will remain the same.
Query latency significantly degraded with the increase of load:
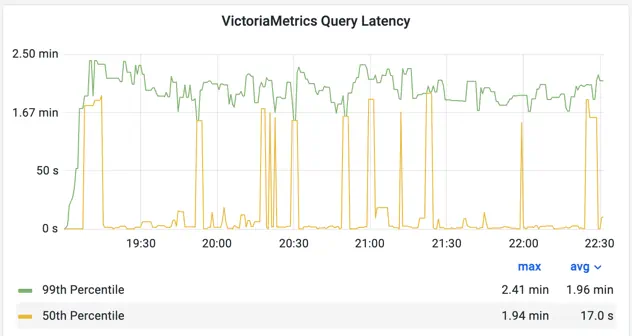 Read queries latency for VictoriaMetrics
Taking a closer look revealed poor balancing between vmselects. VictoriaMetrics cluster helm chart uses standard Kubernetes service for load balancing which does not provide much flexibility. Based on results of this benchmark, we plan to use a better balancing strategy via nginx. Similar to how it is done in Mimir’s helm chart.
Summary
#
In this benchmark I conducted two rounds of tests.
In the first round Mimir and VictoriaMetrics were running under same load and on the same hardware. Benchmark results were the following:
- VictoriaMetrics uses x1.7 less CPU for the same workload;
- VictoriaMetrics uses x5 less RAM for the same amount of active series;
- VictoriaMetrics uses x3 less storage space for the 24h of data collected during the benchmark.
In the second round, the load was increased by 5 times using the same hardware. It wasn’t enough resources for Mimir to handle the load, so only VictoriaMetrics stats were available.
Benchmark articles are always an interesting thing to read. They’re written with an intention to demonstrate strengths and weaknesses of different solutions, to show impressive numbers and conclusions. However, I must warn that no benchmark is 100% objective; and they can have a weak correlation with reality. I encourage readers to always run their own benchmarks for their specific needs, hardware and data. Only then you can be sure if the tested solution fits your needs and expectations.
Special thanks to Nikolay Khramchikhin for assisting with this blog post, and to Mimir’s engineering team for consulting!
Update: see slides based on this blogpost here.
Leave a comment below or Contact Us if you have any questions!
comments powered by Disqus