



















VictoriaMetrics
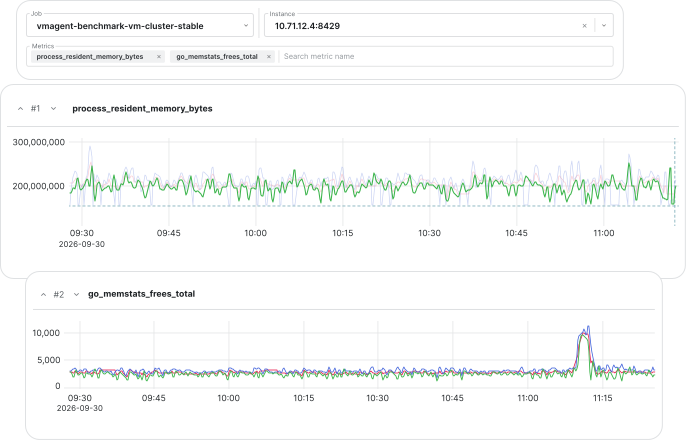
Scale Your Metrics
High-performance time series database & monitoring solution.
- 80%
- 2.5×
By Engineers For Engineers
Simple, Reliable, Efficient


Start fresh or integrate with your existing stack. Choose the metrics, logs, or traces you need, then scale cost-efficiently.
Handle Growing Telemetry with Less Infrastructure
Store metrics, logs, and traces in purpose-built databases. Scale each signal independently without expanding every backend at once.

Scale Your Metrics
High-performance time series database & monitoring solution.
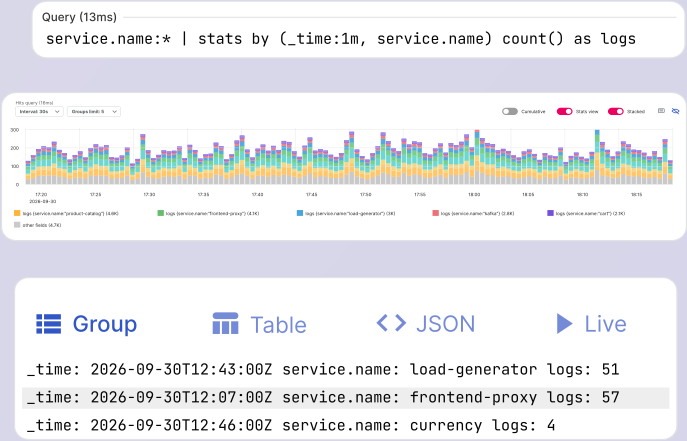
Schema-Free Log Ingestion
Collect logs without an upfront schema, then filter and analyze them with LogsQL.
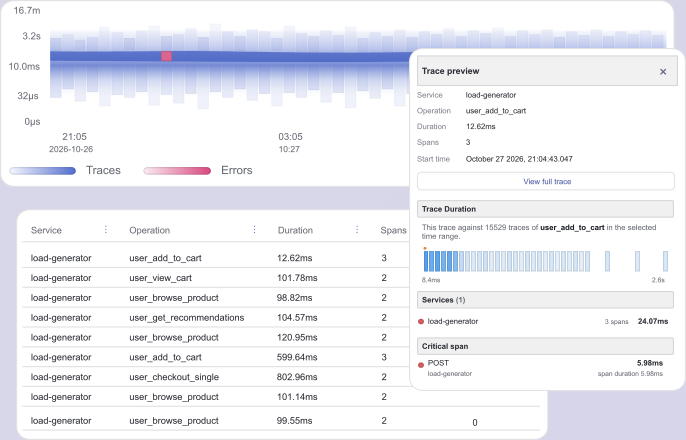
Follow Your Requests
OpenTelemetry and Jaeger-compatible backend for storing and inspecting traces
We’re Here to Help You Scale
Expert support & guidance on the most complex observability setups.
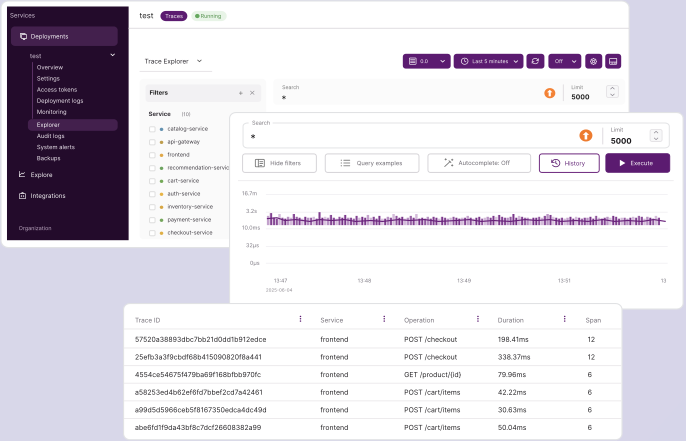
You Monitor. We Manage.
Focus on monitoring while VictoriaMetrics operates everything.
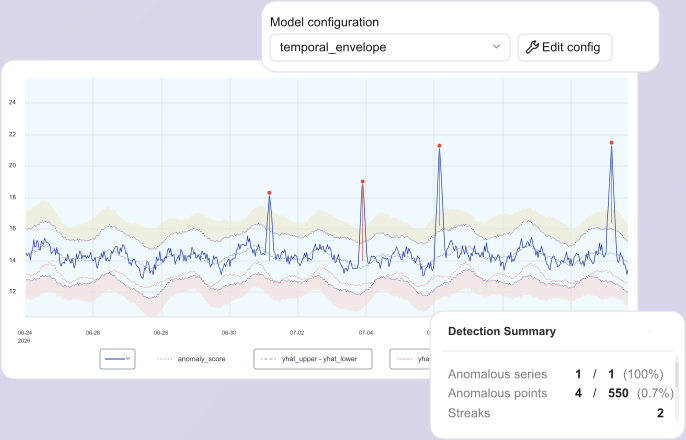
Detect Unusual Metric Behavior
ML-based analysis for your time-series data powered by AI.
Fortunately, with VictoriaMetrics, we were able to sign a contract to get the support we needed to confidently run a monitoring system at our scale. The numbers speak for themselves. Our proof-of-concept trial showed dramatically reduced compute and storage costs, translating into a 10x lower AWS bill.
Simple, reliable, efficient observability for metrics, logs and traces.
Explore our latest blogs on all things observability, featuring deep dives, practical tutorials, and expert perspectives from our engineering and product teams.
October’s roundup brings alerting for logs and traces in VictoriaMetrics Cloud, production-ready SSO in vmauth, peer-group outlier detection in vmanomaly, and security fixes across the ecosystem.

VictoriaMetrics Expands in North America as Spotify and MongoDB Use Our Open-Source Stack to Run Observability at Scale
Q3 2026 brought VictoriaTraces to VictoriaMetrics Cloud, completing the stack with metrics, logs and traces. We also revamped the Overview and Monitoring pages for full transparency, added alerting for logs and traces, enabled stream aggregation for VictoriaMetrics Single, and announced code-named project Visum: our upcoming visualization tool.
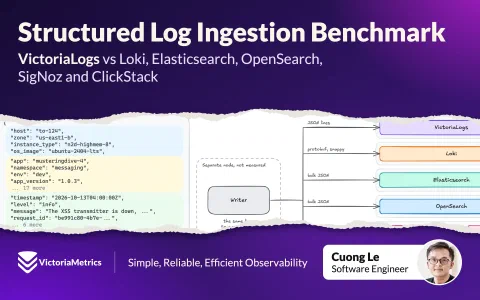
We benchmarked structured log ingestion in VictoriaLogs, Loki, Elasticsearch, OpenSearch, SigNoz and ClickStack, and explain the trade-offs behind each result.
The VictoriaLogs data source for Grafana now ships with Drilldown, a point-and-click way to explore logs without writing queries. In this post, we use it to investigate failing payments in the OpenTelemetry demo shop, going from a single warning to the release, the log message, and the line of code behind it, all without typing a line of LogsQL.
NVIDIA now ships VictoriaMetrics as the default metrics backed in their self-managed Cloud Functions, and CoreWeave uses VictoriaMetrics for infrastructure monitoring and AI capabilities.
Many thanks for submitting our Contact Us form. One of our team members will be in touch shortly to follow up on it with you.