VictoriaTraces:
Fast, Open Source,
Distributed Tracing
at Scale
Built for Unified, Reliable, Efficient Observability
Product Information
VictoriaTraces provides open-source trace ingestion, storage, and search
with the operational simplicity VictoriaMetrics is known for.
3.7x
less memory than similar solutions- Built to work alongside metrics and logs
- Analyzes patterns across many traces and spans
2.7x
less CPU than equivalent solutions- Ingests and stores distributed traces at scale
- Supports popular tracing standards: OpenTelemetry, Jaeger
1.8x
less disk space than comparable solutions- Search traces instantly
- Trace-driven alerts on span attributes, duration and errors
Easy to Integrate
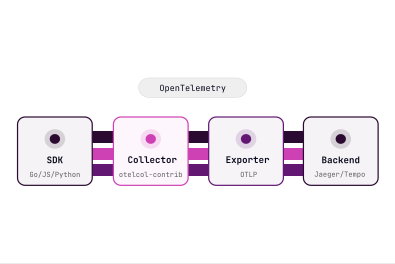
VictoriaTraces works with OpenTelemetry for ingestion, and with Grafana and Jaeger for querying and visualization, so you can plug it into existing tracing workflows without changing your whole stack.
OpenTelemetry SDK / Collector
Jaeger
Grafana
Bindplane
Perses
Top Features
Observability Combine Metrics, Logs, and Traces into a single observability stack, with signals correlated via shared OpenTelemetry attributes.Observability Multi-Tenant & TLS Auth
Isolate tenants with strict data boundaries, enforce TLS across all endpoints, and manage access with fine-grained auth.Open standards OpenTelemetry Native
Ingest OpenTelemetry spans over OTLP HTTP/gRPC directly from SDKs and collectors. Keep your existing OTel-instrumented services without adding custom agents.Open standards Jaeger-Compatible
Expose Jaeger Query Service APIs so you can plug VictoriaTraces into existing Jaeger UIs and Grafana Jaeger datasources without changing your dashboards.Scalability Flexible Deployment
Start with a single all-in-one binary for simple setups, then scale out horizontally with the cluster version when volume grows.Scalability Fast Trace Search
Optimized database that can handle terabytes of spans while keeping trace lookup and span exploration fast.Scalability Built-in Retention
Configure trace retention without external lifecycle or data-management services.Scalability Efficient Storage
High compression keeps traces resource-efficient and query performance at scale.Analytics & Alerting Trace-Driven Alerting
Derive metrics from trace spans and use vmalert plus LogsQL to alert on latency, errors, or other span attributes - not only on high-level metric dashboards.Analytics & Alerting LogsQL Analysis & Alerting
Use LogsQL to analyze trace spans in VictoriaTraces and trigger alerts through using the same syntax you use for logs.
Key Benefits
Key Benefits
Key Benefits
Key Benefits
Key Benefits
Unified observability
Run traces alongside VictoriaMetrics and VictoriaLogs to correlate signals without switching tools.Complete context
Integrate traces with metrics and logs through your UI or AI agent to get the full picture of what’s happening right now.Better visibility into distributed systems
without changing your observability workflow.
OpenTelemetry-native ingestion
Send OTLP traces directly from existing OpenTelemetry SDKs and collectors.Jaeger-compatible querying
Use familiar Jaeger and Grafana workflows through the Jaeger Query Service APIs.One observability stack
Connect traces with VictoriaMetrics and VictoriaLogs through shared OpenTelemetry attributes.
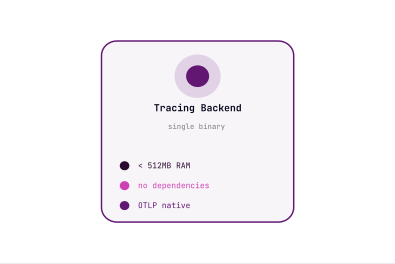
Start with one binary
Deploy a simple all-in-one setup without external dependencies.Scale when needed
Move to the cluster version as trace volume and retention requirements grow.Low operational overhead
Keep trace infrastructure straightforward with built-in storage and retention management.
Trace-driven alerts
Alert on latency, errors, and span attributes with vmalert and LogsQL.Faster root-cause analysis
Search spans quickly to find the service and operation behind an incident.Connected incident context
Correlate traces with matching metrics and logs on the same timeline.
Efficient ingestion and search
Handle high trace volumes while keeping lookup and span exploration fast.Lower resource usage
Use efficient compression to reduce memory, CPU, and storage requirements.Retention under your control
Keep the trace history you need without separate lifecycle-management services.
Typical Use Cases for VictoriaTraces
See how teams use VictoriaTraces to analyse trace data, troubleshoot incidents,
and improve the performance of distributed applications.
- Performance
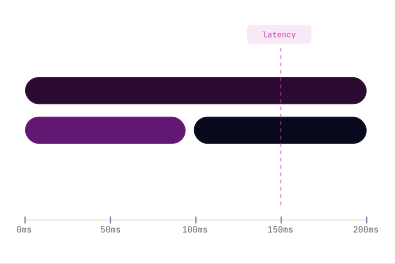
Troubleshooting latency and performance issues in distributed systems.
Inspect end‑to‑end request timelines and latency percentiles from your traces, so you can spot the slow span before it turns into a user‑visible outage.
- Microservices
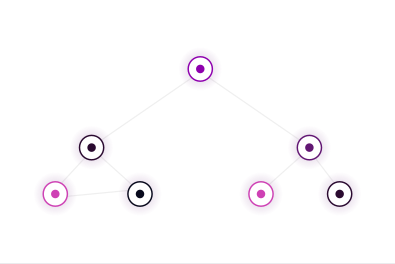
Debugging service-to-service dependencies across microservices.
Use the service dependency graph and trace views to understand where failures start and how they spread across your microservices stack.
- Incident Response
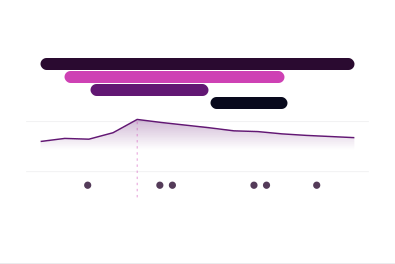
Correlating traces with metrics and logs during incidents.
Pivot from a slow or failed trace to the matching metrics panel or log stream in a few clicks, to keep everything aligned on the same timeline.
- Scalability
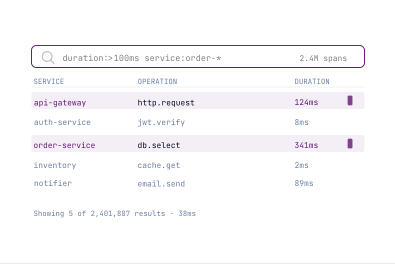
Searching and analyzing spans at scale with low operational overhead.
Run LogsQL queries over millions of spans with low‑latency responses, while VictoriaTraces takes care of data distribution and storage management.
- Standards
Supporting OpenTelemetry-based observability workflows.
Ingest traces directly from OpenTelemetry SDKs and collectors, then query them through Jaeger‑ and Tempo‑compatible APIs so you can keep your existing dashboards and avoid proprietary agents.
- Infrastructure
Simpler tracing backend for teams that want to avoid heavy infrastructure.
Start with a single VictoriaTraces binary and no external dependencies and scale out to a cluster only when you need it.