Ingest logs with OpenTelemetry, Fluent Bit, or Vector
How VictoriaStack Works
Start fresh or integrate with your existing stack. Choose the metrics, logs, or traces you need, then scale cost-efficiently.
Collectors write to the databases through vmauth. Visualization, alerting and AI clients query those databases through a separate vmauth endpoint. vmalert sends alerts to Alertmanager.
Send telemetry with OpenTelemetry, Prometheus remote write, Fluent Bit, or Vector. Query through Grafana using Prometheus-compatible metrics APIs, the VictoriaLogs data source, and Jaeger-compatible trace queries.
VictoriaStack gives SREs, DevOps, and platform engineers control over telemetry costs, retention, and scaling, with purpose-built databases and familiar open source tools.
Observability
Purpose-built Storage
VictoriaMetrics handles high-cardinality time series. VictoriaLogs and VictoriaTraces automatically index log and span fields, so you can search them without setting up custom indexes.
Observability
Simple to Operate
Deploy each database as a single-node binary or a cluster, with sensible configuration defaults and no external caches, databases, or coordination services. Then upgrade each database independently.
Observability
Kubernetes Operator
Manage databases, agents, authentication, and alerting with Kubernetes custom resources and Helm charts. Version deployment configuration.
Open standards
Native OpenTelemetry
Keep existing SDK instrumentation. Configure Collector pipelines to send telemetry to VictoriaStack as your OpenTelemetry backend.
Scalability
Cluster Architecture
Cluster deployments separate insert, select, and storage components. Add capacity for ingestion, queries, or storage as each workload grows.
Scalability
Stream Aggregation
Aggregate incoming metrics by time and labels with vmagent before storage. Reduce stored sample volume and network traffic.
Analytics & Alerting
Alerts and Recording Rules
Configure alerts for metrics, logs, and traces. Deliver notifications through Alertmanager and save rule results as metrics.
Analytics & Alerting
Cross-signal Correlations
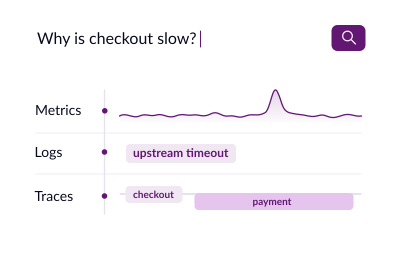
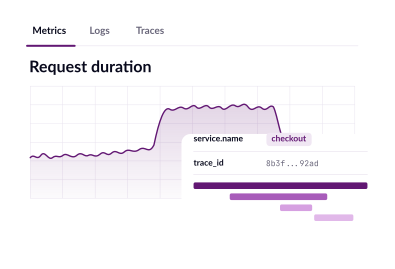
Link metric changes to related events and request timelines through configured Grafana correlations using service attributes and trace IDs.
AI Integration
MCP and Agent Skills
Connect AI assistants through MCP servers and use agent skills to investigate incidents, analyze cardinality, and identify unused metrics.
Self-hosted observability with efficient storage, fewer infrastructure dependencies, and control over how each workload scales.
Key Benefits
Self-hosted observability with efficient storage, fewer infrastructure dependencies, and control over how each workload scales.
Key Benefits
Self-hosted observability with efficient storage, fewer infrastructure dependencies, and control over how each workload scales.
Key Benefits
Self-hosted observability with efficient storage, fewer infrastructure dependencies, and control over how each workload scales.
Key Benefits
Self-hosted observability with efficient storage, fewer infrastructure dependencies, and control over how each workload scales.
Buffer during outages
Native agents queue telemetry on disk when a destination is unavailable and forward it when connectivity returns, no Kafka or RabbitMQ needed.
Replicate to independent backends
Send incoming data to multiple installations for redundancy, including installations in separate availability zones.
Keep healthy destinations receiving data
Each destination has its own buffer, so agents continue sending telemetry to available destinations even when another is unavailable.
Scale the component under load
Add ingestion replicas, query replicas, or storage shards independently in cluster deployments. Keep log spikes from consuming capacity reserved for metrics and traces.
Size each database separately
Run clustered metrics alongside single-node logs or traces. Expand the backend that needs capacity without resizing the others.
Retain what each workload needs
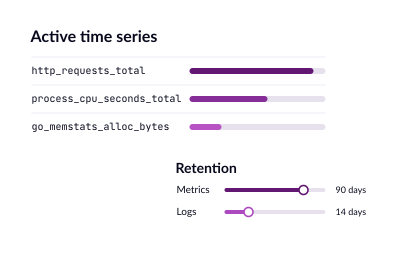
Configure retention per database, keeping longer investigation history where it matters and removing expired data automatically.
Search individual requests
Find logs by request ID, user ID, or IP address without custom indexes. Keep high-cardinality values as ordinary fields.
Accept changing log structures
Ingest new fields without schema migrations, so application changes don’t require redesigning the logging database.
Analyze more than one trace
Use LogsQL to aggregate span durations and errors across requests, services, or attributes to identify recurring problems.
Replace one backend at a time
Adopt individual VictoriaStack databases while keeping the rest of your observability setup running.
Keep existing instrumentation
Redirect supported collectors and OpenTelemetry pipelines to the new backend without replacing application SDKs.
Reuse existing monitoring
Retain metrics exporters, compatible Grafana dashboards, and Prometheus-compatible alerting rules as you migrate.
Separate team and customer data
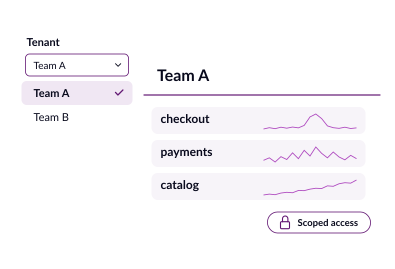
Use distinct tenants in VictoriaMetrics clusters and in single-node or clustered VictoriaLogs and VictoriaTraces deployments.
Route users to authorized tenants
Configure vmauth to authenticate requests and map credentials to tenant IDs, keeping databases inside a protected network.
Restrict accessible endpoints
Configure vmauth routes to permit the ingestion or query APIs each client needs and block access to administrative endpoints.
Typical Use Cases for VictoriaStack
See how teams use VictoriaStack to investigate production incidents, extend existing monitoring, and control telemetry infrastructure as workloads grow.
AI Investigations
AI-Assisted Incident Investigations
Give AI agents access to metrics, logs, and traces through VictoriaStack’s APIs and MCP servers. Agent skills guide investigations across all three signals, from a change in metrics to related log events and traces of slow or failing requests.
Integration
Extending Existing Monitoring
Add logs or traces when metrics alone cannot explain an incident. Keep existing exporters, compatible dashboards, and OpenTelemetry instrumentation.
Kubernetes
Cloud-Native Observability
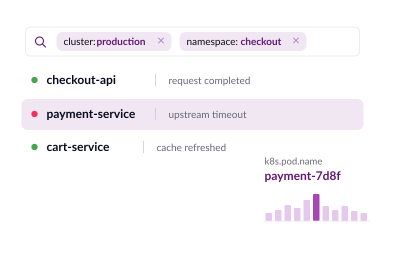
Investigate high-cardinality workloads across clusters and services, from pod resource usage and application errors to slow requests.
Cost Control
Replacing Costly Observability Backends
Migrate one backend at a time. Control infrastructure costs with per-database retention, compressed storage, and metrics aggregation before ingestion.
AI Observability
AI Observability
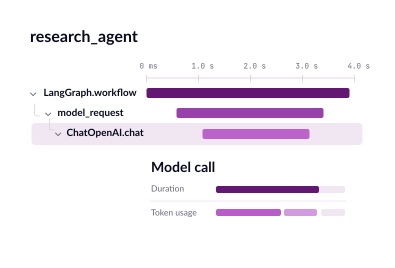
Monitor AI application latency, errors, and resource use through OpenTelemetry. Use related metrics, logs, and traces to investigate whether slow responses come from model calls, application services, or the underlying infrastructure.
Multitenancy
Multi-tenant Observability Platforms
Separate team or customer data in VictoriaMetrics clusters and VictoriaLogs or VictoriaTraces deployments. Use vmauth to route users to authorized tenants.
Our team of experts is here to provide enhanced technical support, architectural and security guidance, help with adoption, integration and performance analytics.




















 vmauth
 Grafana
 Perses
 Alertmanager
 Anthropic
 OpenAI

 OpenTelemetry
 Prometheus
 Grafana
 Fluent Bit
 Vector