
VictoriaMetrics:
High-Performance
Open-Source Time
Series Database &
Monitoring Solution
Simple, Reliable, Efficient Metrics at Any Scale
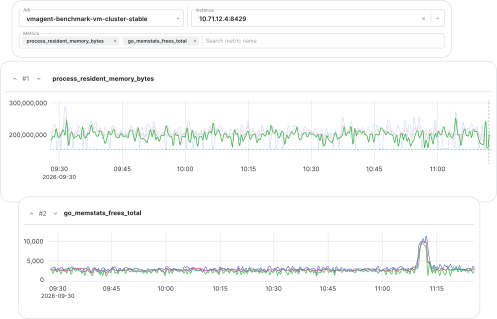
Start With One Binary. Scale to a Cluster
Fast, predictable, cost-efficient monitoring at any scale.
Start with a single binary, then grow into a cluster.
Query with MetricsQL or Prometheus- and Graphite-compatible APIs,
so your Grafana dashboards and alerts just work.
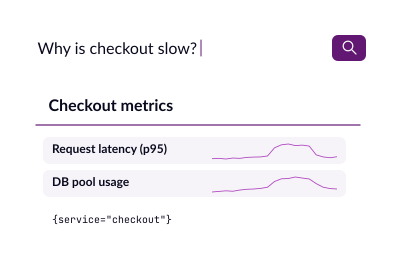
AI-ready: let any agent query your data and investigate issues for you.
16x
faster queries than similar solutions- Ideal for AI & agentic workflows
- Supports all popular data ingestion protocols
2.5x
more data in the same storage- Drop-in Prometheus replacement
- Simple to deploy and operate
80%
Up to 80% less memory usage- Optimized for high-cardinality, high-churn workloads
- Supports highly available and scalable monitoring
Easy to Integrate
VictoriaMetrics supports industry-standard protocols, including Prometheus remote write, Graphite, Influx line protocol, OpenTSDB, and OpenTelemetry, so you can connect existing agents, exporters, and collectors with minimal changes.
Prometheus
Grafana
OpenTelemetry
InfluxDB
Graphite
Datadog agent
Top Features
Observability Combine VictoriaMetrics with VictoriaLogs and VictoriaTraces for a full observability stack.Observability Simple to Operate
Deploy VictoriaMetrics as a single binary or with a Kubernetes operator and Helm charts for single-node and cluster deployments.Open standards Powerful Agentic Workflows
Build an observability backend for your agents. Let AI investigate issues through MCP servers and agent skills.Open standards Unparalleled Compatibility
Works with Prometheus, OpenTelemetry, InfluxDB, Graphite, Datadog, and more, so you can keep your existing agents and exporters.Scalability High Cardinality & Churn
Monitor hundreds of millions of unique time series and high label churn, such as Kubernetes, microservices, and multi-tenant SaaS.Scalability Light-Speed Queries
VictoriaMetrics processes billions of rows per second in parallel for low-latency queries on large volumes of data.Scalability Stream aggregation
Use powerful stream aggregation to consolidate your metrics pipelines.Analytics & Alerting Alerting
Seamlessly execute Prometheus and Graphite-compatible alerting and recording rules.Analytics & Alerting Cardinality estimation
Estimate time-series cardinality in near-real time. Get alerts and insights to manage spikes before impacting your deployments.Enterprise Downsampling
Automatically reduce the resolution of old data so you can keep years of history while reducing storage use.Enterprise Anomaly Detection
ML-based anomaly detection that profiles time series for seasonality and trends, recommends models, and generates alerting rules.Enterprise LTS Releases
Run a stable release line with 12 months of bug and security fixes, and upgrade on your schedule.Enterprise Enterprise Support
Get first-class consulting and technical support provided by the core development team.
Key Benefits
Key Benefits
Key Benefits
Key Benefits
Drop-in Prometheus replacement
Keep your scrape configs, exporters, Grafana dashboards, and alerting rules without rewrites.Native OpenTelemetry
Send OTLP metrics directly from the OpenTelemetry Collector or SDKs.Industry protocols
Ingest from InfluxDB, Graphite, OpenTSDB, StatsD, and Datadog or New Relic agents, so you can migrate without re-instrumenting.Works great with AI
Use MCP servers and agent skills to let AI agents query metrics, investigate incidents, and propose fixes through read-only APIs, while engineers stay in control.
Easy to deploy
Start with a single binary and no external dependencies.Simple operations
Ships with sane defaults, Grafana dashboards, and alerting rules out of the box, with no constant tuning required.Single-node or cluster
Scale a single node vertically to tens of millions of active time series, or go horizontal with the cluster version to billions.Kubernetes-ready
Deploy with Helm charts or the Kubernetes operator for single-node and cluster setups.
Performance at scale
Ingest millions of samples per second on a single node and hundreds of millions with the cluster version.Lower infrastructure costs
Use up to 2.5x less disk space and up to 80% less memory than Prometheus for the same workload.Long-term storage, your way (Enterprise)
Reduce costs on historical data with downsampling and different retention periods for different datasets.No lock-in
Open source under Apache 2.0 and built on standard protocols. Self-host anywhere or use VictoriaMetrics Cloud.
Faster incident response
Run Prometheus-compatible alerting and recording rules with vmalert, and catch problems before customers feel the impact.Use MetricsQL
Query with a PromQL-compatible language with extra functions, so dashboards and alert rules stay consistent.Test before you ship
Unit-test alerting and recording rules against real time series before they reach production.Combine metrics with vmanomaly (Enterprise)
Use ML-based anomaly detection to spot unusual behavior automatically, and drill into the exact services and time series involved.
Typical Use Cases for VictoriaMetrics
See how teams use VictoriaMetrics to store and query metrics at scale, power AI-driven troubleshooting, and keep monitoring costs under control as they grow.
- Storage
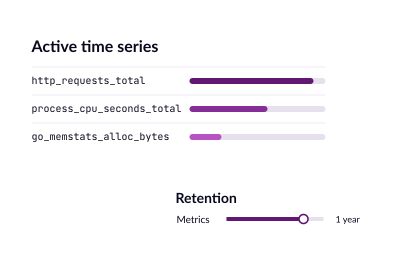
Cost-effective long-term storage.
Keep months or years of history with efficient compression and a low resource footprint.
- Centralization
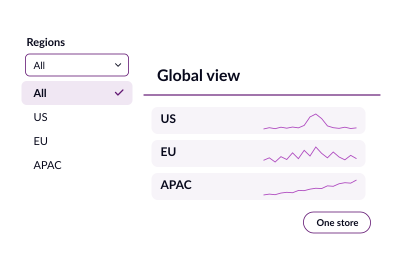
Centralized metrics storage.
Bring metrics from multiple clusters, regions, and teams into one store with a global query view.
- Migration
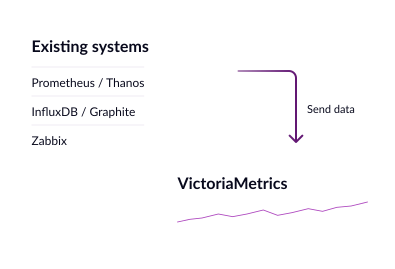
Replacing legacy monitoring systems.
Move off Prometheus, InfluxDB, Graphite, Zabbix, Thanos, and more without re-instrumenting your apps.
- Performance
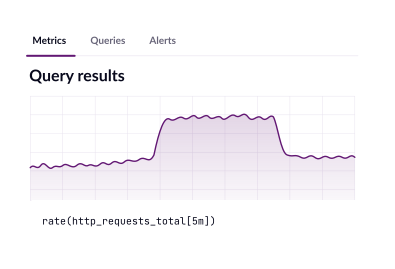
High-volume, low-latency querying.
Ingest millions of samples per second and keep dashboards and alerts responsive as your data grows.
- AI Operations
AI-driven incident investigation.
A backend that stays fast and affordable under heavy, repeated AI agent query load.
- Multi-tenancy
Multi-tenant monitoring.
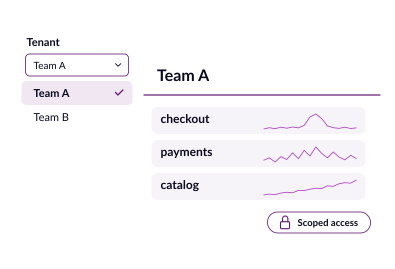
Give teams or customers isolated tenants with per-tenant access control from a single cluster.