- Blog /
- How vmstorage Handles Query Requests From vmselect
How vmstorage Handles Query Requests From vmselect
Share:


This piece is part of our ongoing VictoriaMetrics series, where we break down how different components of the system function:
- How VictoriaMetrics Agent (vmagent) Works
- How vmstorage Handles Data Ingestion
- How vmstorage Processes Data: Retention, Merging, Deduplication,…
- When Metrics Meet vminsert: A Data-Delivery Story
- How vmstorage’s IndexDB Works
- How vmstorage Handles Query Requests From vmselect (We’re here)
- Inside vmselect: The Query Processing Engine of VictoriaMetrics
Important
This discussion assumes you’ve checked out the earlier articles, which cover how vmstorage’s IndexDB works.
Receiving Requests From vmselect
#
By default, vmstorage listens for connections from vmselect on a dedicated TCP port, 8401 (configured with -vmselectAddr).
Whenever vmselect connects, the two start a handshake process to negotiate details like the compression algorithm. Unless you’ve explicitly disabled it (-rpc.disableCompression=false), vmstorage will compress the data it sends back to vmselect to save bandwidth.
Requests coming from vmselect follow this general structure:
<rpcName> <traceEnable?> <timeout> <request>
Now, vmselect doesn’t just send query requests—it asks vmstorage a variety of things, each tied to a specific rpcName. Here are a few examples:
search_v7– This is the one we’re focusing on today. It handles the main search query for time series data.deleteSeries_v5– Used to delete time series data that matches specific criteria. This removes data points from storage.seriesCount_v4– Returns a single number representing the total number of series in storage.searchMetricNames_v3– Searches for metric names based on specific criteria.
Let’s stick to the star of the show: the search_v7 request format:
["search_v7"][traceEnable?][timeout][search-request]
One cool thing about this is the tracing feature (-traceEnable), which happens to be one of my favorites. Tracing lets you locate bottlenecks during query processing — think of it as the equivalent of EXPLAIN ANALYZE in PostgreSQL. It shows you the exact steps a query goes through and how much time each one takes.
If you’re curious, there’s an excellent article that dives into this feature: How to reduce expenses on monitoring - Roman Khavronenko.
There’s also a timeout on requests from vmselect, which is set to 30 seconds by default. We’ll talk more about this timeout in the vminsert article, so let’s leave it for now.
Tip: Useful metrics
- Current active connections from vmselect:
vm_vmselect_conns - How many connection errors with vmselect nodes:
vm_vmselect_conn_errors_total - How many requests are search queries:
vm_vmselect_rpc_requests_total{action="search"}
Just like it does with vminsert, vmstorage applies a concurrency limit to RPC requests from vmselect. This is controlled by -search.maxConcurrentRequests, which, by default, allows up to 2x your CPU cores worth of concurrent RPC requests. If the number of requests exceeds that, they’ll wait in a queue for up to 10 seconds (-search.maxQueueDuration) before being rejected.
If you’re dealing with a slow network or running into network bottlenecks, increasing these limits might help as it brings the workload to the CPU. Otherwise, it’s better to leave them as they are.
Find Metric IDs (and TSIDs) of Timeseries
#
Let’s say you want to search for metrics in the timeseries http_request_total{status!="500"} across two days: 2024-01-01 and 2024-01-02.
IndexDB takes the filter tags from vmselect, __name__=http_request_total and status=500. The main goal at this stage is to find the metric IDs for all timeseries that match the filter tags. These could be:
41: http_request_total{url="/metrics",status="500",method="GET"}124: http_request_total{url="/insert",status="500",method="POST"}495: http_request_total{url="/query",status="500",method="GET"}- …
To speed things up, IndexDB has an in-memory cache that stores the metric IDs for tag filters. For example, it might check if the key 2024-01-01 2024-01-02 http_request_total status=500 is already in the cache. This tag-filter cache uses 3% of vmstorage’s total memory (-storage.cacheSizeIndexDBTagFilters).
If there’s a cache miss, vmstorage searches the current IndexDB. It chooses between two indexes:
- The per-day index
tag to metric IDs: if your query covers a range of 40 days or less. - The global index
tag to metric IDs: for longer ranges.
Let’s focus on the per-day index since it also explains how the global index works.
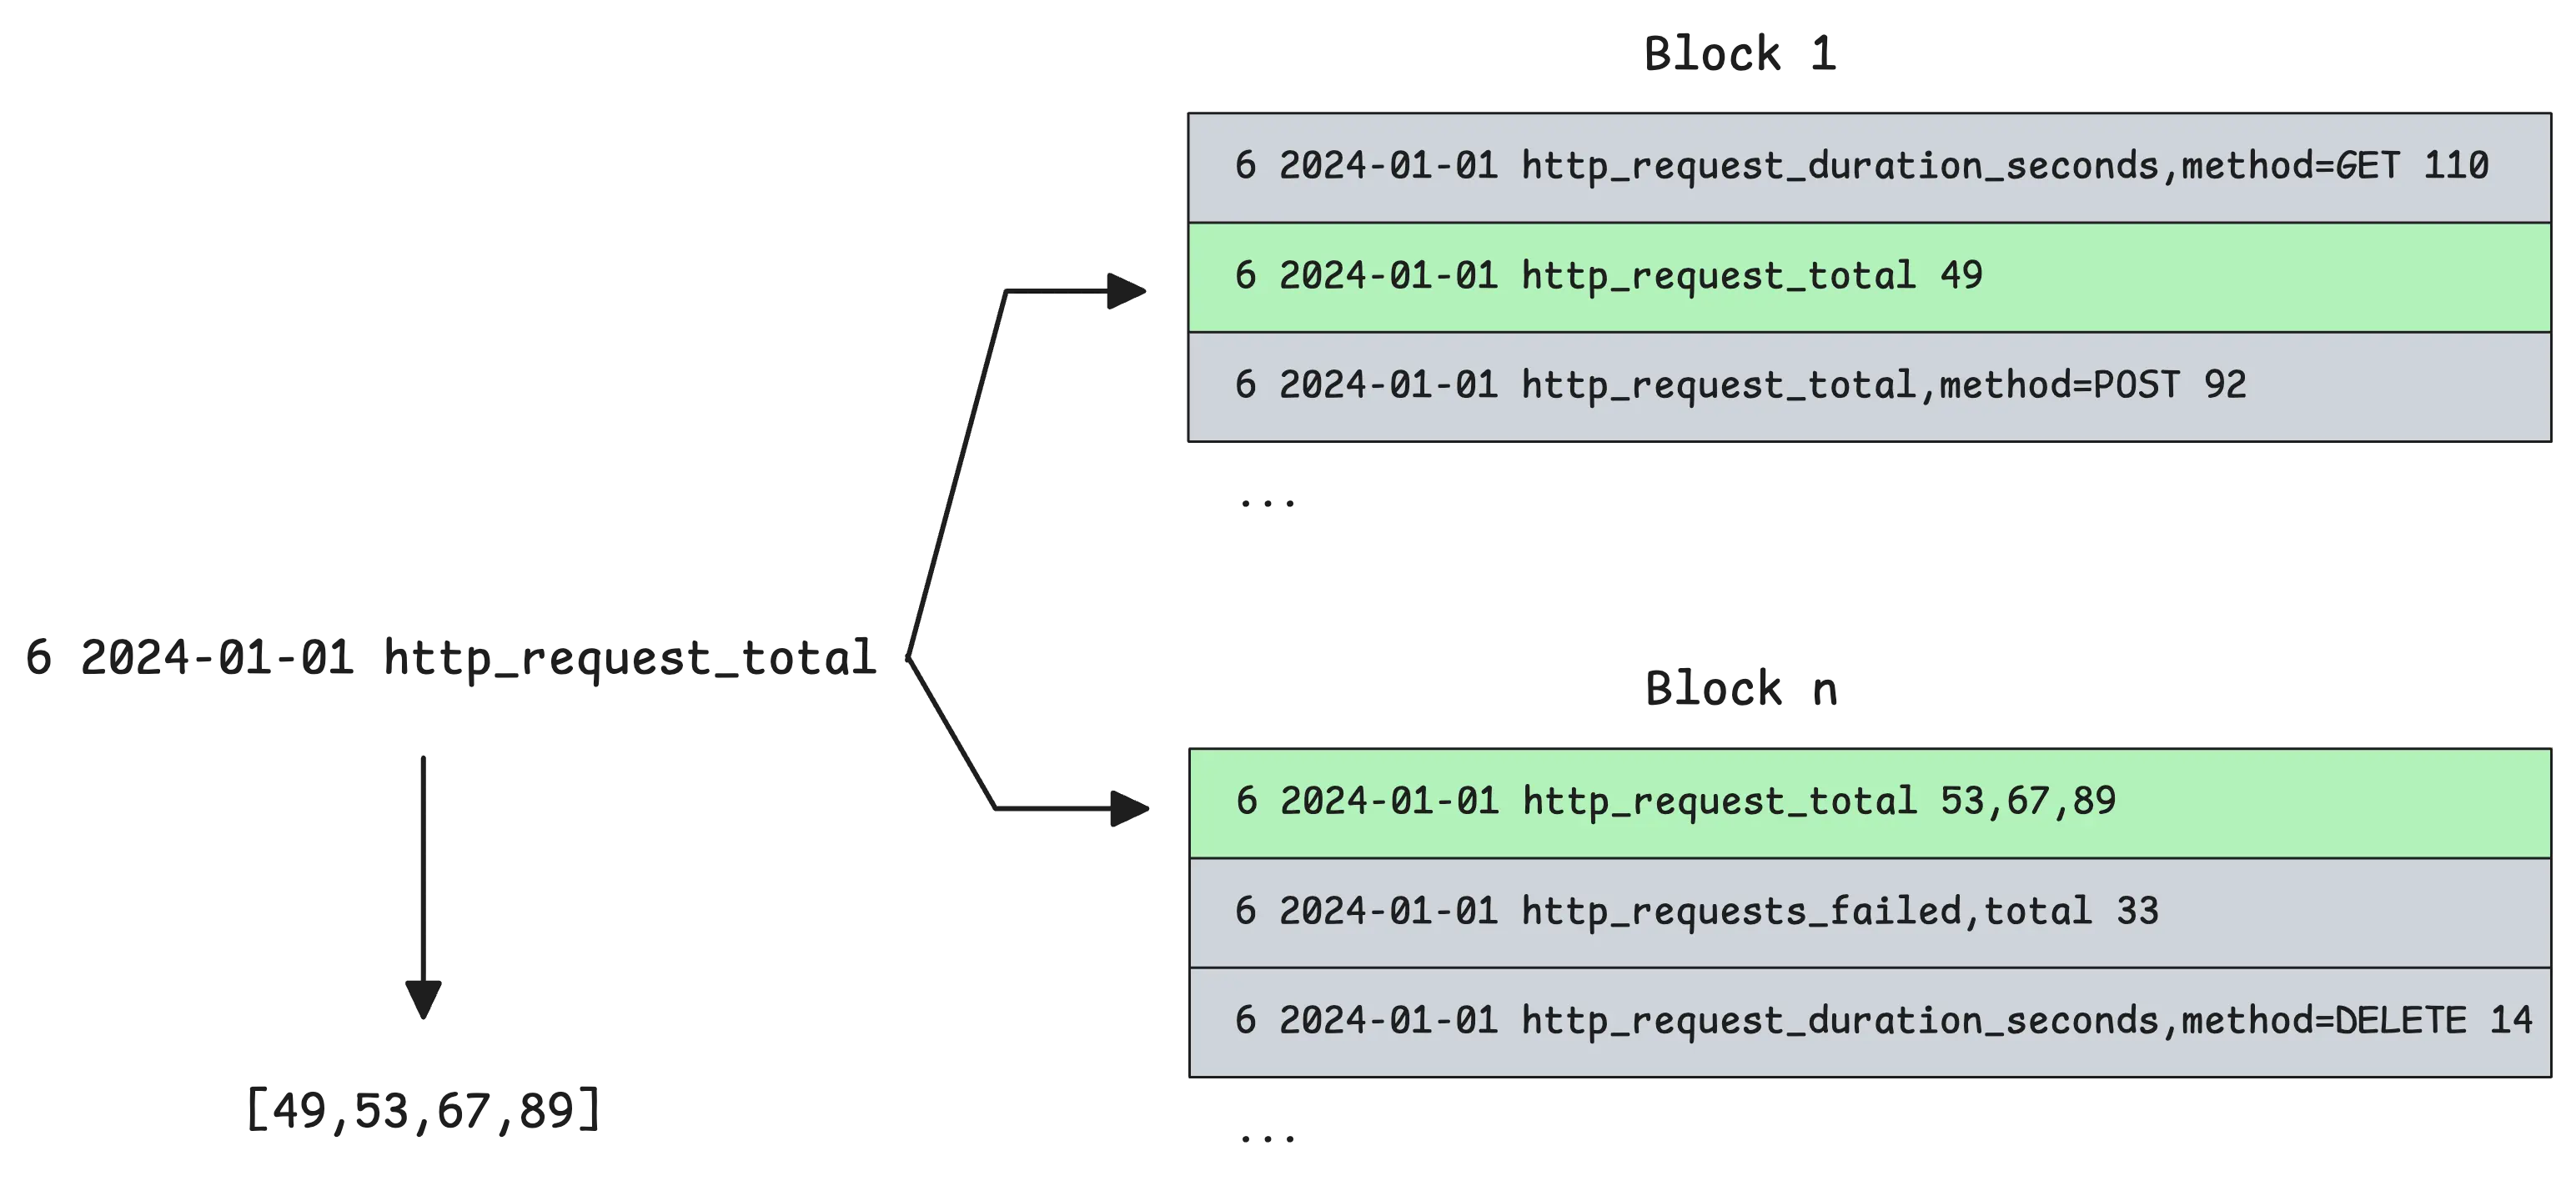
For the example query, vmstorage identifies the days it needs to search: 2024-01-01 and 2024-01-02. It then searches those days in parallel using the prefixes 6 2024-01-01 http_request_total and 6 2024-01-02 status=500 (or composite index 6 2024-01-01 http_request_total,status=500, but let’s keep it simple).
At this point, it scans the in-memory part, small parts, big parts in IndexDB to find the metric IDs for the relevant tags.
Fortunately, vmstorage doesn’t search every part. It can skip parts that aren’t relevant just by looking at the last item in each part:
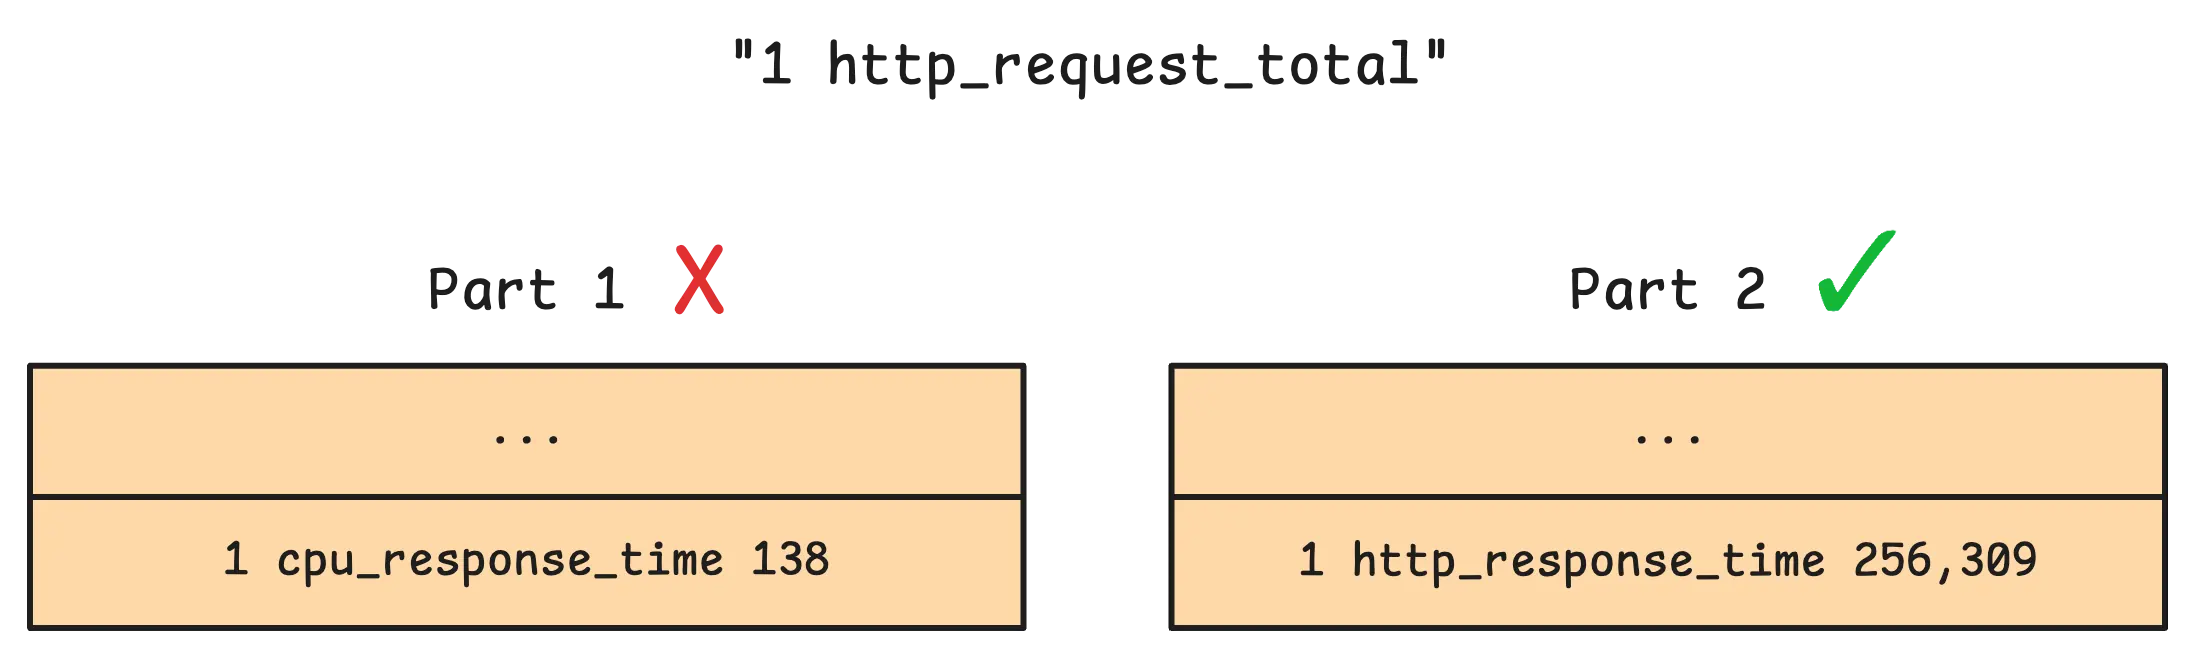
This works because each part is sorted alphabetically. By comparing the query’s boundaries to the last item in a part, vmstorage can quickly decide whether that part needs to be searched or can be safely ignored.
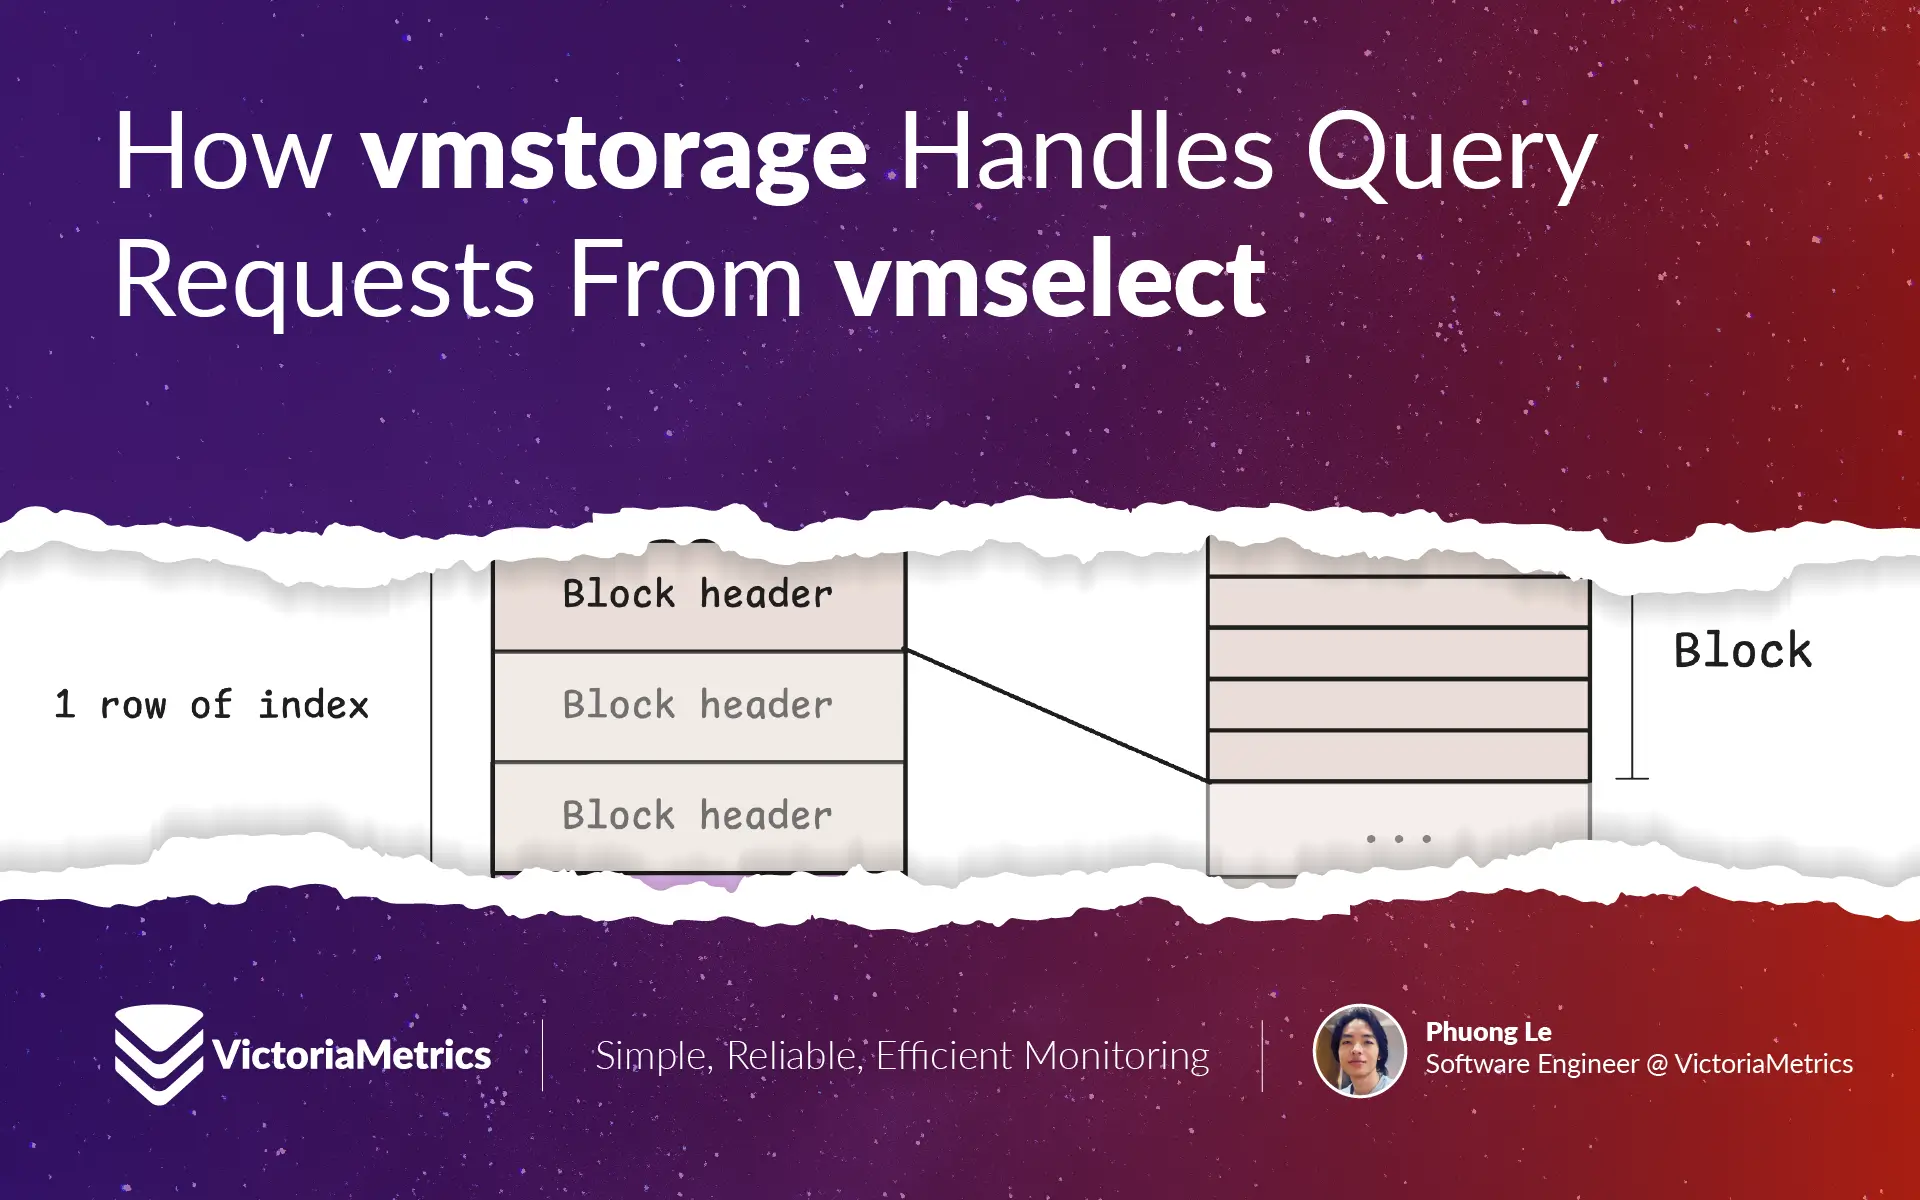
Now, vmstorage uses the pre-loaded metaindex.bin file to figure out the first block it needs to read, then starts loading rows from index.bin into memory, one by one.
If you remember, each row in index.bin is an array of block headers. To make things faster, vmstorage keeps a small cache for these index rows, so it doesn’t have to constantly read them from disk. By default, this cache takes up 10% of vmstorage’s total memory (-storage.cacheSizeIndexDBIndexBlocks).

Once vmstorage has the block headers, it knows how to load the actual blocks from items.bin and lens.bin. To avoid loading from disk, there’s also a small cache here for frequently accessed blocks, which uses 25% of the total memory by default (-storage.cacheSizeIndexDBDataBlocks).
After loading the target block into memory, it’s all about comparisons.
For instance, vmstorage only need to compare the prefix 6 2024-01-01 http_request_total against every row of the block (rows in the block are sorted by prefix so we can stop once we find a row that doesn’t match).
Once all the metric IDs for each tag are found, things get a bit easier. The next step is to intersect those IDs to find which ones match all the tags in the query:
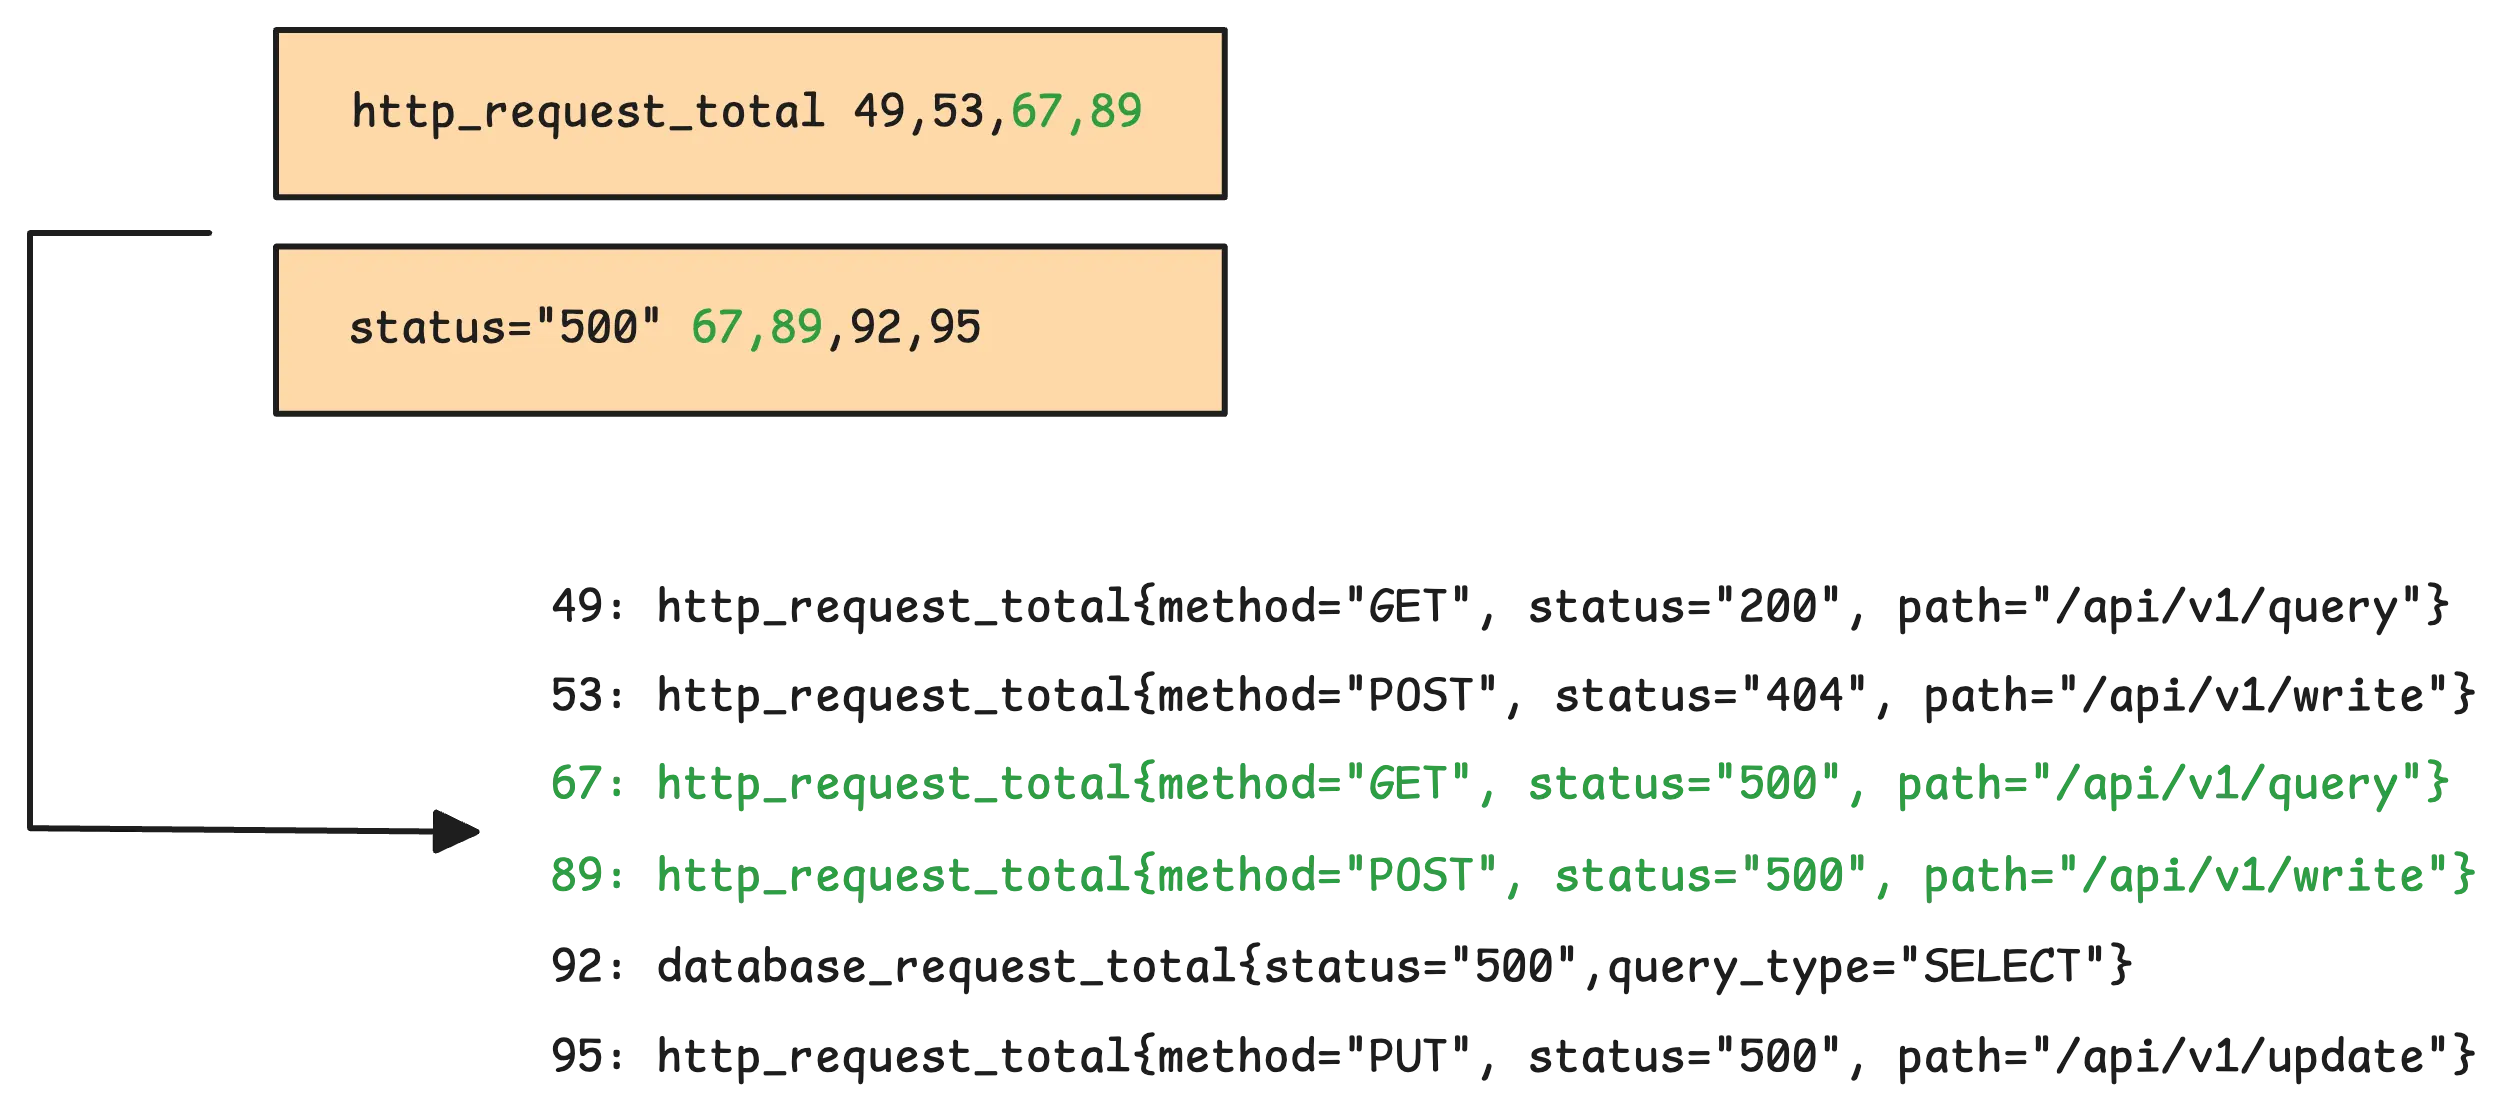
But what happens if the tag is status!=500 instead of status=500?
In that case, instead of intersecting, vmstorage subtracts the set of metric IDs for status=500 from the set of metric IDs for http_request_total.
After identifying the metric IDs that meet all the criteria, IndexDB uses these IDs to look up the corresponding TSIDs in the metric ID to TSID global index. This mapping also has a cache, which takes up 6.25% of vmstorage’s total memory (not configurable) and is persistent on disk (/<-storageDataPath>/cache/metricID_tsid).
Find Values & Timestamps of Timeseries
#
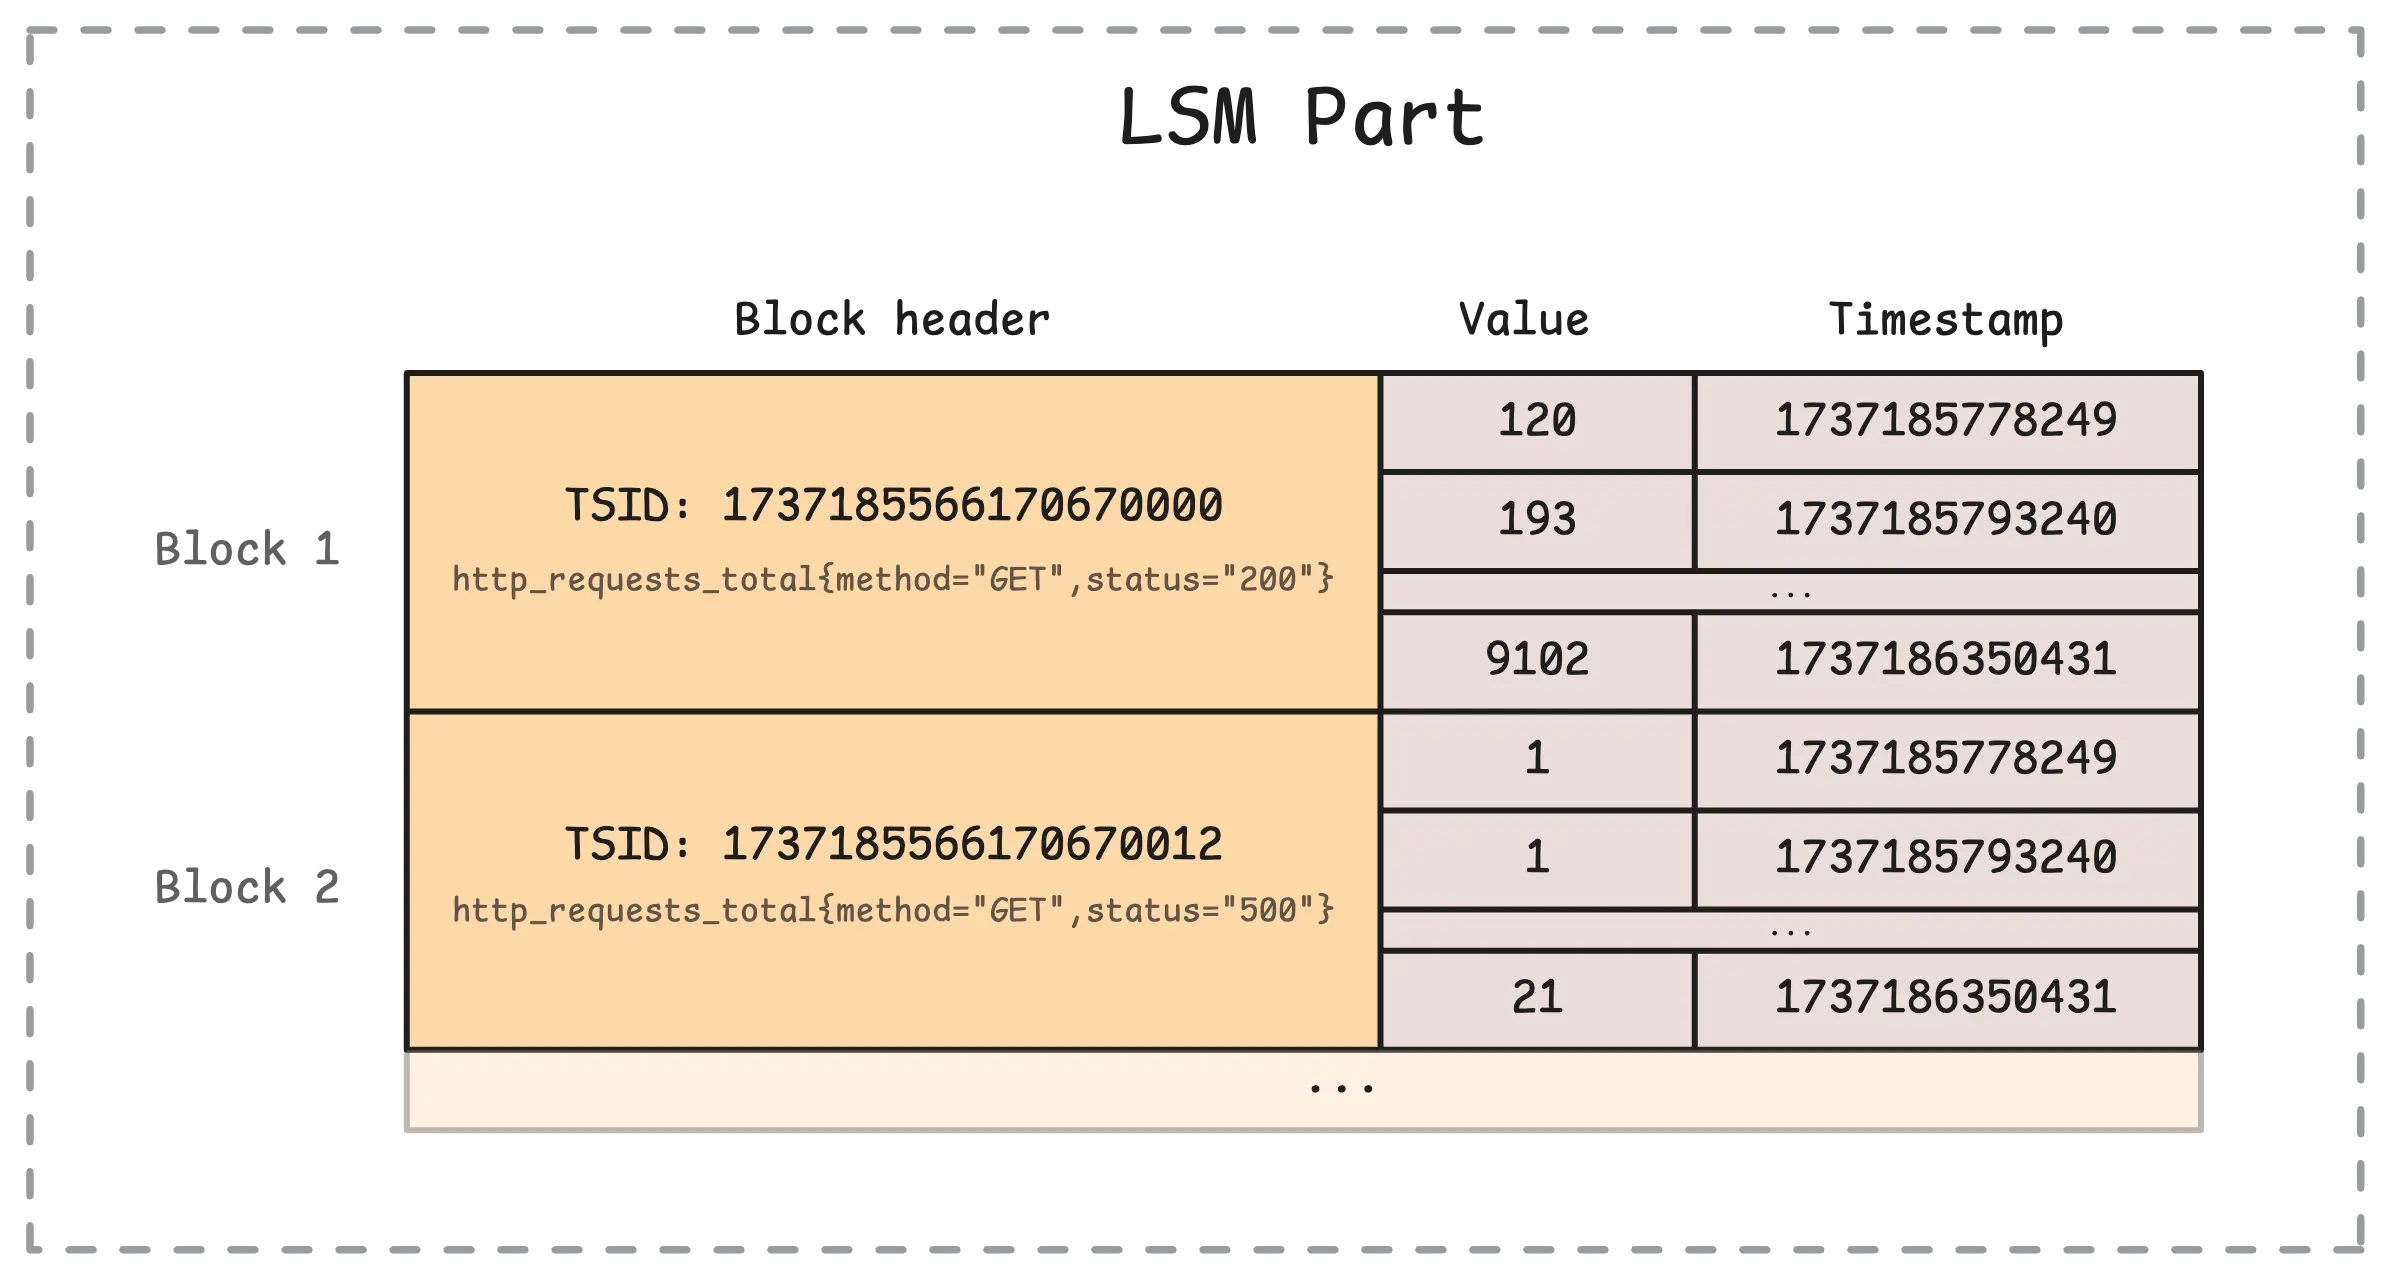
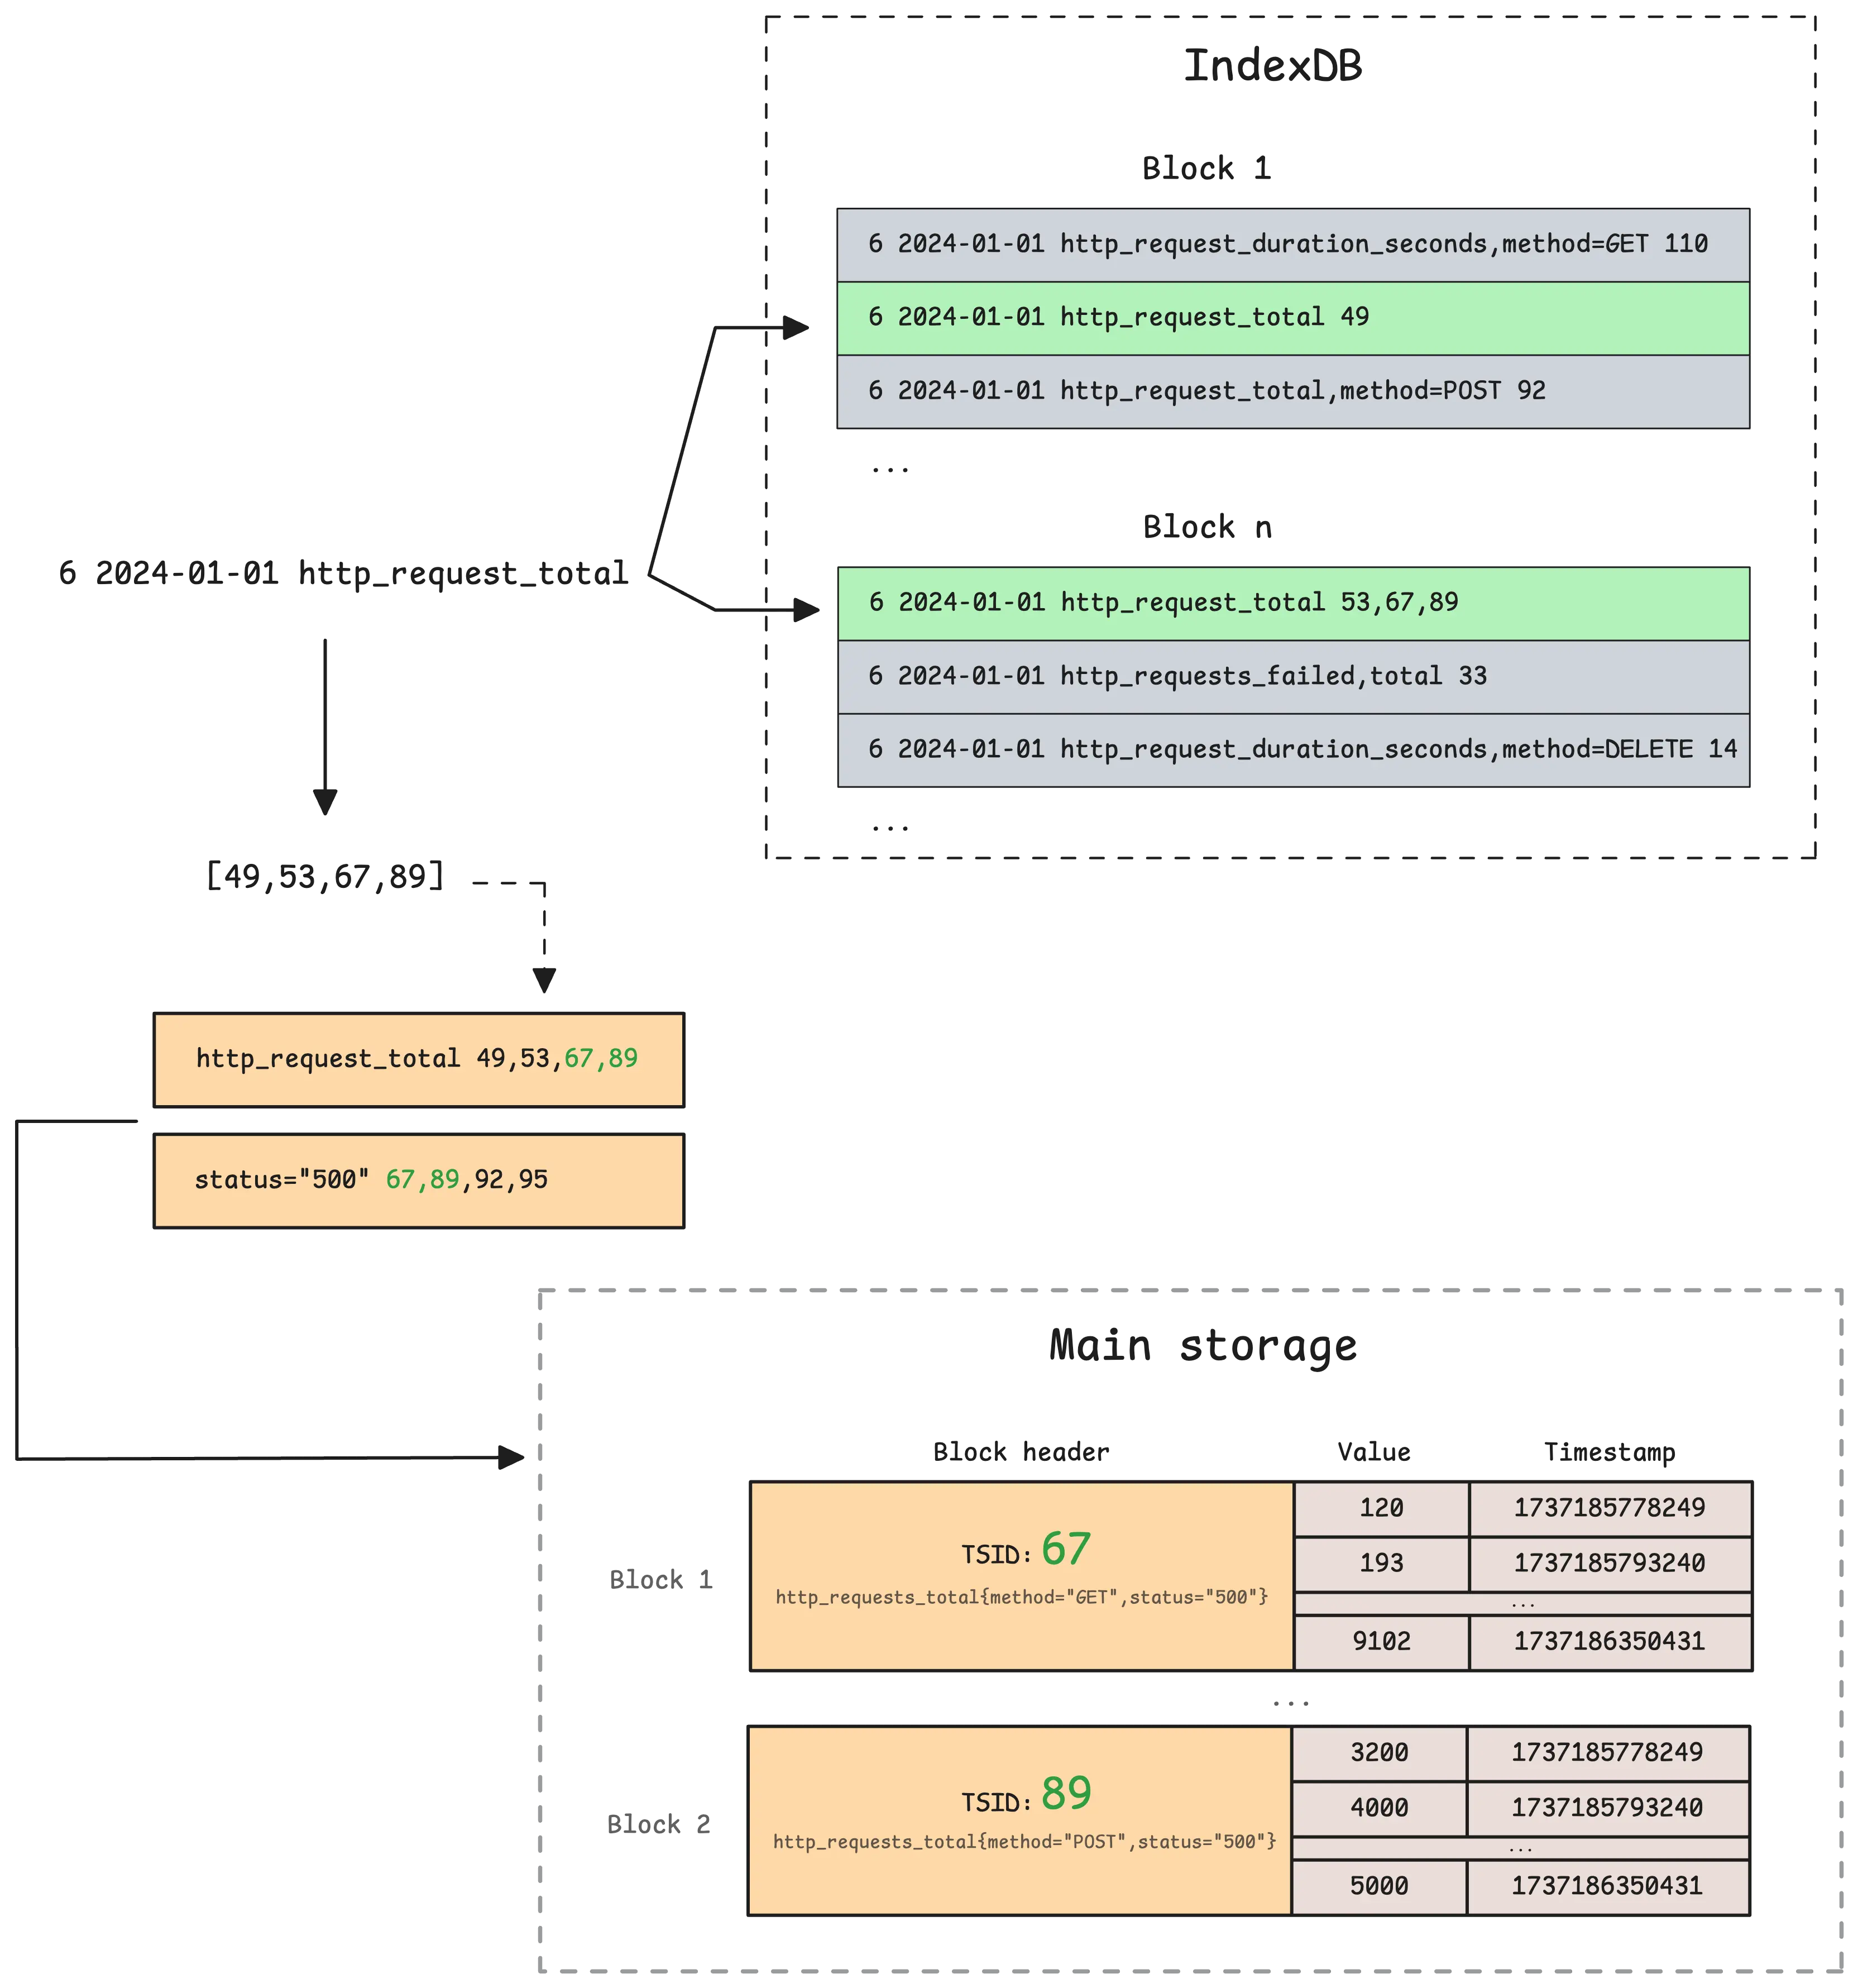
All timeseries data stored in a block shares the same TSID, which is the unique identifier found in the block header. The goal at this stage is to locate all relevant blocks and send them over to vmselect.
The process of locating blocks in the main storage is similar to how it’s done in IndexDB, so we can skip rehashing those steps here.
Once a block with a matching metric ID is found, vmstorage needs to retrieve the corresponding metric name. This is done by querying IndexDB’s metric ID to metric name global index. The process starts by checking a cache to avoid unnecessary lookups. This cache is persistent on disk (/<-storageDataPath>/cache/metricID_metricName) and uses 10% of total memory. If the metric name isn’t in the cache, vmstorage searches the current IndexDB and, if needed, checks previous IndexDBs as well.
Finally, vmstorage sends the blocks, along with the metric names, to vmselect for further processing.
Tip: Useful metrics
- How many blocks were found and sent to vmselect:
vm_vmselect_metric_blocks_read_total - How many rows from those blocks were sent:
vm_vmselect_metric_rows_read_total
Now that all the concepts are clear, the summary of this article is quite straightforward:
And… congratulations on making it this far. While waiting for the next article in this series, you can read more on Monitoring with VictoriaMetrics.
Who We Are
#
Need to monitor your services to see how everything performs and to troubleshoot issues? VictoriaMetrics is a fast, open-source, and cost-efficient way to stay on top of your infrastructure’s performance.
If you come across anything outdated or have questions, feel free to send me a DM on X (@func25).
Leave a comment below or Contact Us if you have any questions!
comments powered by Disqus