- Blog /
- How vmstorage Handles Data Ingestion From vminsert
How vmstorage Handles Data Ingestion From vminsert
Share:


This piece is part of our ongoing VictoriaMetrics series, where we break down how different components of the system function:
- How VictoriaMetrics Agent (vmagent) Works
- How vmstorage Handles Data Ingestion (We’re here)
- How vmstorage Processes Data: Retention, Merging, Deduplication,…
- When Metrics Meet vminsert: A Data-Delivery Story
- How vmstorage’s IndexDB Works
- How vmstorage Handles Query Requests From vmselect
- Inside vmselect: The Query Processing Engine of VictoriaMetrics
vmstorage is the component in VictoriaMetrics that handles the long-term storage of monitoring data. It receives data from vminsert, organizes the data into efficient storage structures, and manages how long the data is retained.
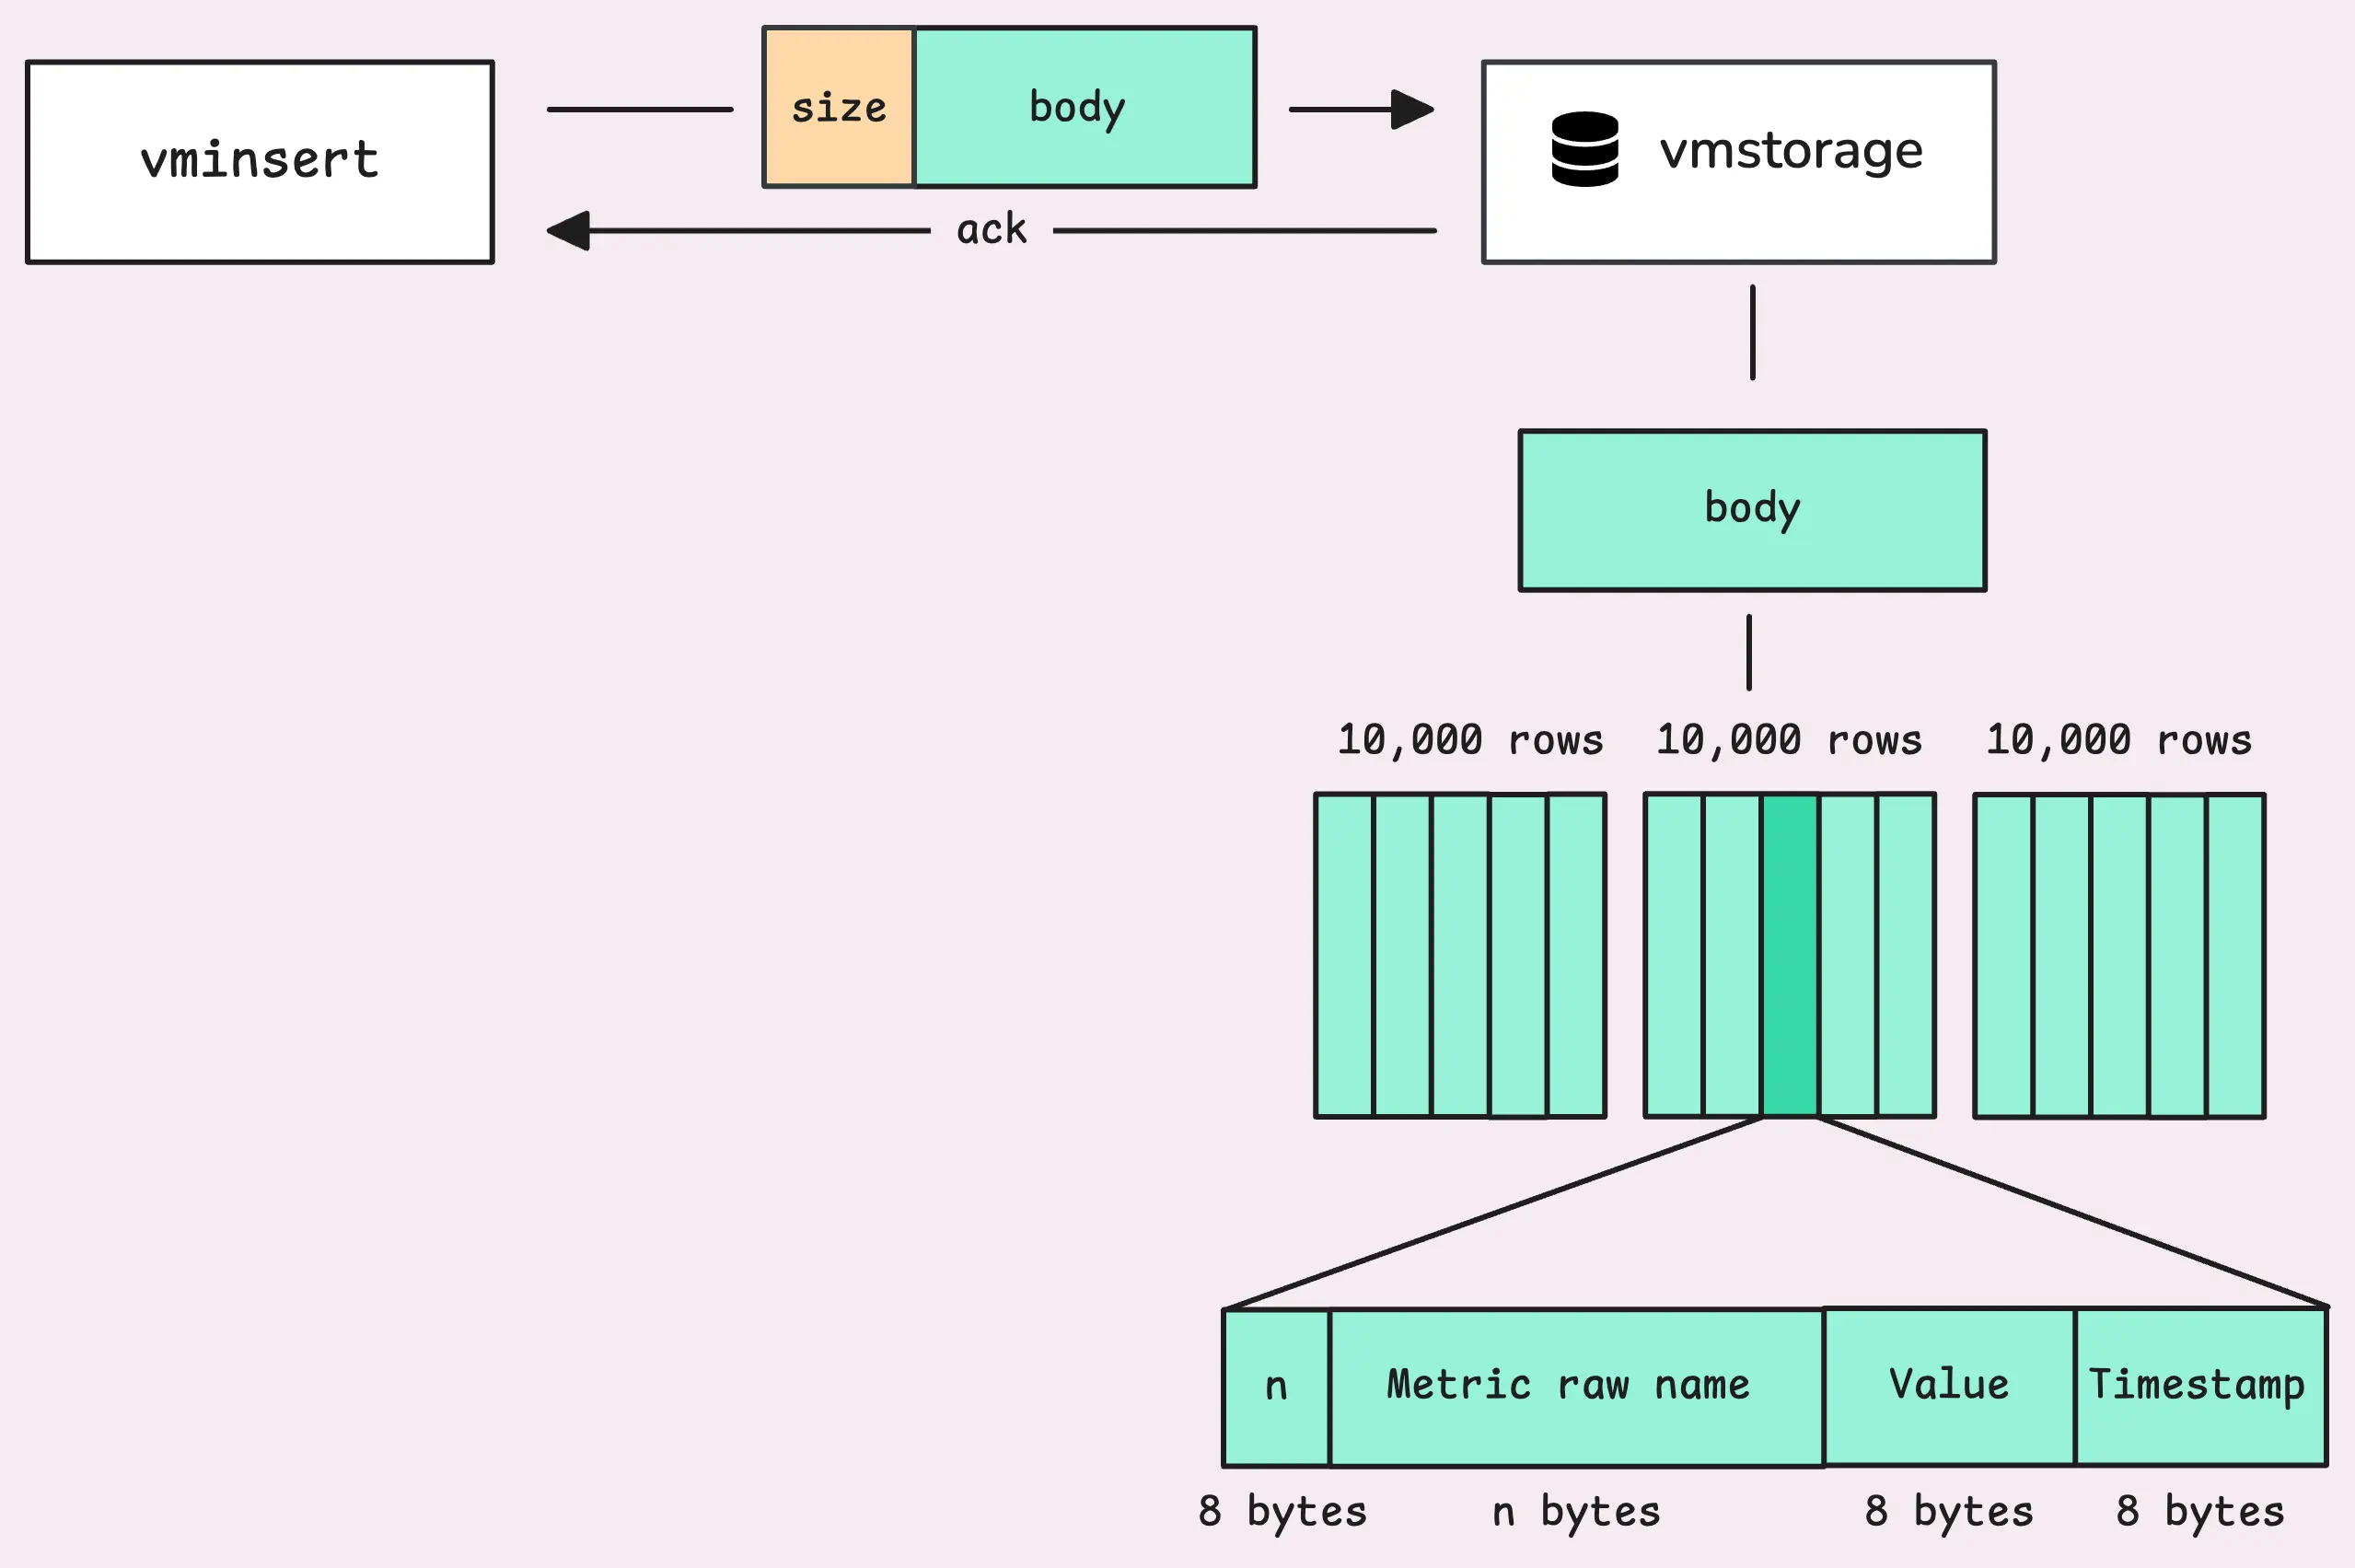
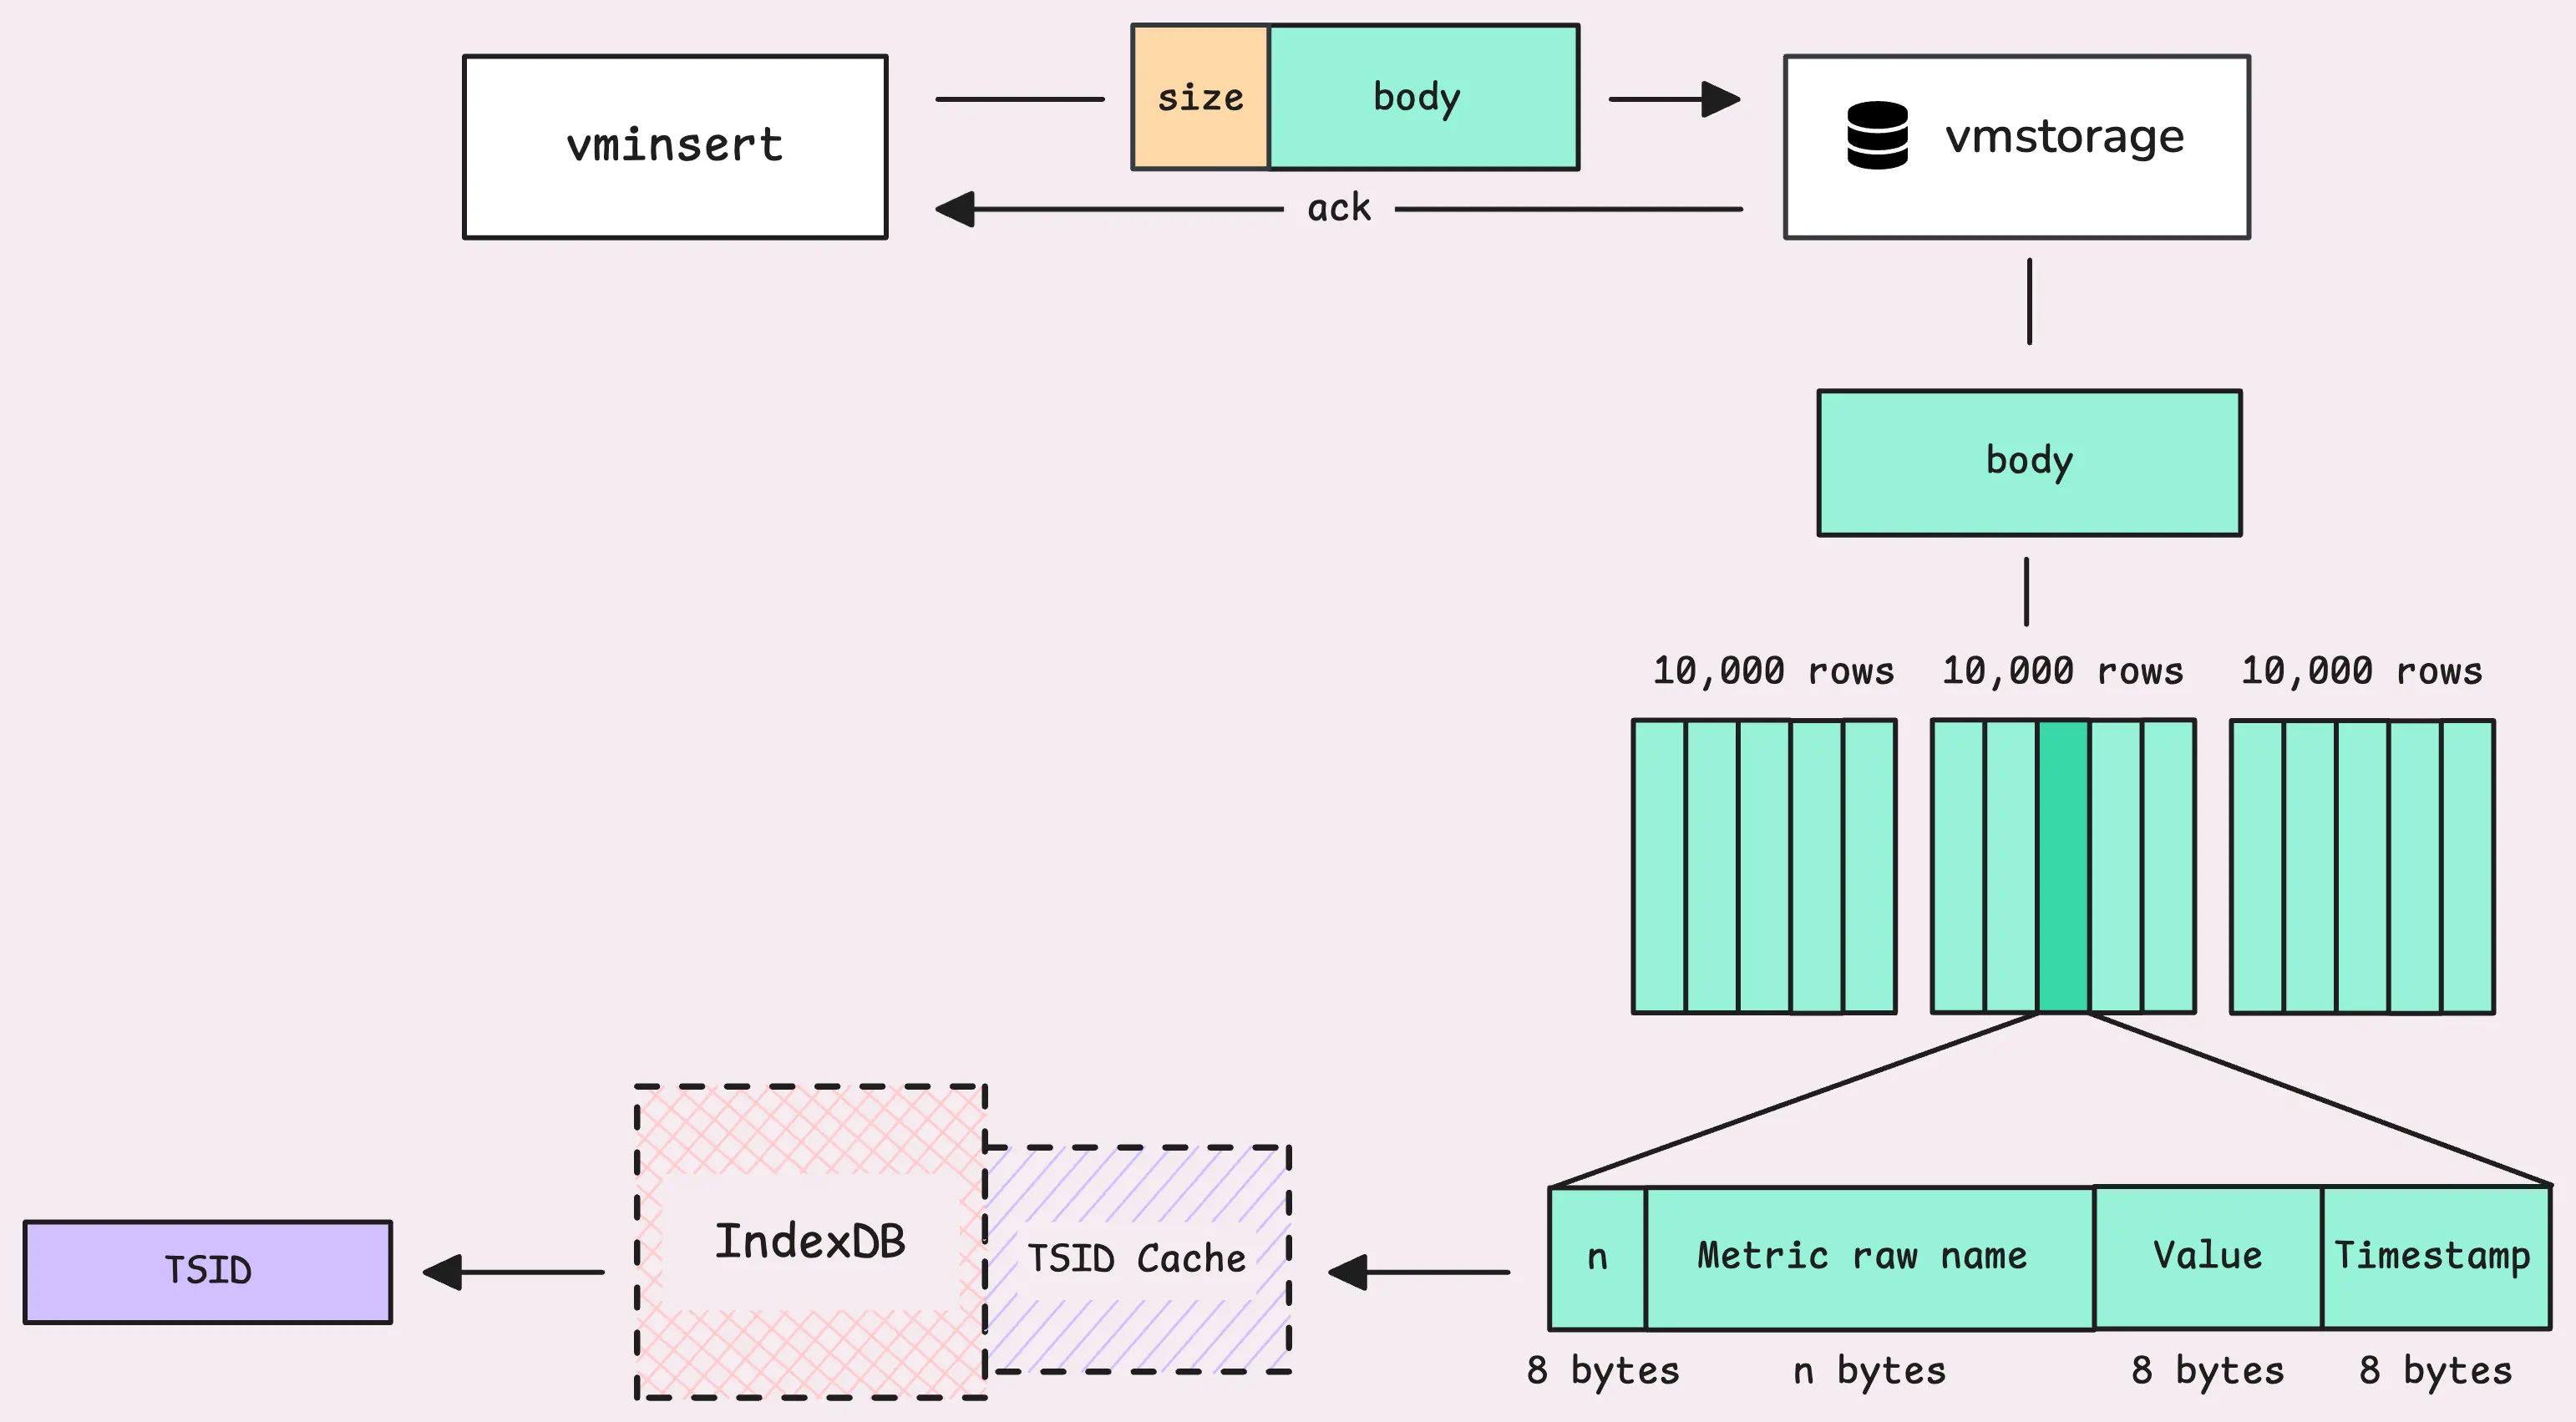
Before vminsert even sees the data, agents are out there collecting it. These agents gather metrics from various sources and then send them over to vminsert in batches. When vminsert receives the data, it compresses it into smaller packets, making it ready to send to vmstorage:
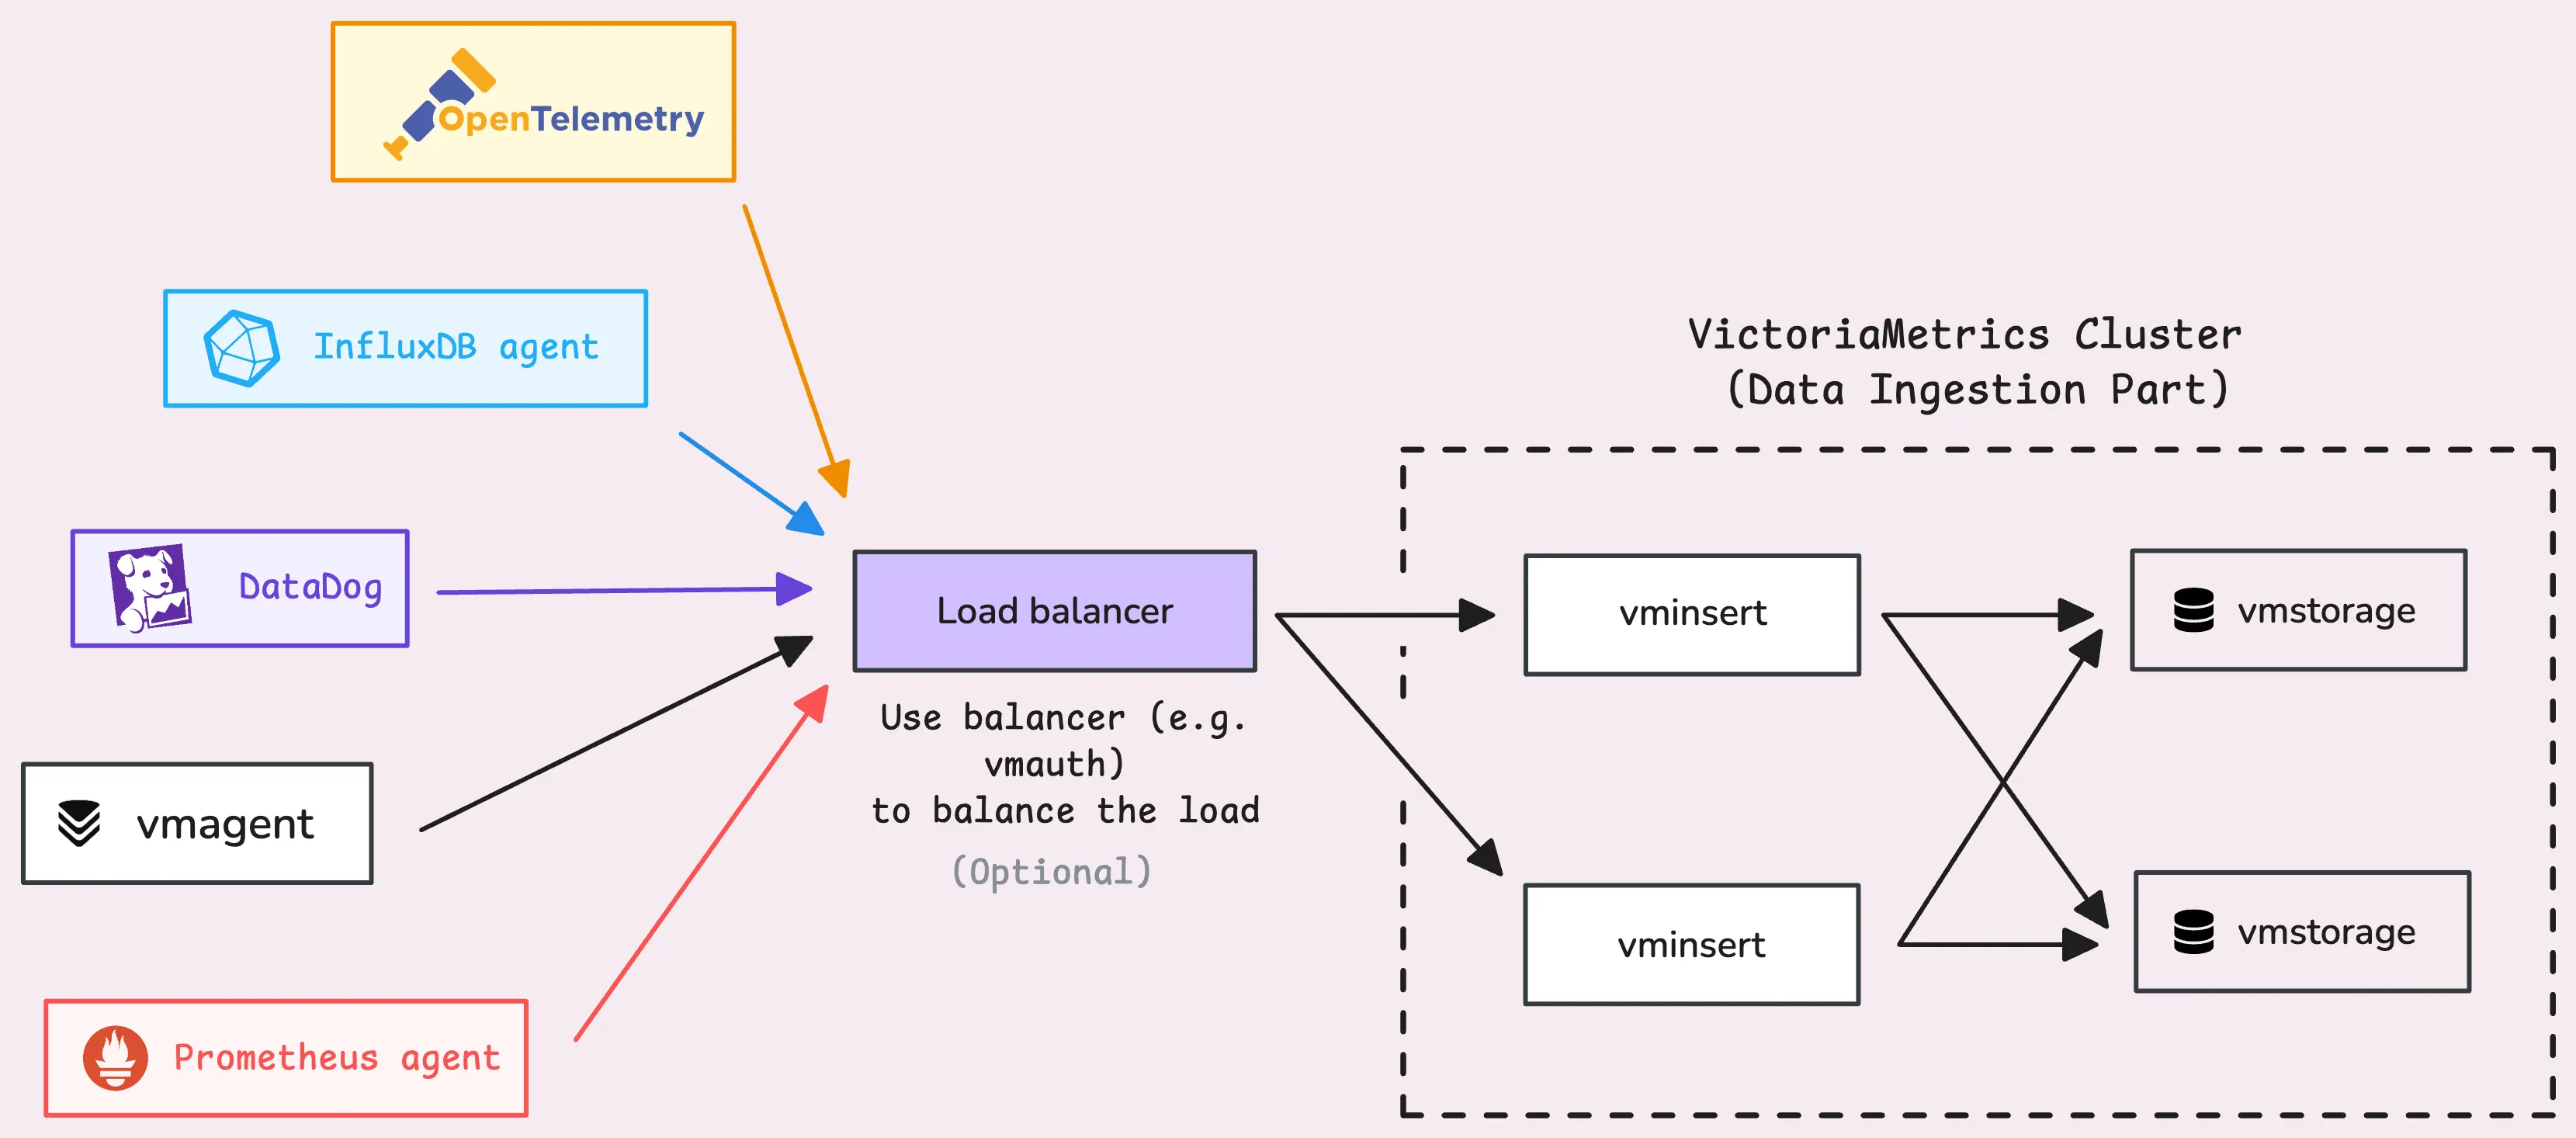
vmstorage stores data on both disk and memory in an optimized way, allowing very fast querying later on.
It starts by opening a TCP listener on port 8400 (-vminsertAddr). This listener is designed to accept connections only from vminsert. And today, we will discuss how vmstorage handles data ingestion from vminsert.
Note: a few things to keep in mind
- Flags we mention will begin with a dash (
-), e.g.-remoteWrite.url. - Numbers we reference are the default values (these work well for most setups), but you can modify them using flags.
- If you’re using a Helm chart, some defaults might differ due to the chart’s configuration tweaks.
- Internal things are not intended to be relied on; they could be changed at any time.
If you have a topic in mind that you’d like us to cover, you can drop a DM to X (@func25) or connect with us on VictoriaMetrics’ Slack. We’re always looking for ideas and will focus on the most-requested ones. Thanks for sharing your suggestions!
Reading And Parsing Data
#
When vmstorage receives data, it doesn’t read it immediately but first checks with the concurrency read limiter.
This limiter only allows 2x the number of CPU cores (-maxConcurrentInserts) to read data simultaneously. For example, if your setup has 2 cores, you’ll get up to 4 readers working at the same time. If more readers attempt to access the data, they’ll have to wait in line — but not indefinitely. Any request stuck in the queue for over a minute (-insert.maxQueueDuration) is rejected to maintain system efficiency under heavy load.
Now, vmstorage reads one block at a time from the stream. But what does a block look like?
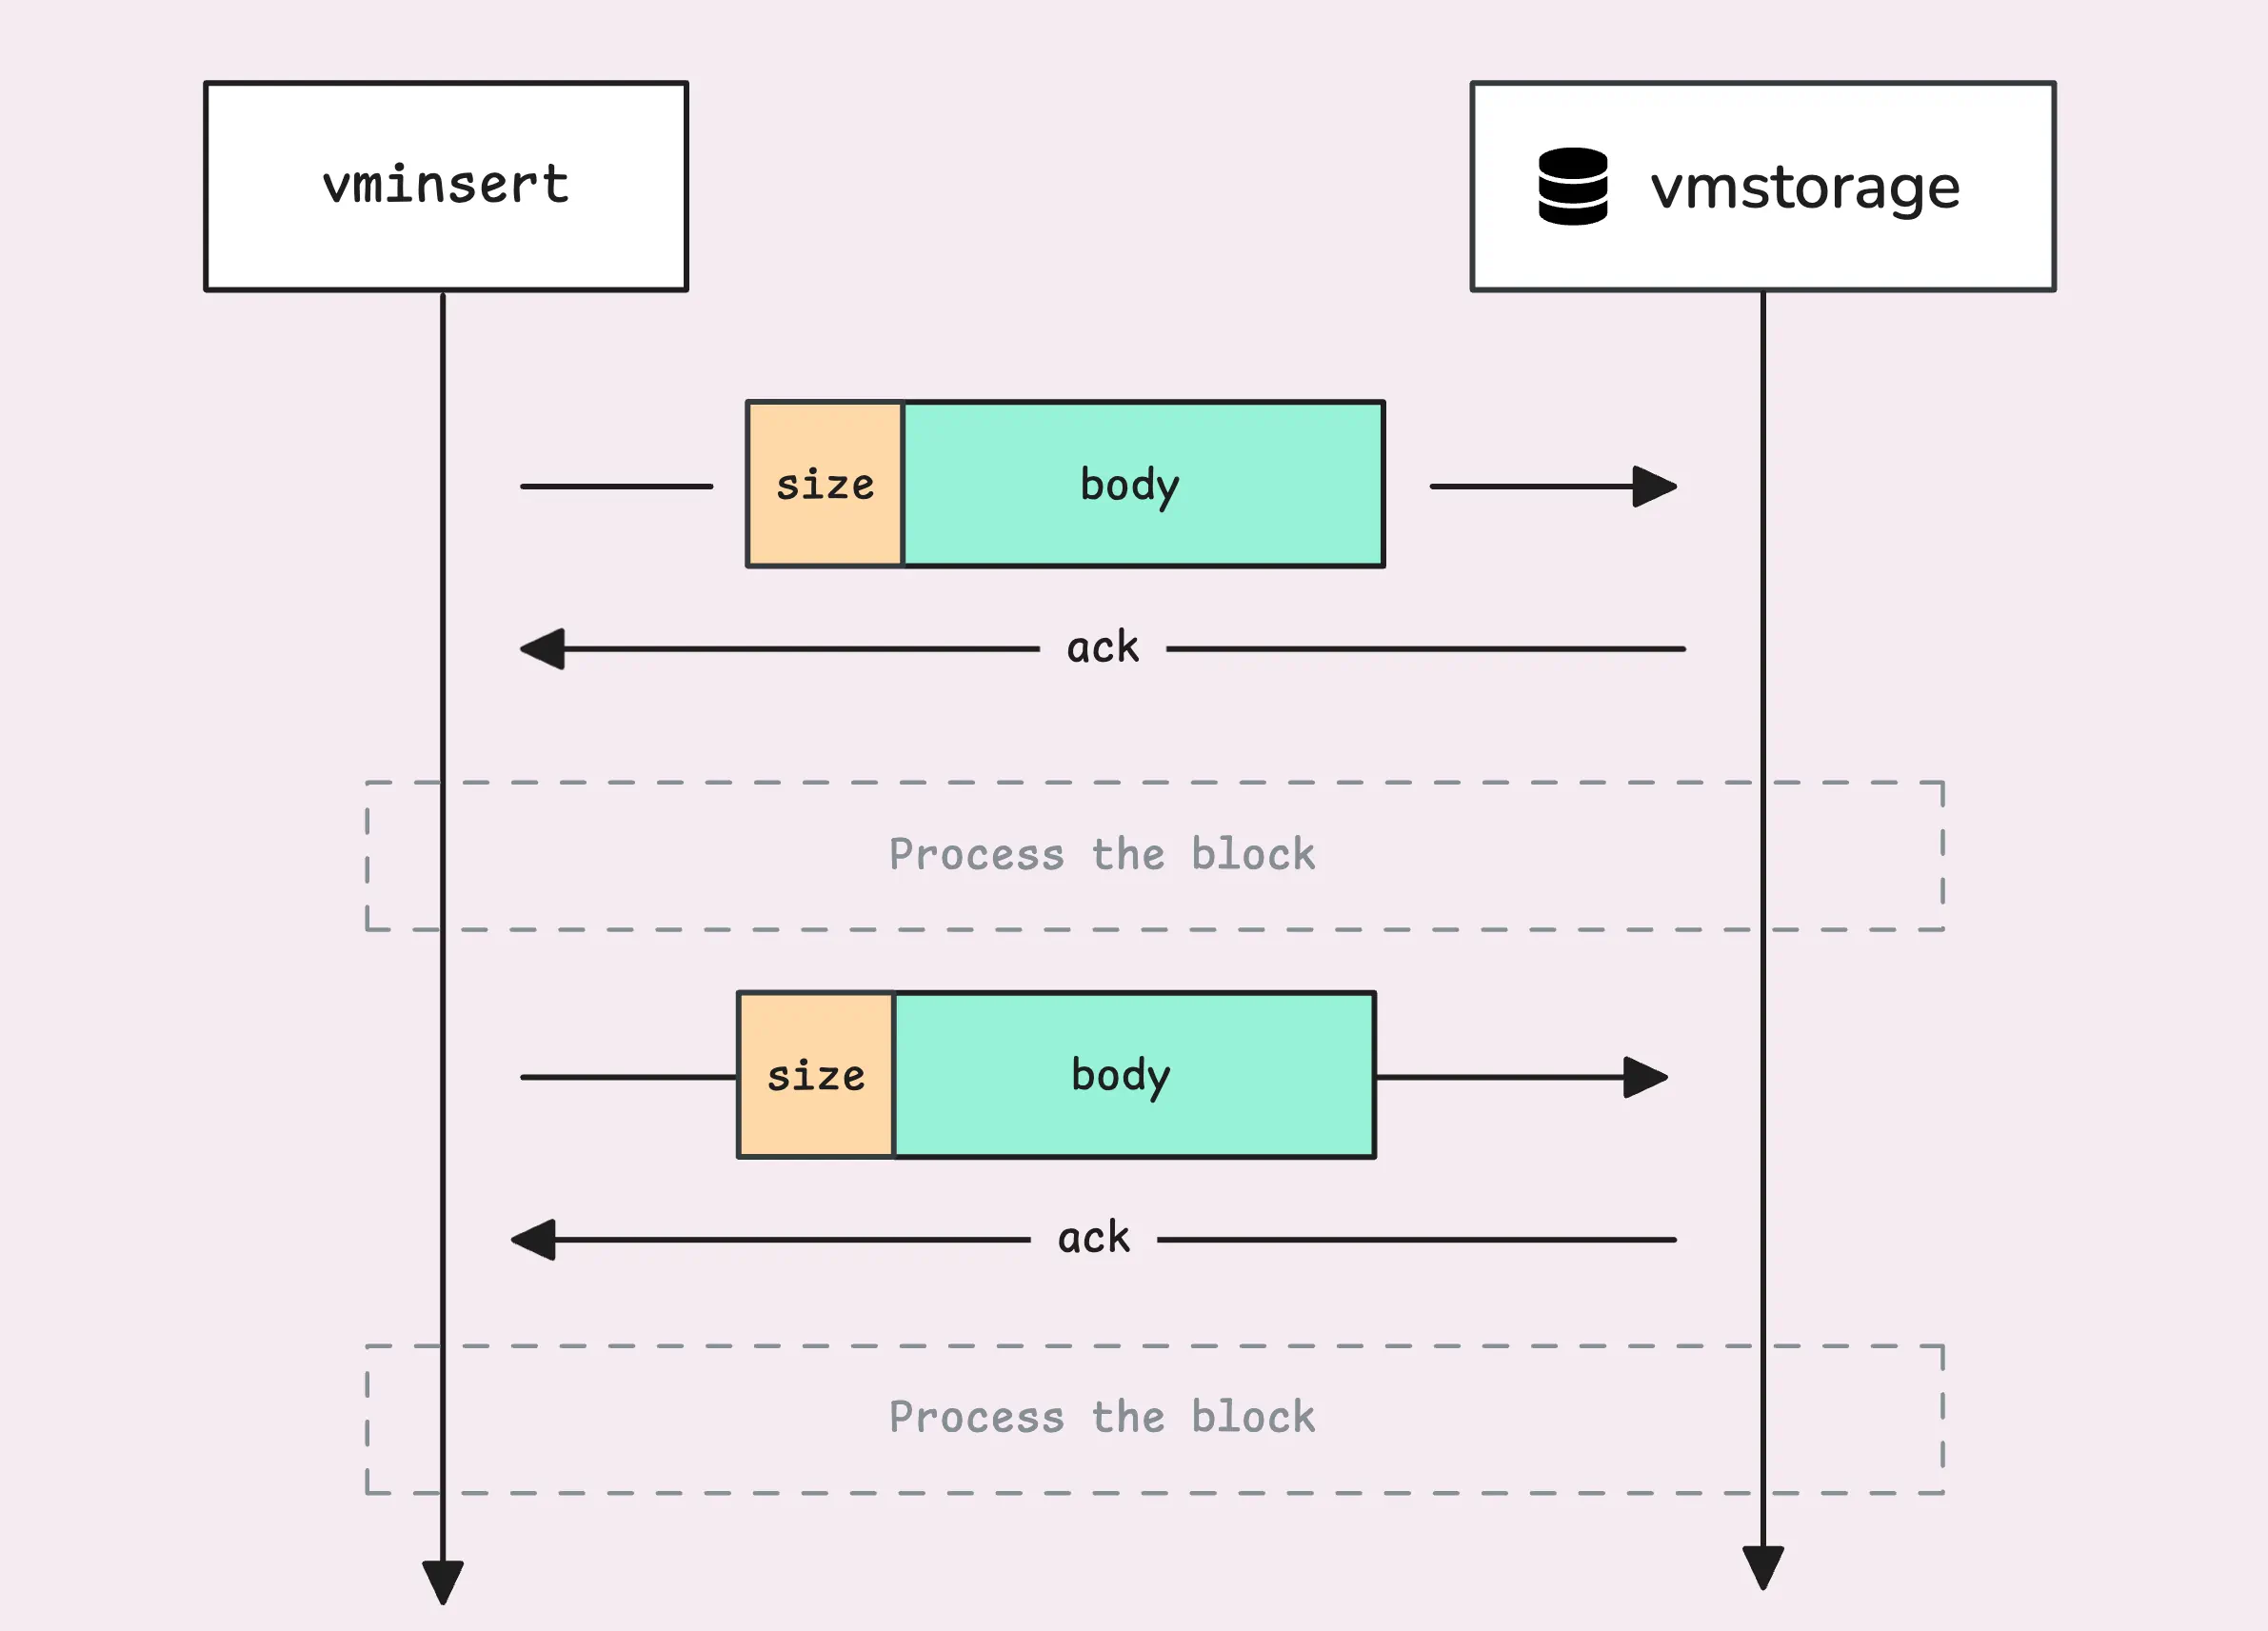
Each block begins with a simple header (8 bytes) that indicates the size of the block vmstorage needs to read.
This size is not supposed to exceed 100 MB. Interestingly, if you recall from the How VictoriaMetrics Agent (vmagent) Works, there’s another limit of 32 MB per block at the agent level. After successfully receiving (but not yet processing) the block, vmstorage sends an ACK (acknowledgement) back to vminsert.
Tip: Useful metrics
- The current number of active connections from vminsert to vmstorage:
vm_vminsert_conns. - How many times vmstorage failed to read from the stream:
vm_protoparser_read_errors_total. - How many times sending an
ACKback to the client failed:vm_protoparser_write_errors_total. - The total number of blocks successfully read:
vm_protoparser_blocks_read_total.
There’s an edge case worth noting: when vmstorage is running low on disk space, less than 10MB (-storage.minFreeDiskSpaceBytes), it switches to read-only mode. In this mode, it sends back a read-only ack for received data but ignores the actual content. vminsert recognizes this ack and resends the data later.
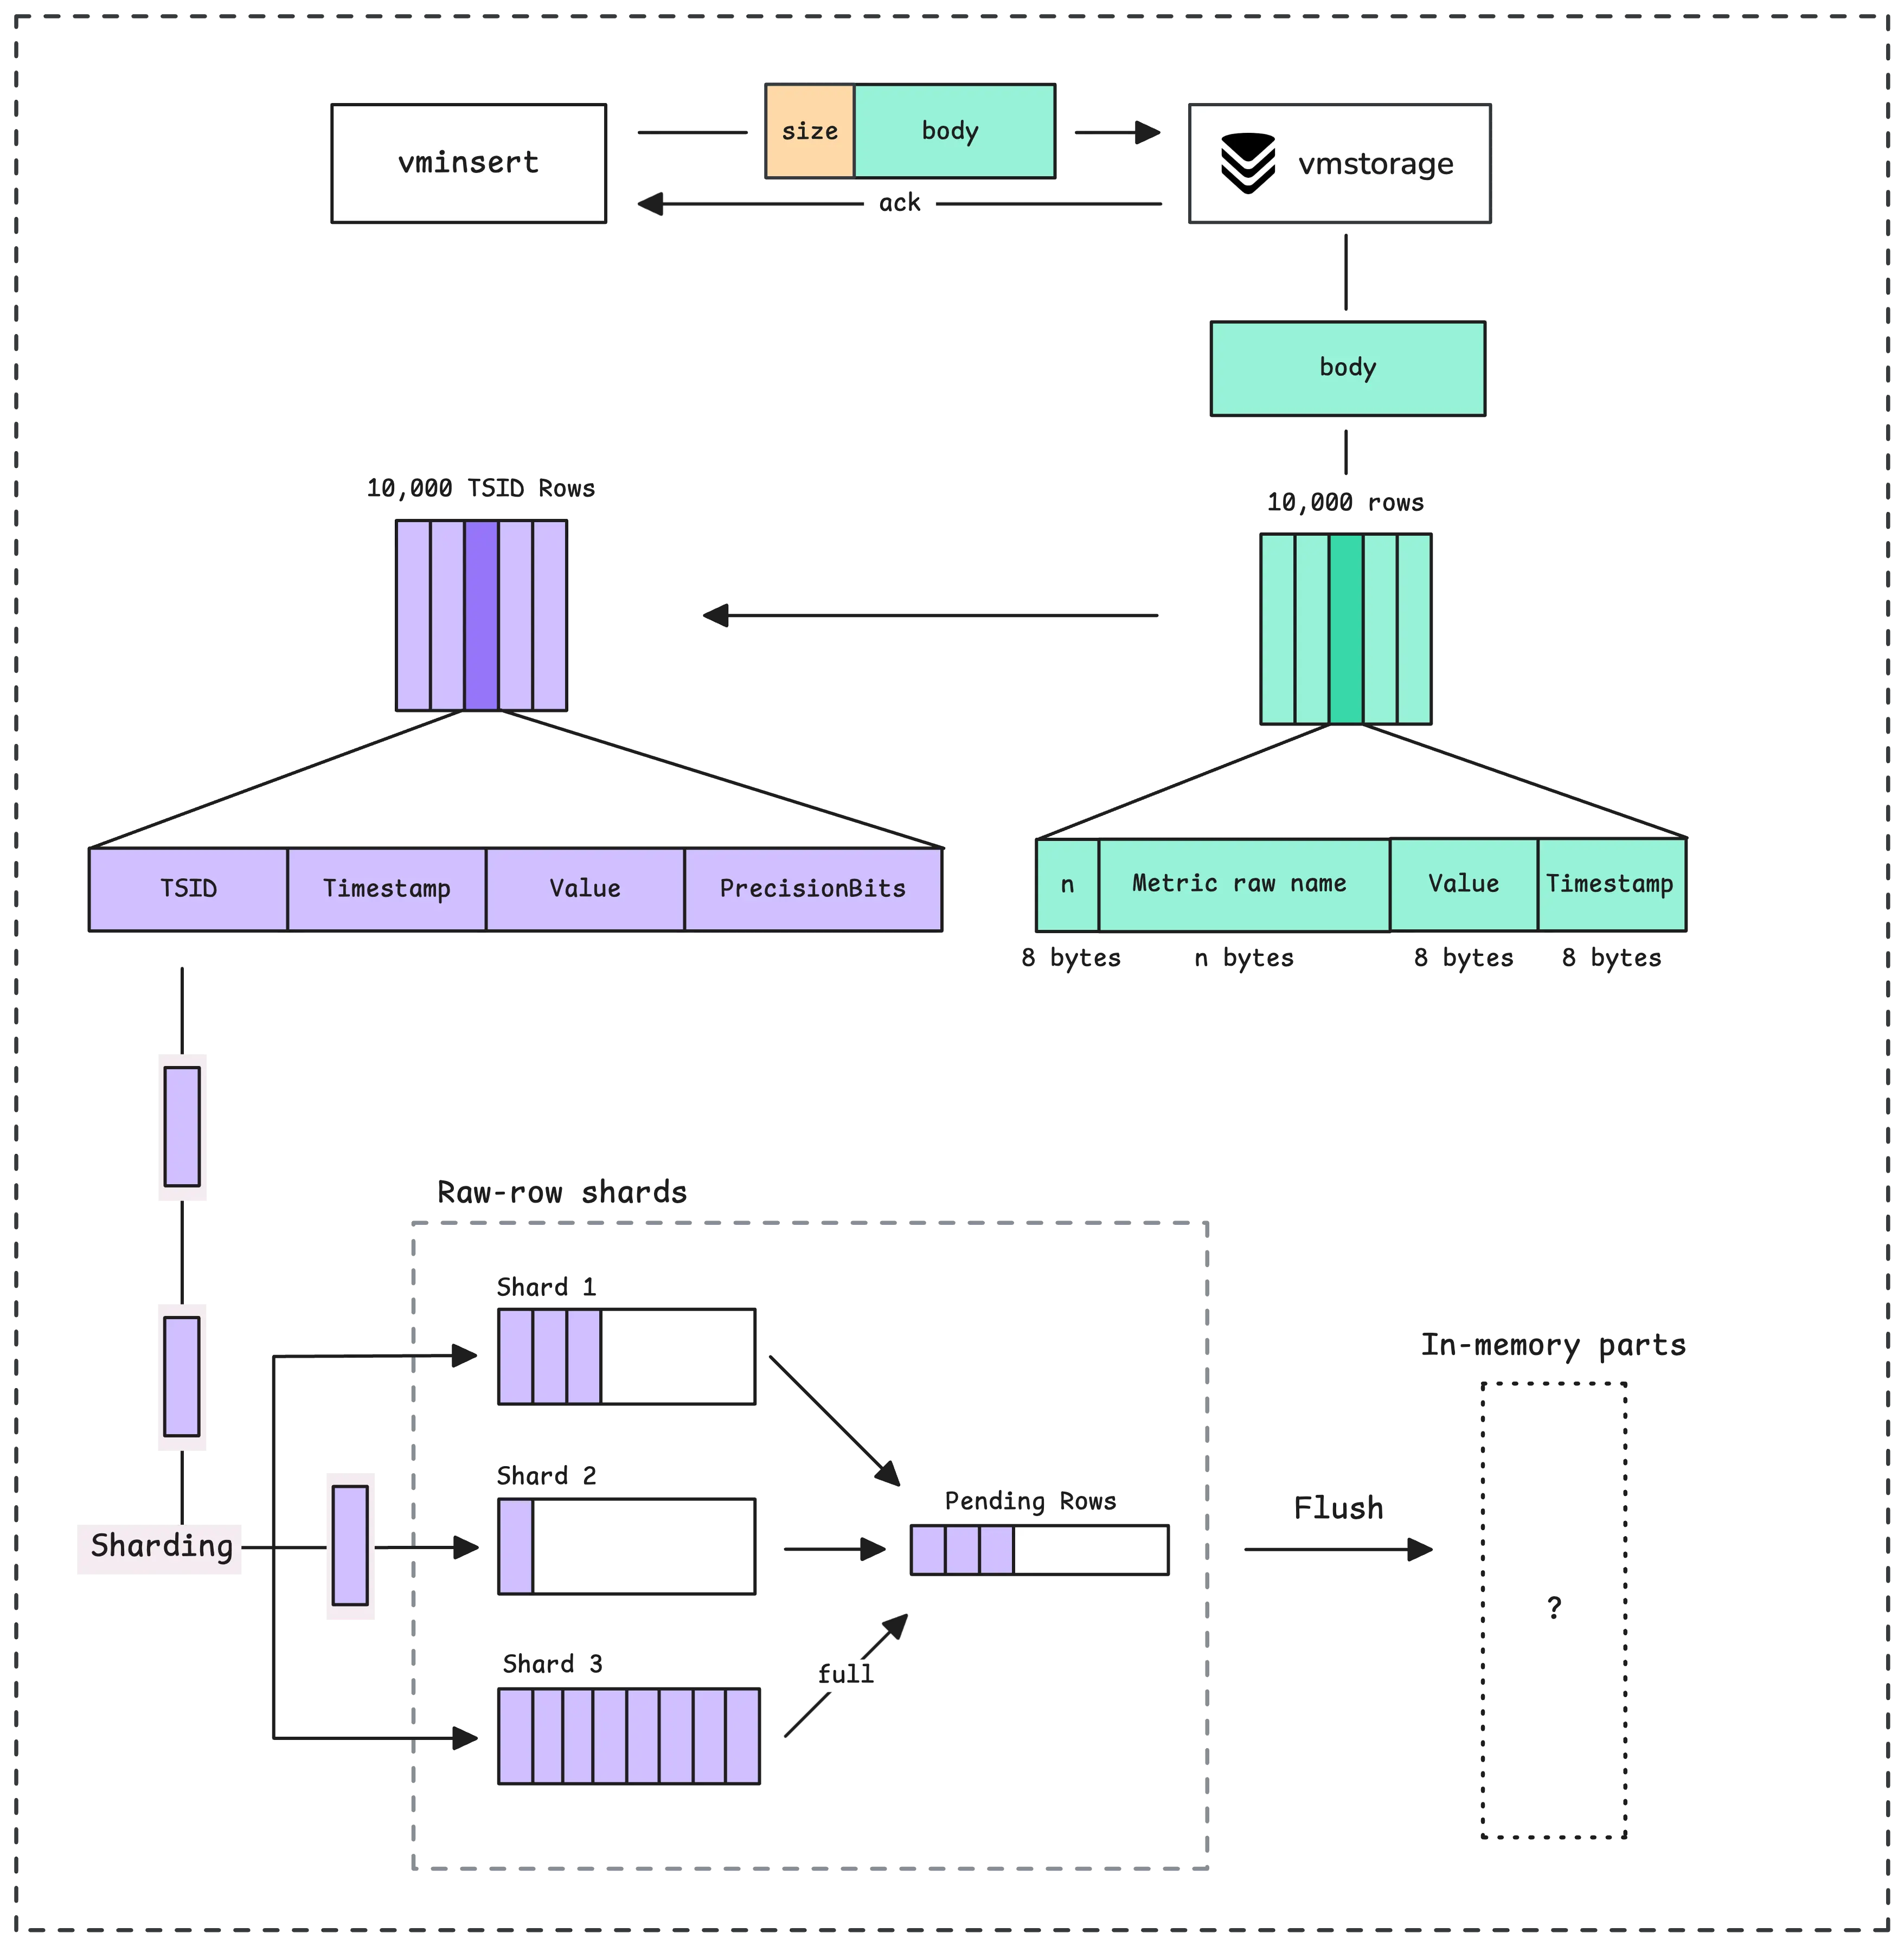
vmstorage just reads the block as a stream of raw bytes, and those bytes don’t make sense to it. It needs to parse them into metrics:
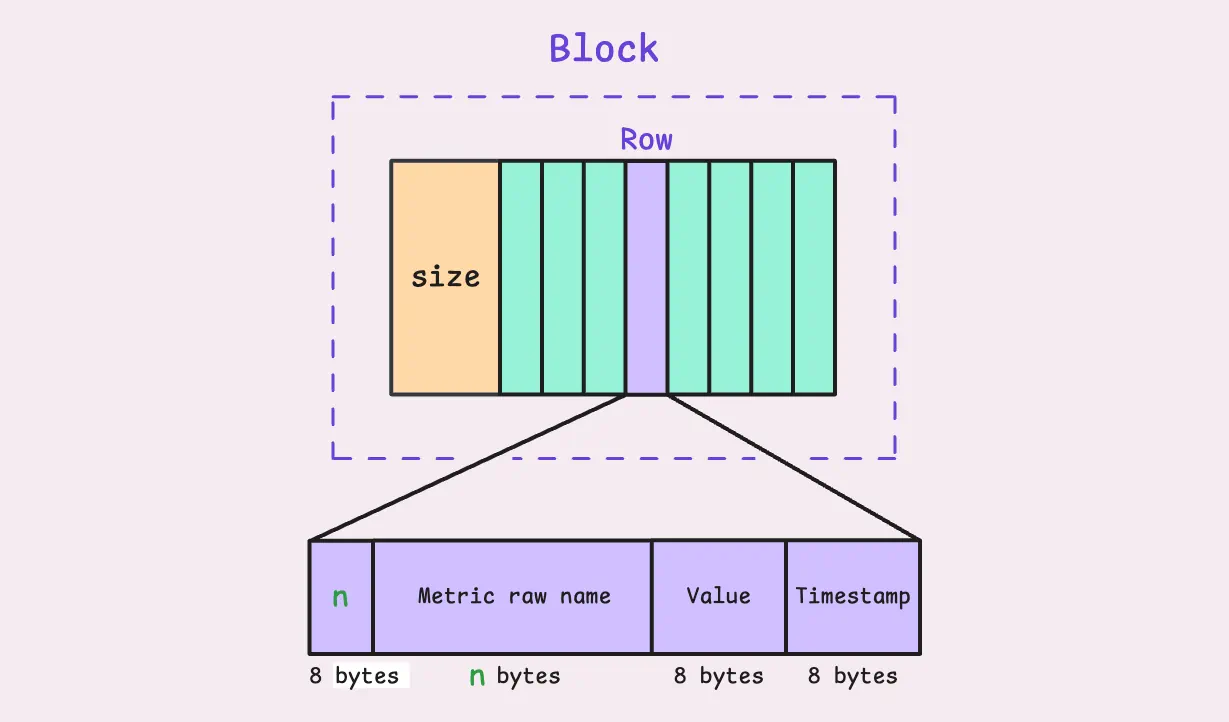
You can see the structure of each row in the block, at least 24+n bytes for each row. The metric raw name contains both the metric name and labels, such as http_requests_total{job="my_app",instance="host1",path="/foo/bar"}, but encoded in a specific format.
If the block is too big, vmstorage breaks it into smaller blocks, each containing a maximum of 10,000 rows, and inserts them into the internal storage. It exposes some metrics for this parsing process:
- How many blocks (10,000-row chunks) failed to parse:
vm_protoparser_parse_errors_total. - How many rows were successfully parsed from the big blocks to smaller ones:
vm_protoparser_rows_read_total.
If the data is valid and the storage is writable, we’re ready to go. Let’s review the big picture:
Finding TSID For Each Metric
#
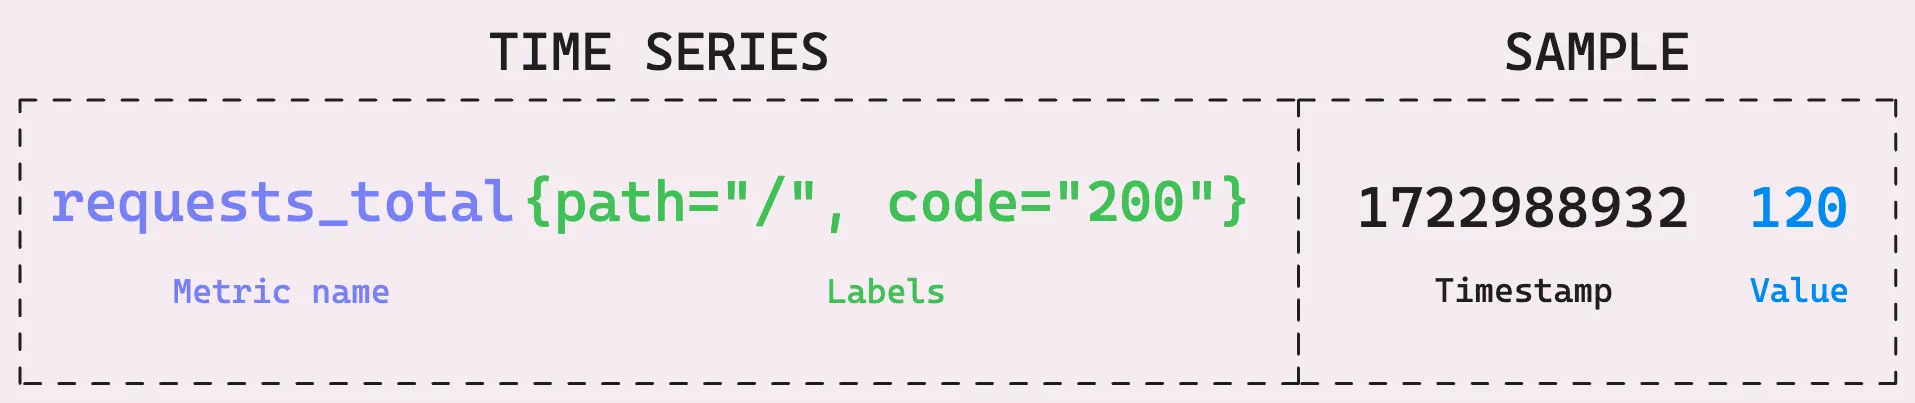
Before understanding what TSID is, let’s first build the context. Every piece of data, or metric row, comes with a few elements:
- A metric name like
http_requests_total, which gives you a clear idea of what the data is tracking. - A set of labels (optional) like
{job="my_app",instance="host1",path="/foo/bar"}. These labels add extra context, helping to locate where the data is from or what it’s monitoring. - A timestamp in milliseconds, such as
1731892875512, which tells when the data was captured. Metrics with timestamps more than 2 days into the future or past the retention policy are dropped. - A floating-point value, like
25.1, representing the actual data value.
vmstorage creates something called a “canonical metric name.” It combines the metric name with the metric’s sorted labels.
Labels are sorted to resolve the issue of two metrics with the same labels but in a different order, such as metric_name{instance="host",job="app"} and metric_name{job="app",instance="host"}, being treated as two separate timeseries. Once VictoriaMetrics has this sorted canonical name, it either finds or creates a unique identifier for that timeseries, called the TSID (TimeSeries ID).
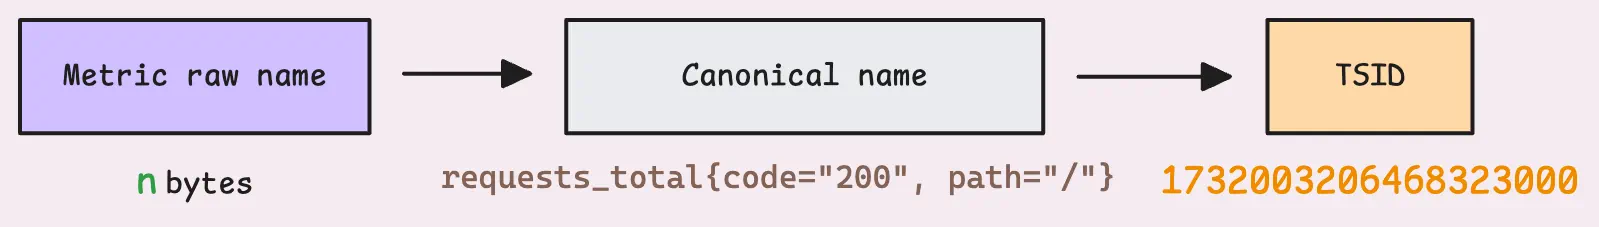
The TSID is basically a unique number (with other metadata) that represents the timeseries. Any changes to the metric name, key, value, or the order of labels will result in a brand new TSID.
Not every metric raw name requires building a TSID. vmstorage has an in-memory cache (or TSID cache) to directly map the raw name to the TSID:
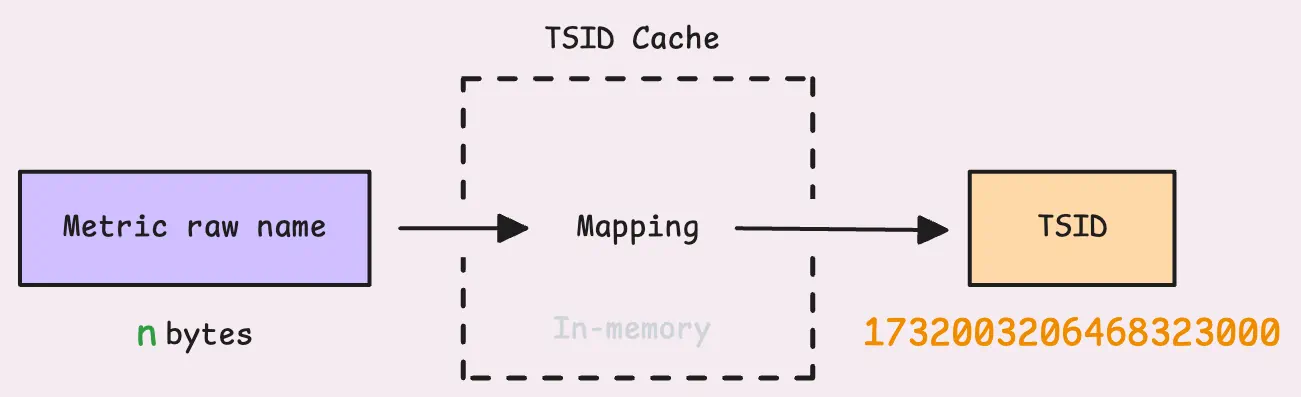
If the metric is already in the cache, things move along quickly since there’s no need to dig deeper.
But let’s say we’re out of luck, and the metric isn’t in the cache. VictoriaMetrics treats it as a slower insert because it’s… extremely slow. vmstorage then goes to IndexDB to look it up. IndexDB has its own memory cache, but after all, IndexDB is disk-based (you’ll find IndexDB stored in the {storageDataPath}/index folder). In cache-miss cases, pulling data from disk is not efficient.
Tip: Useful metrics
- How many times vmstorage failed to find a metric in the cache:
vm_slow_row_inserts_total.
Once the lookup succeeds, the result is cached to save time and avoid hitting the disk again for the same timeseries in the future.
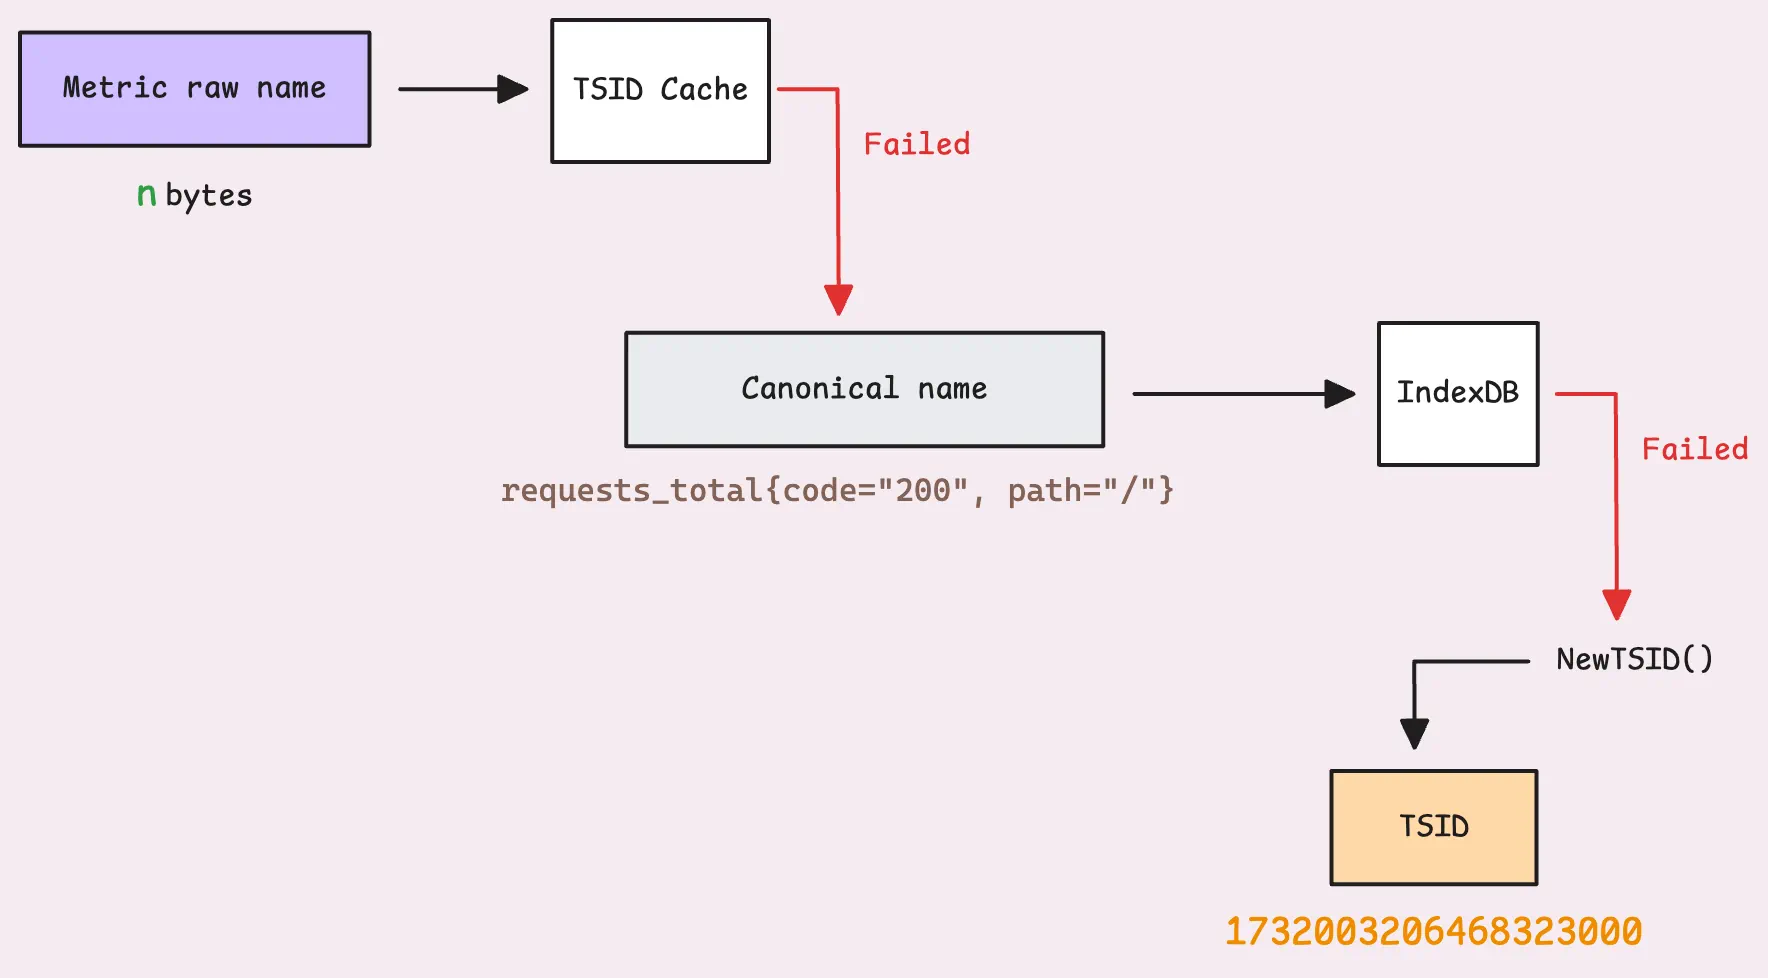
If the system can’t find it in IndexDB either, it generates a new TSID for the time series and registers it in both the in-memory cache and IndexDB. Many entries are created in IndexDB:
- An entry to map the metric’s date to the metric ID.
- An entry to map the metric ID to the TSID.
- An entry to map (date, metric) to the TSID.
- The metric name and each label in the metrics (e.g.,
code="200",path="/") also have their own entries mapped to the metric ID. - And many more…
For more details, check out the IndexDB brief. We will explain it in another article about querying data, where it’s more suitable to cover IndexDB.
Now, that’s a lot of work for a new time series, right?
That’s why keeping an eye on time series churn (how often new time series are created and old ones are dropped) is so important. A high churn rate can significantly impact performance or even crash the system because it’s constantly generating new TSIDs and registering them.
Tip: Useful metrics
Total count of new time series created: vm_new_timeseries_created_total.
It’s also recommended to keep your labels (key-value pairs) within a limited set. A common mistake is using too many values for a label, like userID="X", ip="Y", etc., where userID, ip, and similar values are unbounded.
The good news is that vmstorage lets you control how many new time series can be created in an hour (-storage.maxHourlySeries) and per day (-storage.maxDailySeries) to protect the system. Any new time series exceeding these limits will be rejected.
Tip: Useful metrics
How many rows ignored due to reasons like timestamps or series cardinality: vm_rows_ignored_total{reason=*}.
Now, let’s update the big picture with a few changes at the end, so we can move on to the next step:
Inserting Data to In-Memory Buffer
#
After the IndexDB phase, those TSIDs are sorted. VictoriaMetrics takes the actual data sample, which includes the TSID, a timestamp, and a value, and places it into an in-memory buffer.
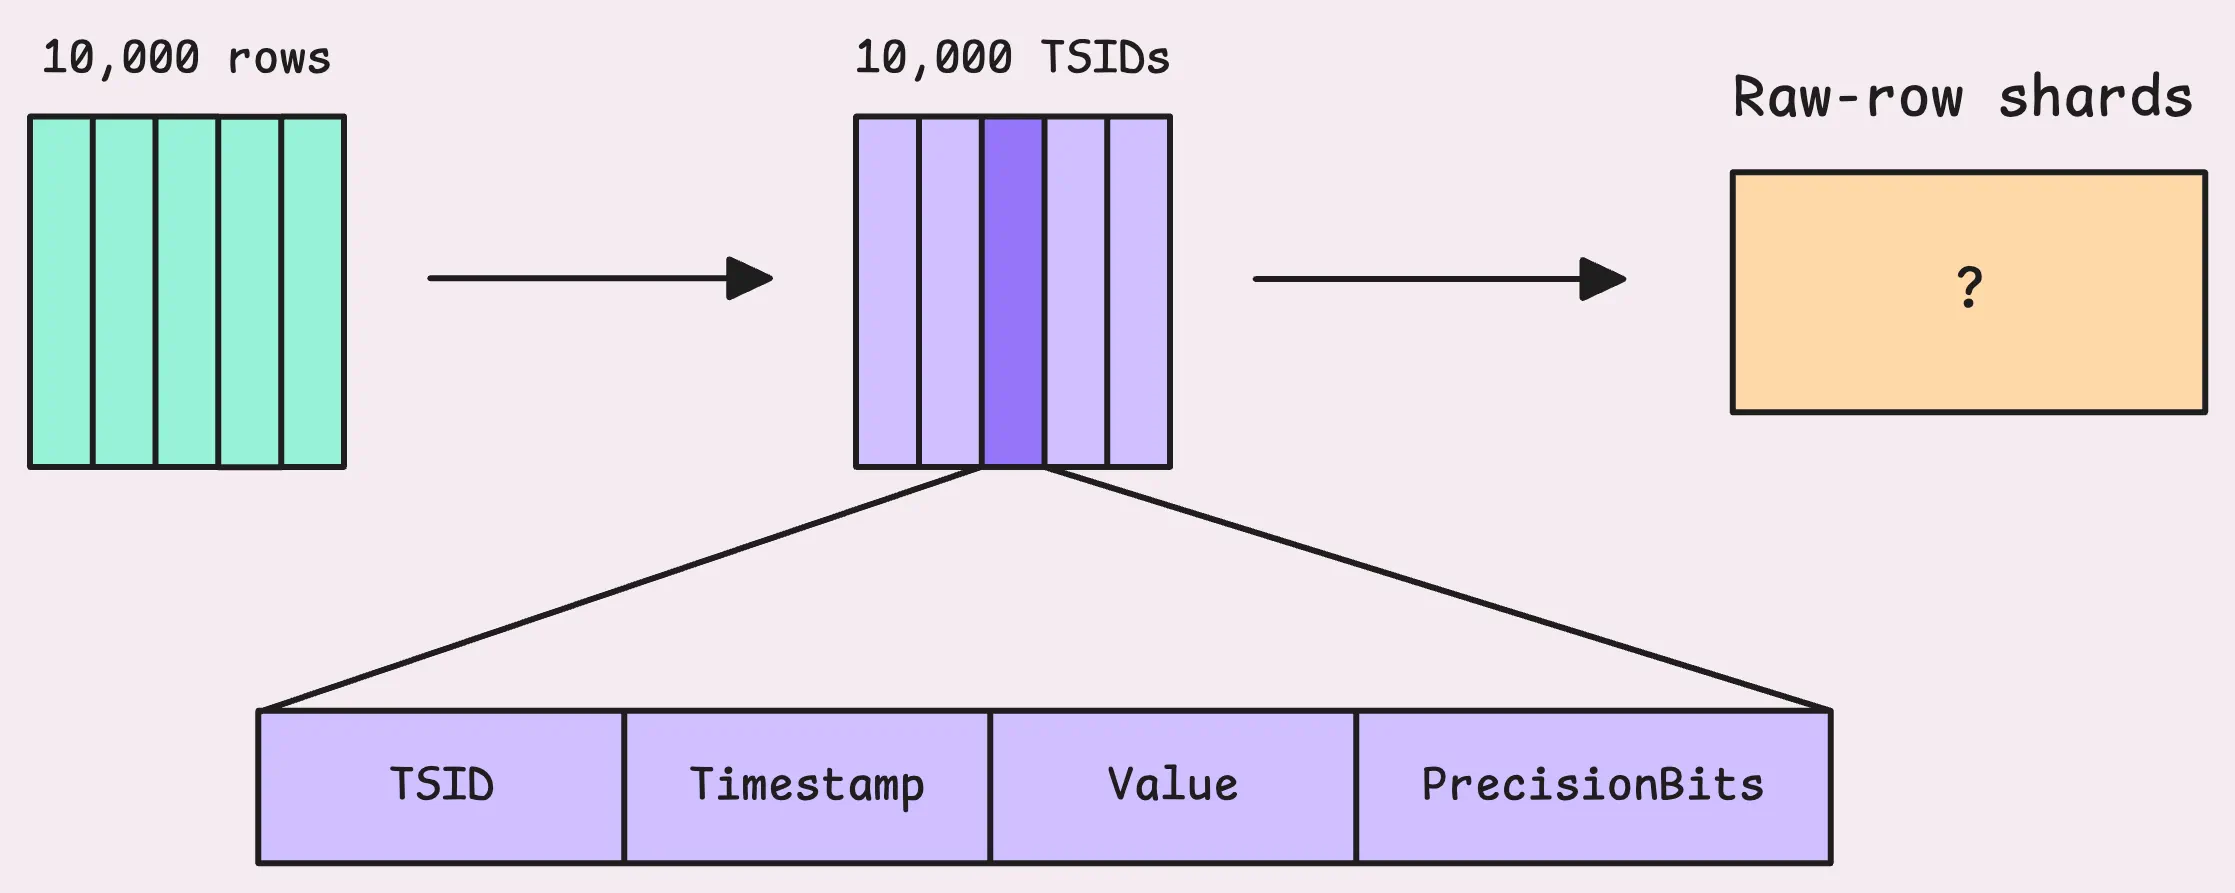
This buffer is called raw-row shards and holds up to 8 MB of data, which comes out to about 149,796 rows. The number of shards for each partition (which represents one month of data) matches the number of CPU cores you have. So, if your machine has 4 cores, you’ll get 4 shards, taking up to 32 MB maximum.
The buffer’s name is quite telling; those TSIDs will be sharded and distributed into different raw-row shards.
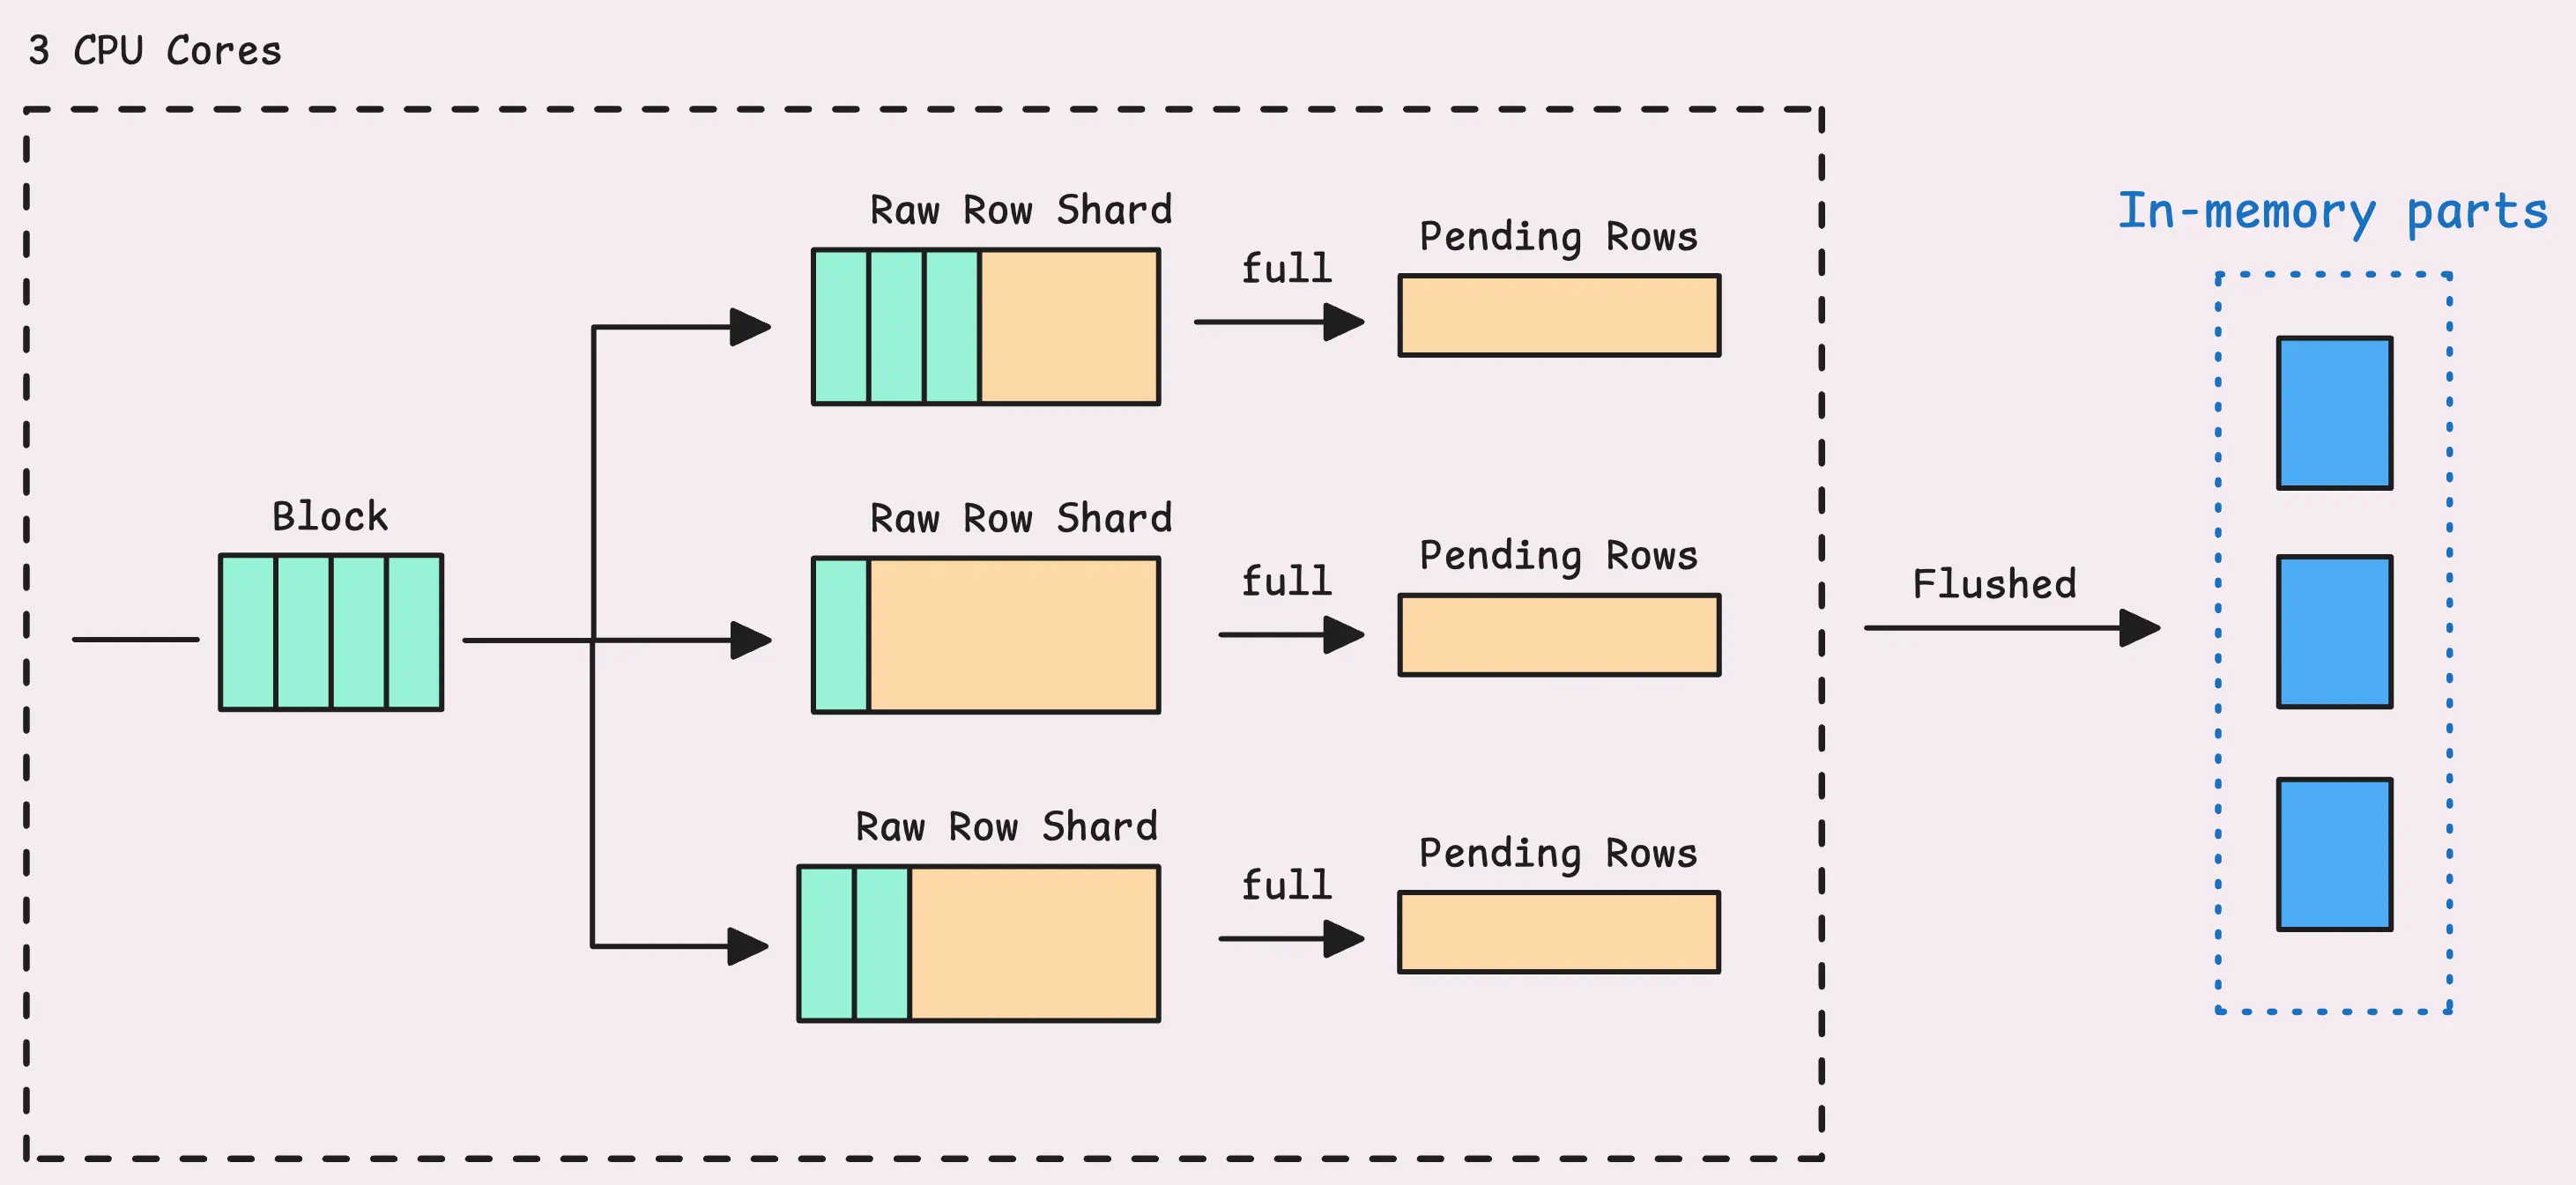
If a shard fills up, the rows are pushed into what’s known as “pending series.” From there, they wait to be grouped into an “LSM part” and eventually written to disk.
Note that the rows sitting in this sharded buffer are not searchable yet. So, if you try to query them using Grafana or another tool immediately after ingestion, they won’t show up until they’re flushed into an LSM part (the flushing happens in the background and LSM parts will be explained in the next article).
And just like that, the data ingestion process wraps up for this block. The system is ready to take on the next batch of metric rows and start the process all over again.
Tip: Useful metrics
How many errors occurred after processing this whole process: vm_protoparser_process_errors_total.
In case you need a refresher on what’s happened so far:
Our discussion is now complete regarding how data is ingested into vmstorage and shows up in the UI or can be queried through the API. To understand how vmstorage works in the background to persist data, see How vmstorage Processes Data: Retention, Merging, Deduplication,….
Who We Are
#
Need to monitor your services to see how everything performs and to troubleshoot issues? VictoriaMetrics is a fast, open-source, and cost-efficient way to stay on top of your infrastructure’s performance.
If you come across anything outdated or have questions, feel free to send me a DM on X (@func25).
Leave a comment below or Contact Us if you have any questions!
comments powered by Disqus