- Blog /
- How vmstorage's IndexDB Works
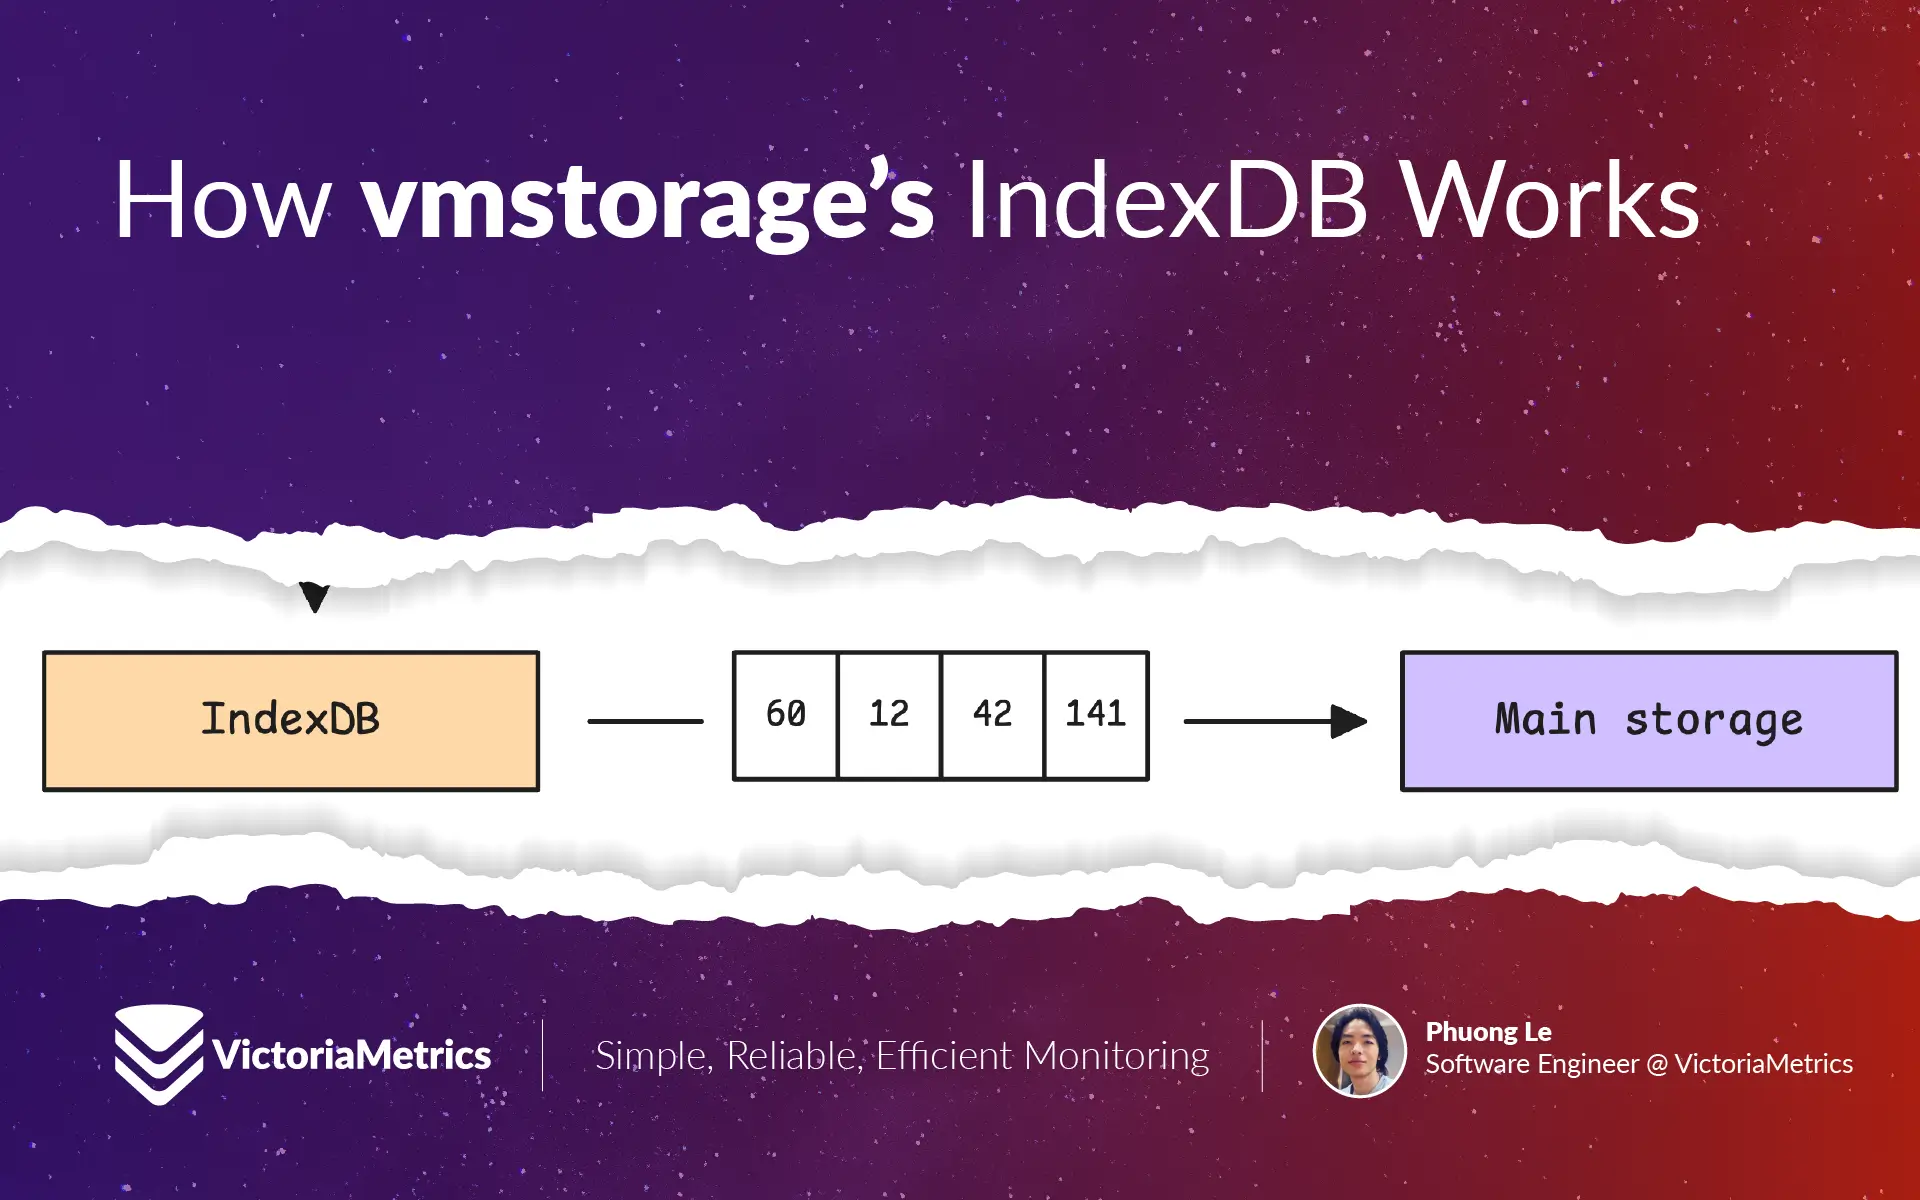
How vmstorage's IndexDB Works
Share:


This article is part of our ongoing VictoriaMetrics series, where we break down how different parts of the system work:
- How VictoriaMetrics Agent (vmagent) Works
- How vmstorage Handles Data Ingestion
- How vmstorage Processes Data: Retention, Merging, Deduplication,…
- When Metrics Meet vminsert: A Data-Delivery Story
- How vmstorage’s IndexDB Works? (We’re here)
- How vmstorage Handles Query Requests From vmselect
- Inside vmselect: The Query Processing Engine of VictoriaMetrics
This discussion assumes you’ve already checked out the earlier articles, which cover how vmstorage handles data ingestion and what happens when it processes data.
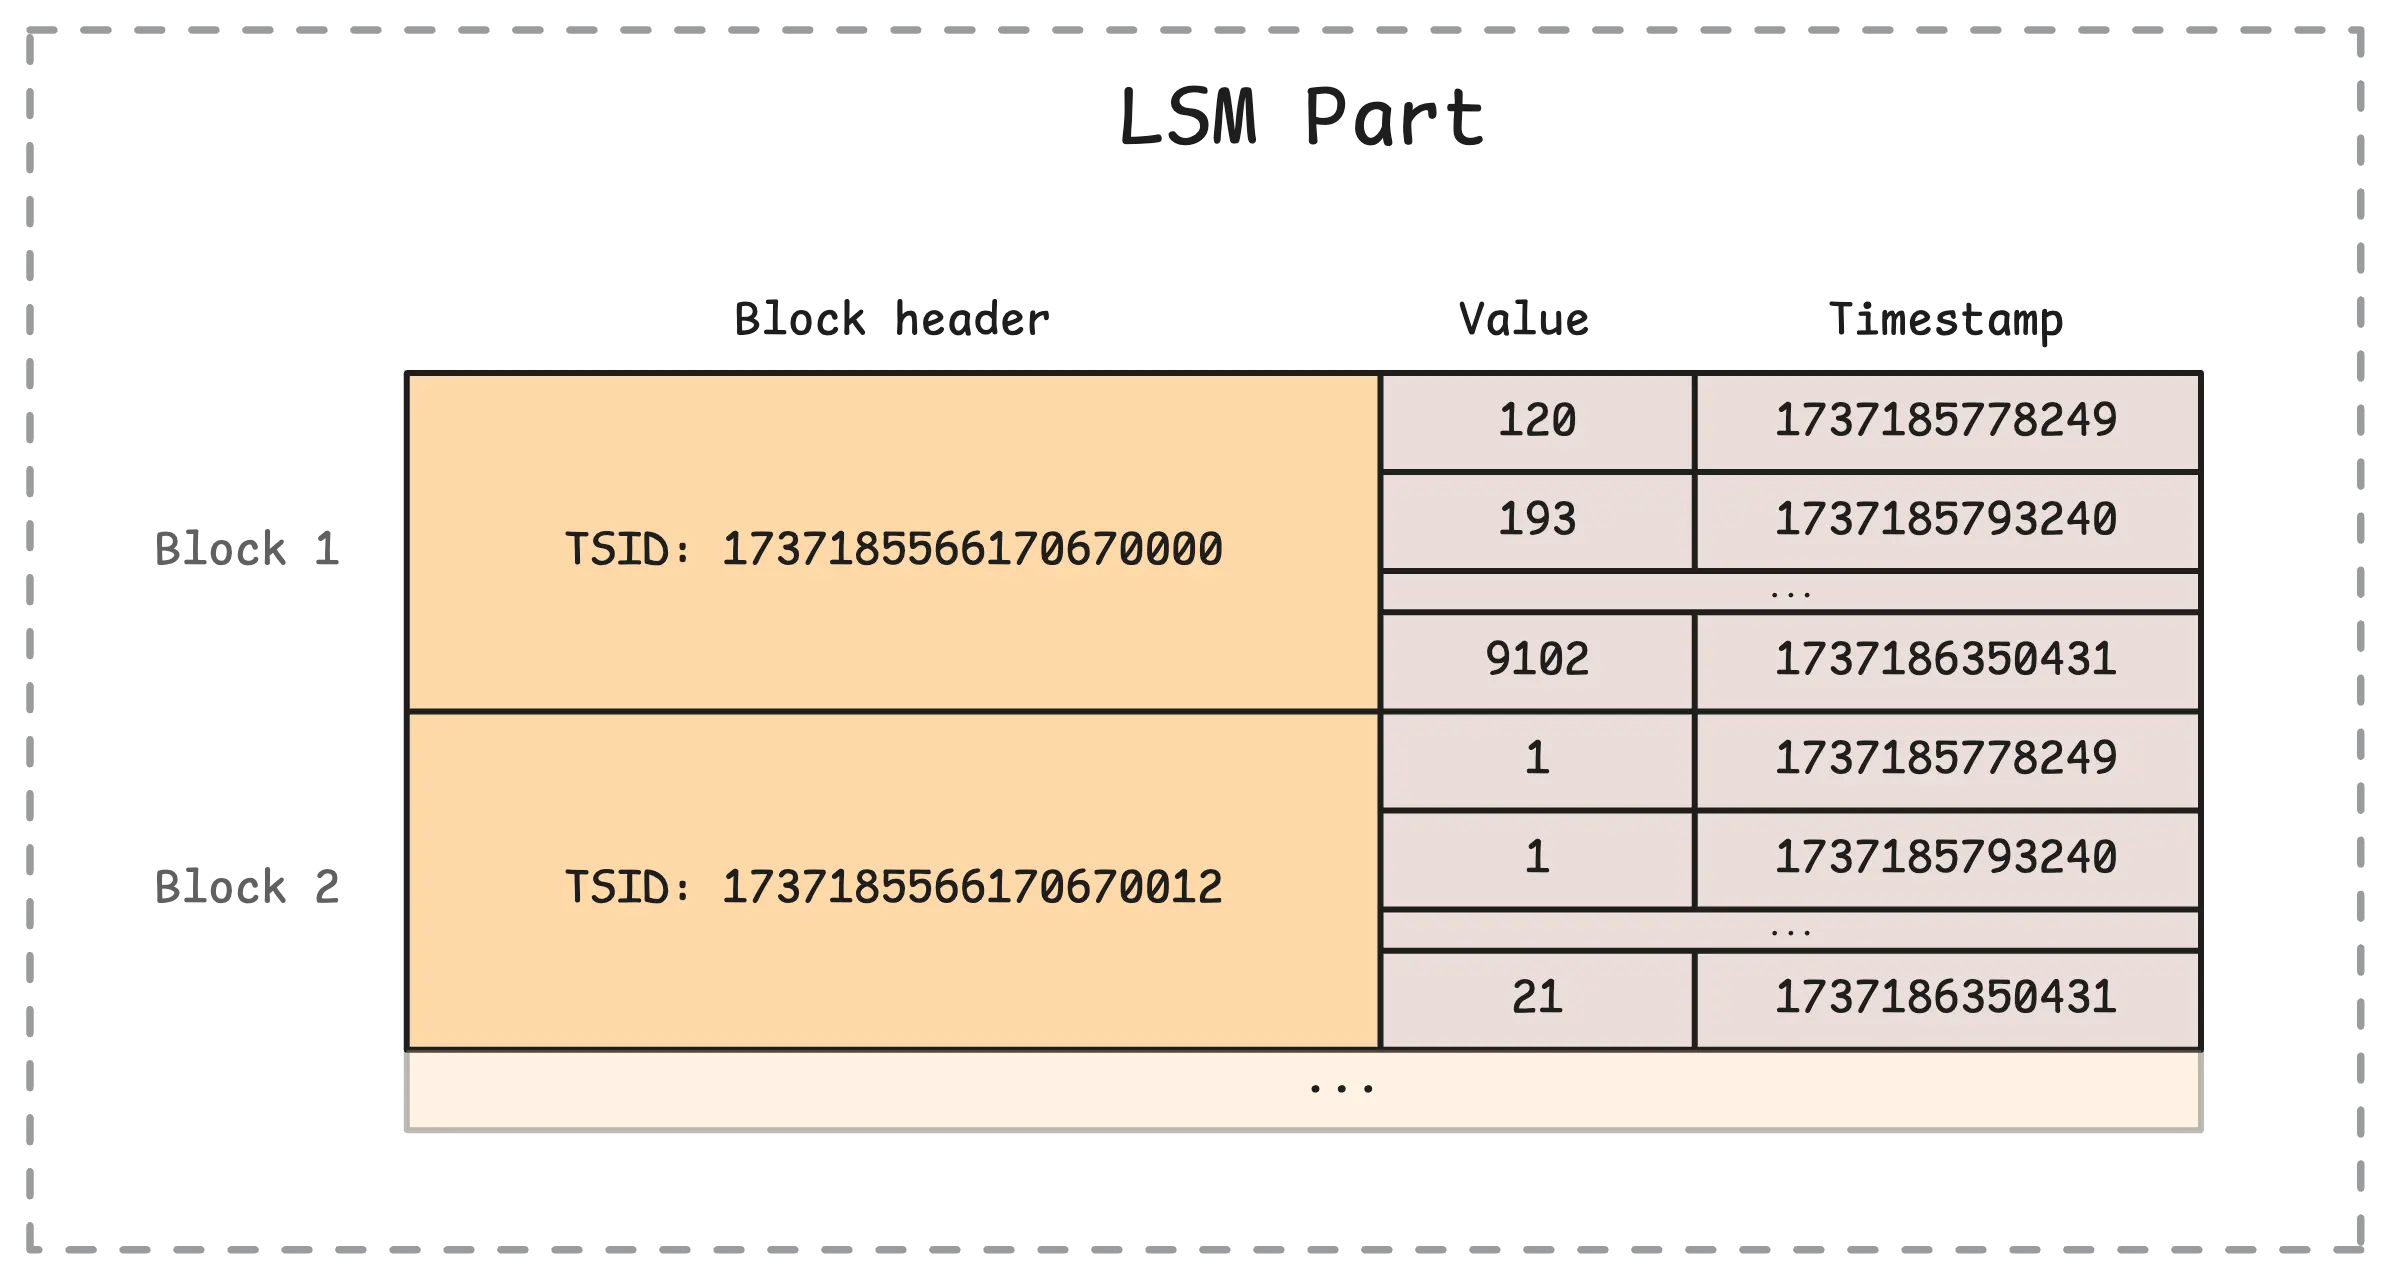
vmstorage does not store the full time series name, such as node_cpu_seconds_total{mode="idle"}, directly in its main storage. Instead, each part stores a time series identifier (TSID) together with the sample values and timestamps. The picture below shows what this looks like inside a single part in the main storage:
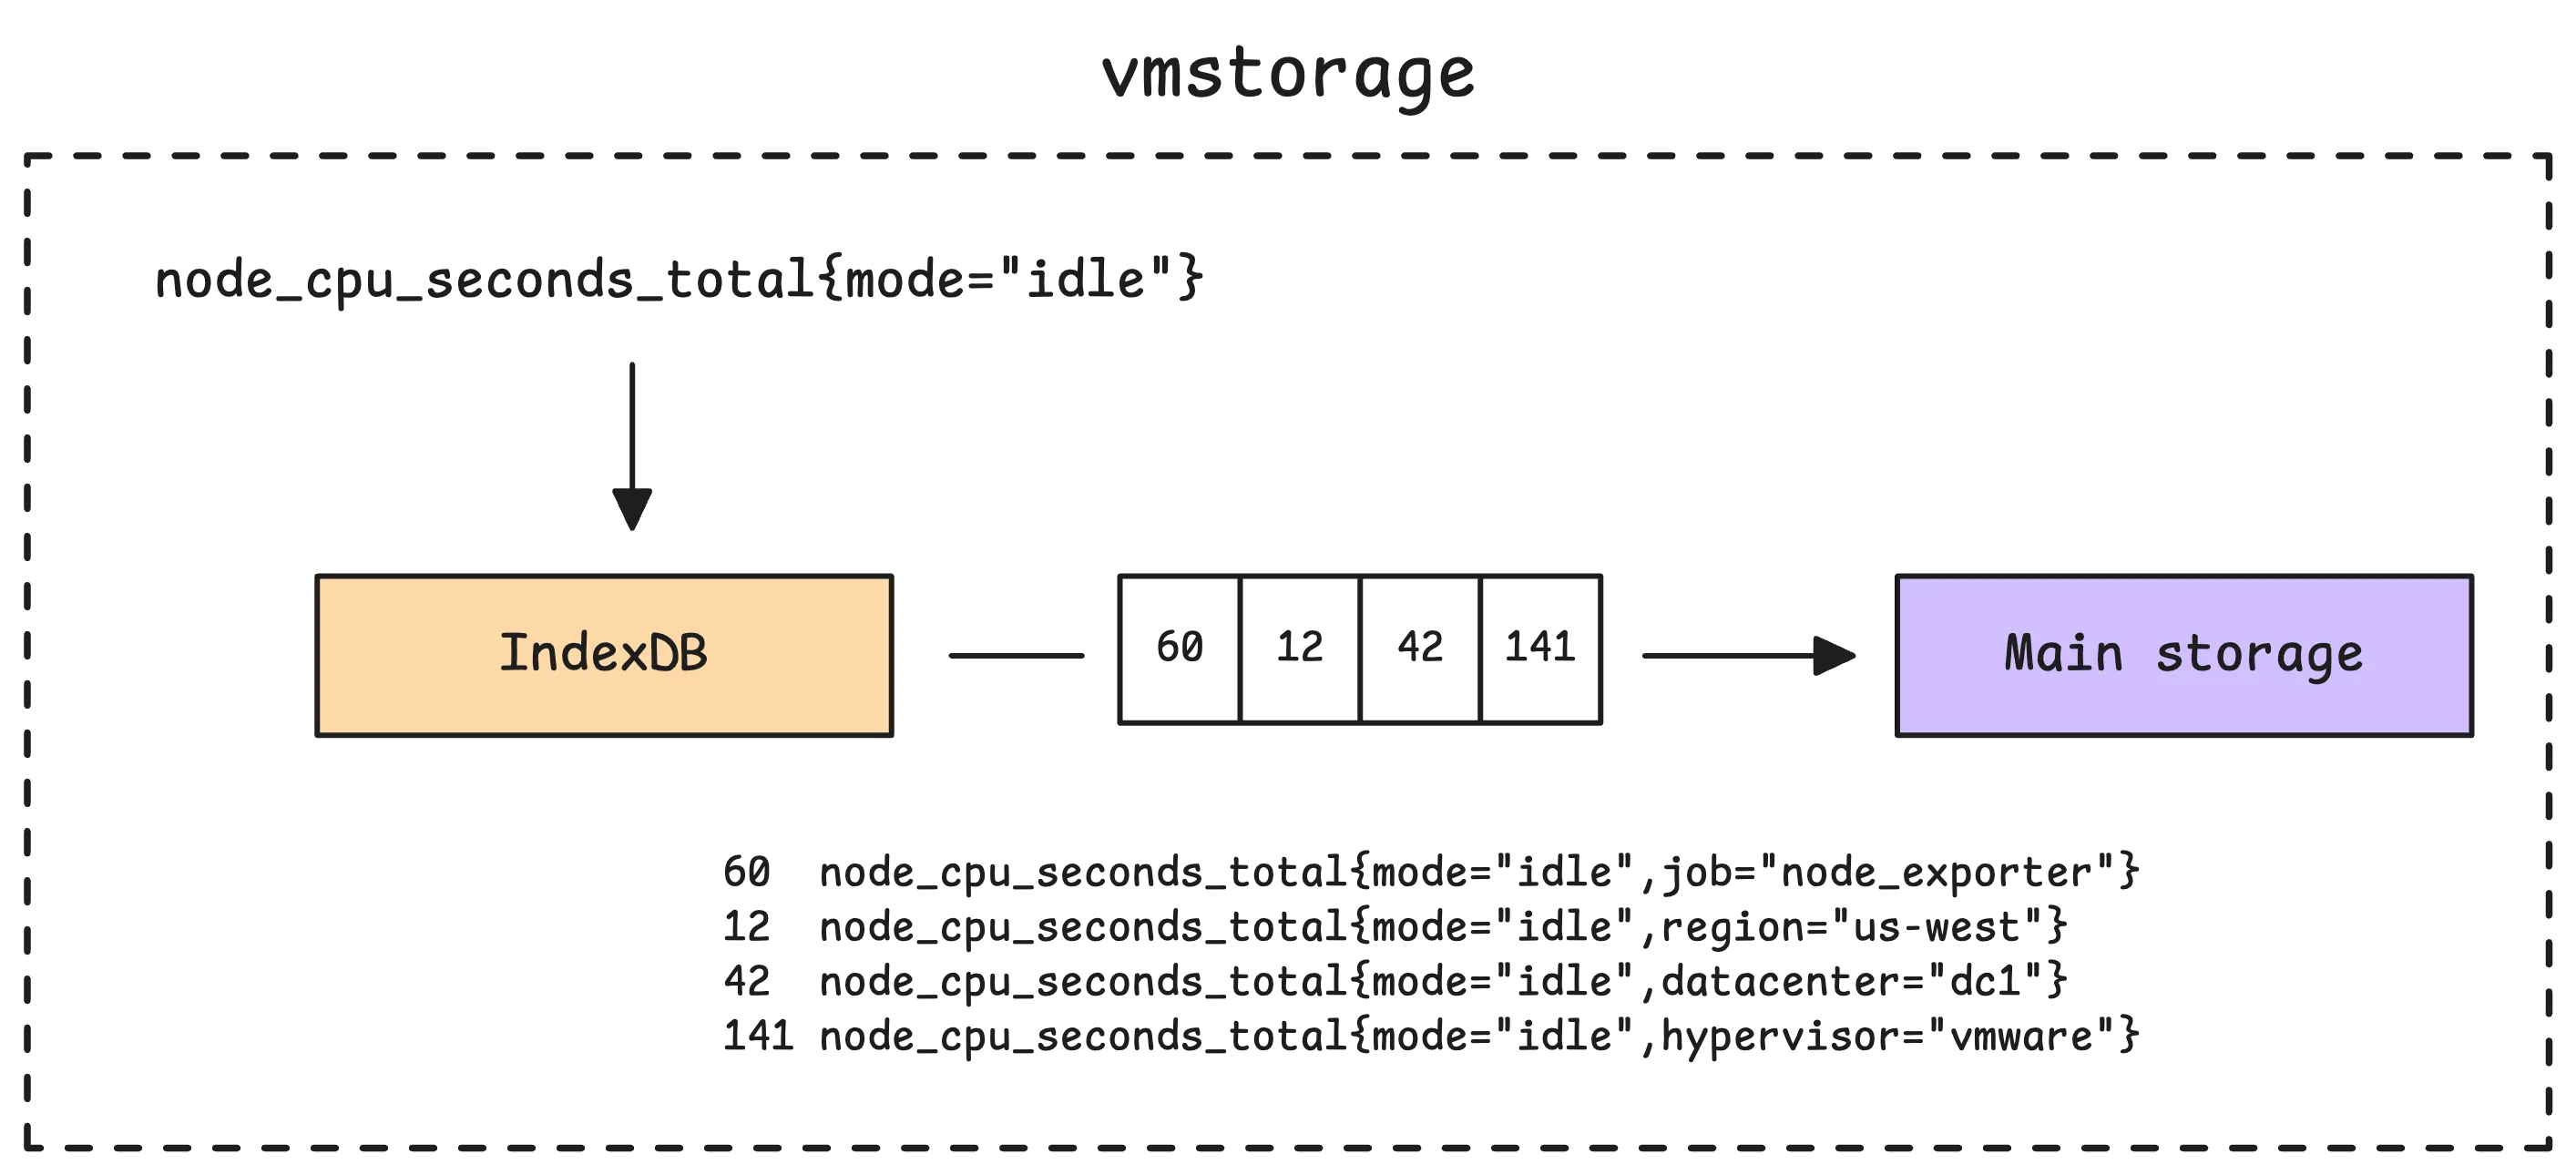
So how does vmstorage know which TSID belongs to which metric? That is the job of the index database (IndexDB). It keeps the mappings that let vmstorage go from a human-readable metric name and its labels to the corresponding TSID.
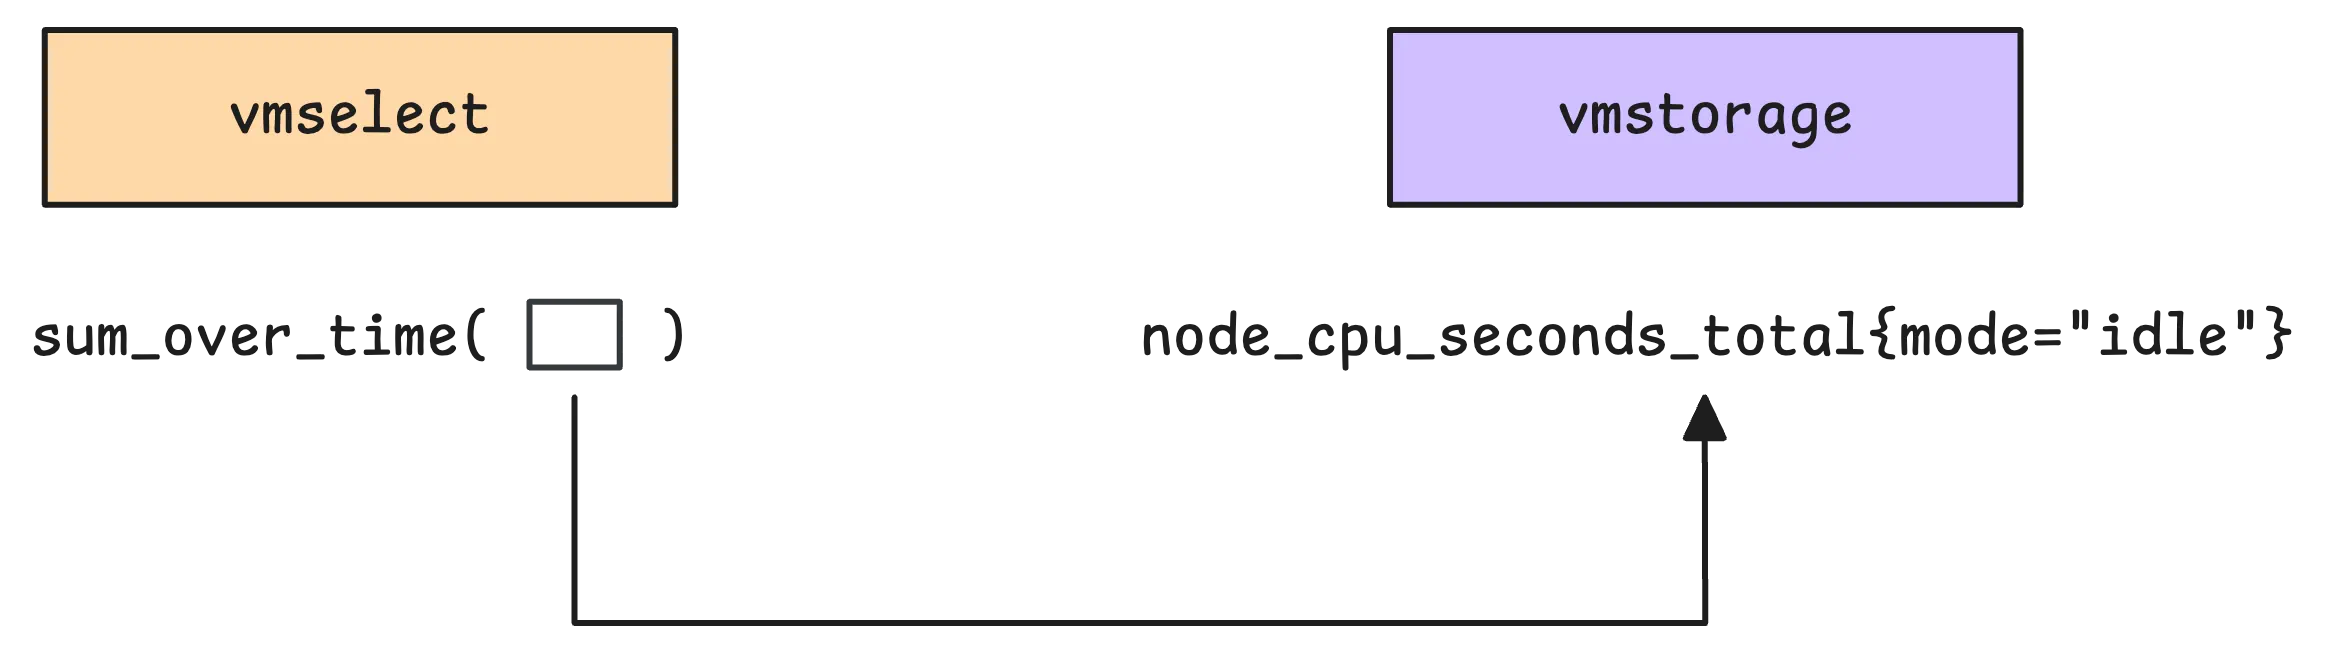
For example, when you run a query such as sum_over_time(node_cpu_seconds_total{mode="idle"}[5m]), vmstorage mainly needs to identify the matching time series and fetch the samples for the requested time range. The aggregation itself, sum_over_time, is evaluated later by vmselect after vmstorage returns the matching samples.
So what’s the main job of IndexDB?
Simply put, it translates human-readable metric names, like node_cpu_seconds_total{mode="idle"}, into the internal identifiers vmstorage uses to find the data, and those are the TSIDs.
TSID (Timeseries ID) is technically a wrapper around a metric ID, with a few extra fields. The metric ID itself is a large, unique number that identifies each timeseries. From the user’s perspective, there is not much practical difference between TSIDs and metric IDs. Since they have a one-to-one mapping, we will use the terms interchangeably for educational purposes.
Once the TSIDs are known, vmstorage uses them to dig into its main storage and pull out the actual metric data. At a high level, that storage is a collection of blocks associated with individual TSIDs. After retrieving those blocks, vmstorage sends them to vmselect for further processing.
Now, here’s something we haven’t touched on yet: how exactly does IndexDB deal with new metrics as they are added to vmstorage? And how does vmstorage use it while serving requests from vmselect? That’s what we’ll cover in this discussion.
How IndexDB is Structured
#
In vmstorage, each partition has its own IndexDB. Recall that a partition covers one calendar month (YYYY_MM) in UTC, so its IndexDB covers that same monthly time range.
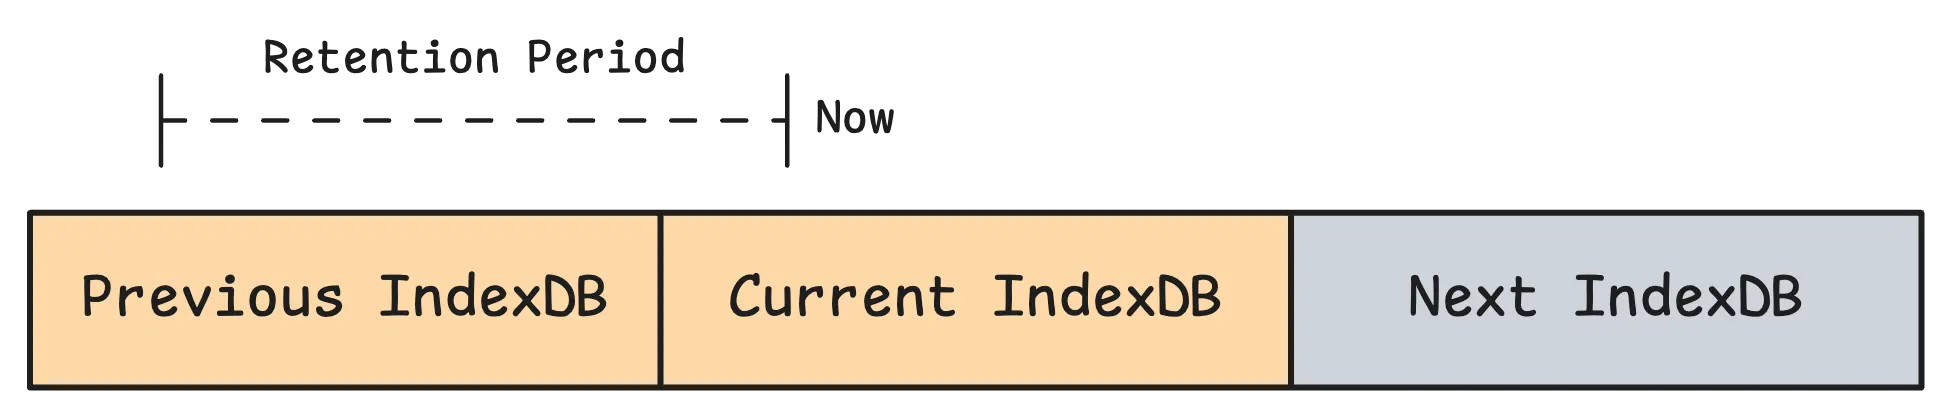
Before VictoriaMetrics v1.133.0, vmstorage used a legacy three-stage IndexDB layout built around previous, current, and next index databases. That model rotated IndexDBs on retention deadlines instead of keeping one IndexDB per time partition. This article focuses on the newer partition-based design introduced in v1.133.0.
Since IndexDB belongs to a partition, it follows the same lifecycle as that partition:
- For ingestion, vmstorage maps each incoming sample to a partition by time and writes index entries into that partition’s IndexDB.
- For querying, vmstorage looks at the query time range, finds all partitions whose time ranges overlap with it, searches their IndexDBs, and merges the matched
TSIDsbefore reading data blocks. - Retention follows partition boundaries too: when a partition becomes fully out of retention, vmstorage drops that partition together with its IndexDB.
Each row in IndexDB starts with a numeric prefix (for example 1, 2, 3, and so on). This prefix tells vmstorage what kind of row it is looking at. In the default setup, there are 7 main prefixes in active use.
Tag to metric IDs (Global index) – This maps a specific tag to metric IDs. For example,
1 status=200 67,99,100,120,130(1is the prefix,status=200is the tag, and67,99,100,120,130are the metric IDs where this tag appears). This is one of the main mappings vmstorage uses to find matching metric IDs.Metric ID to TSID (Global index) – After vmstorage finds metric IDs from the first mapping, this one links each metric ID to its
TSID. For example,2 49 TSID{metricID=49,...}(2is the prefix,49is the metric ID, andTSID{metricID=49,...}is the TSID mapped to that metric ID).Metric ID to metric name (Global index) – This maps a unique metric ID back to the original time series name. For example,
3 49 http_request_total{method="GET",status="200"}(3is the prefix,49is the metric ID, andhttp_request_total{method="GET",status="200"}is the metric name stored for that metric ID).Deleted metric ID – This is not really a mapping. It is a marker for deleted metric IDs. For example,
4 152(4is the prefix, and152is the deleted metric ID). Deleting time series is resource-intensive, so it is best to avoid doing it too often.Date to metric ID (Per-day index) – This maps a specific date to metric IDs, so vmstorage can quickly check whether a metric exists on that date. For example,
5 2024-01-01 152(5is the prefix,2024-01-01is the date, and152is the metric ID that exists on that date).Date with tag to metric IDs (Per-day index) – This is similar to the first mapping, but it is scoped to a specific date for faster lookups. For example,
6 2024-01-01 method=GET 152,156,201(6is the prefix,2024-01-01is the date,method=GETis the tag, and152,156,201are the metric IDs where this tag appears on that date).Date with metric name to TSID (Per-day index) – This looks up the
TSIDfor a specific metric on a specific date. For example,7 2024-01-01 http_request_total{method="GET",status="200"} TSID{metricID=49,...}(7is the prefix,2024-01-01is the date,http_request_total{method="GET",status="200"}is the metric name, andTSID{metricID=49,...}is the mapped TSID).
You do not need to memorize all of these prefixes. Just remember that they fall into two groups: global and per-day.
- A global index stores mappings without attaching them to a specific date, so vmstorage can resolve relationships that stay useful across a wider time range.
- A per-day index stores date-scoped mappings, so vmstorage can narrow the search to the exact days involved in a query and avoid scanning unnecessary index entries.
In practice, vmstorage uses both together: global indexes give broad coverage, while per-day indexes give faster, more targeted lookups for time-bounded queries.
As we continue, these indexes will show up naturally in the ingestion and query flows, and their roles will become much clearer.
There is also a prefix 0 for the global metric name -> TSID mapping. But in the default setup, vmstorage normally uses the per-day date + metric name -> TSID mapping instead. The global version becomes the main path only when -disablePerDayIndex is enabled, so the 7 prefixes above are the ones you will usually care about.
Part Data of IndexDB on Disk
#
IndexDB is organized in a similar way to the main storage, but it stores different kinds of data. Main storage keeps sample values and timestamps, while IndexDB keeps index entries (items) together with helper data in lens so it can find those entries quickly.
Here’s a quick look at how it’s organized on disk:
/path/to/vmstorage-data/data/indexdb/
├── 2026_01/                          # Partition IndexDB (YYYY_MM)
│   ├── parts.json                    # List of IndexDB parts for this partition
│   ├── 183A9F12C4D8E001/             # IndexDB part directory
│   │   ├── metadata.json             # Part metadata
│   │   ├── items.bin                 # Index rows payload
│   │   ├── lens.bin                  # Item lengths/offset helpers
│   │   ├── index.bin                 # Block headers
│   │   └── metaindex.bin             # Top-level lookup index
│   └── ...
├── 2026_02/
│   ├── parts.json
│   ├── 183B11AA09F7007C/
│   │   ├── metadata.json
│   │   ├── items.bin
│   │   ├── lens.bin
│   │   ├── index.bin
│   │   └── metaindex.bin
│   └── ...
└── 2026_03/
    └── ...
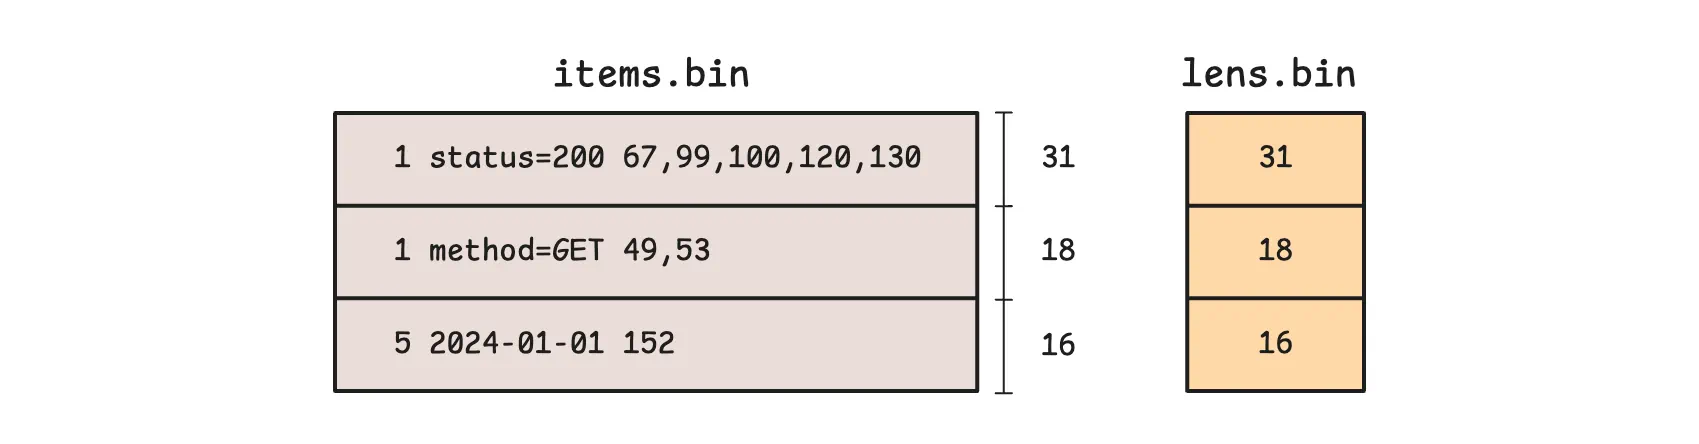
The items.bin file stores the actual index records we talked about, such as mappings from tags to metric IDs (for example, 1 status=200 67,99,100,120,130). Meanwhile, lens.bin stores compact length data for those records, so vmstorage can jump directly to the right byte range in items.bin instead of scanning from the beginning.
In simple terms, items.bin stores the content, and lens.bin helps vmstorage locate that content quickly.
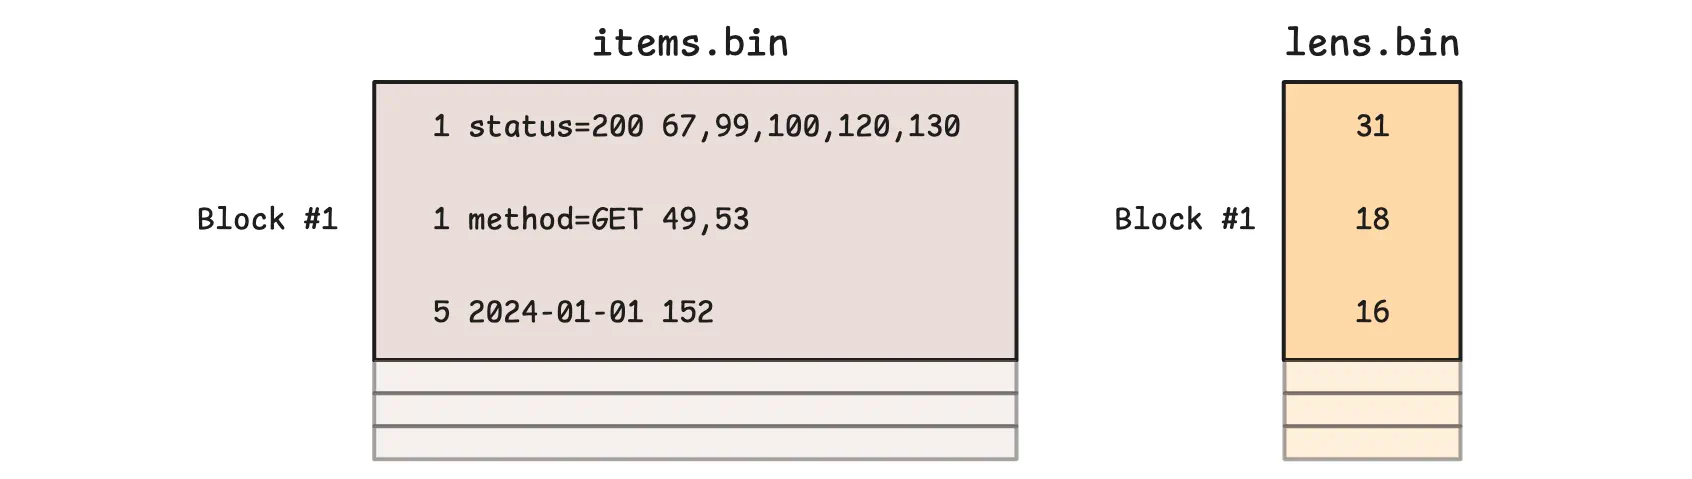
However, the example above is just a conceptual model to help explain the idea. In practice, items.bin and lens.bin are written block by block, and multiple consecutive logical items can end up in the same block:
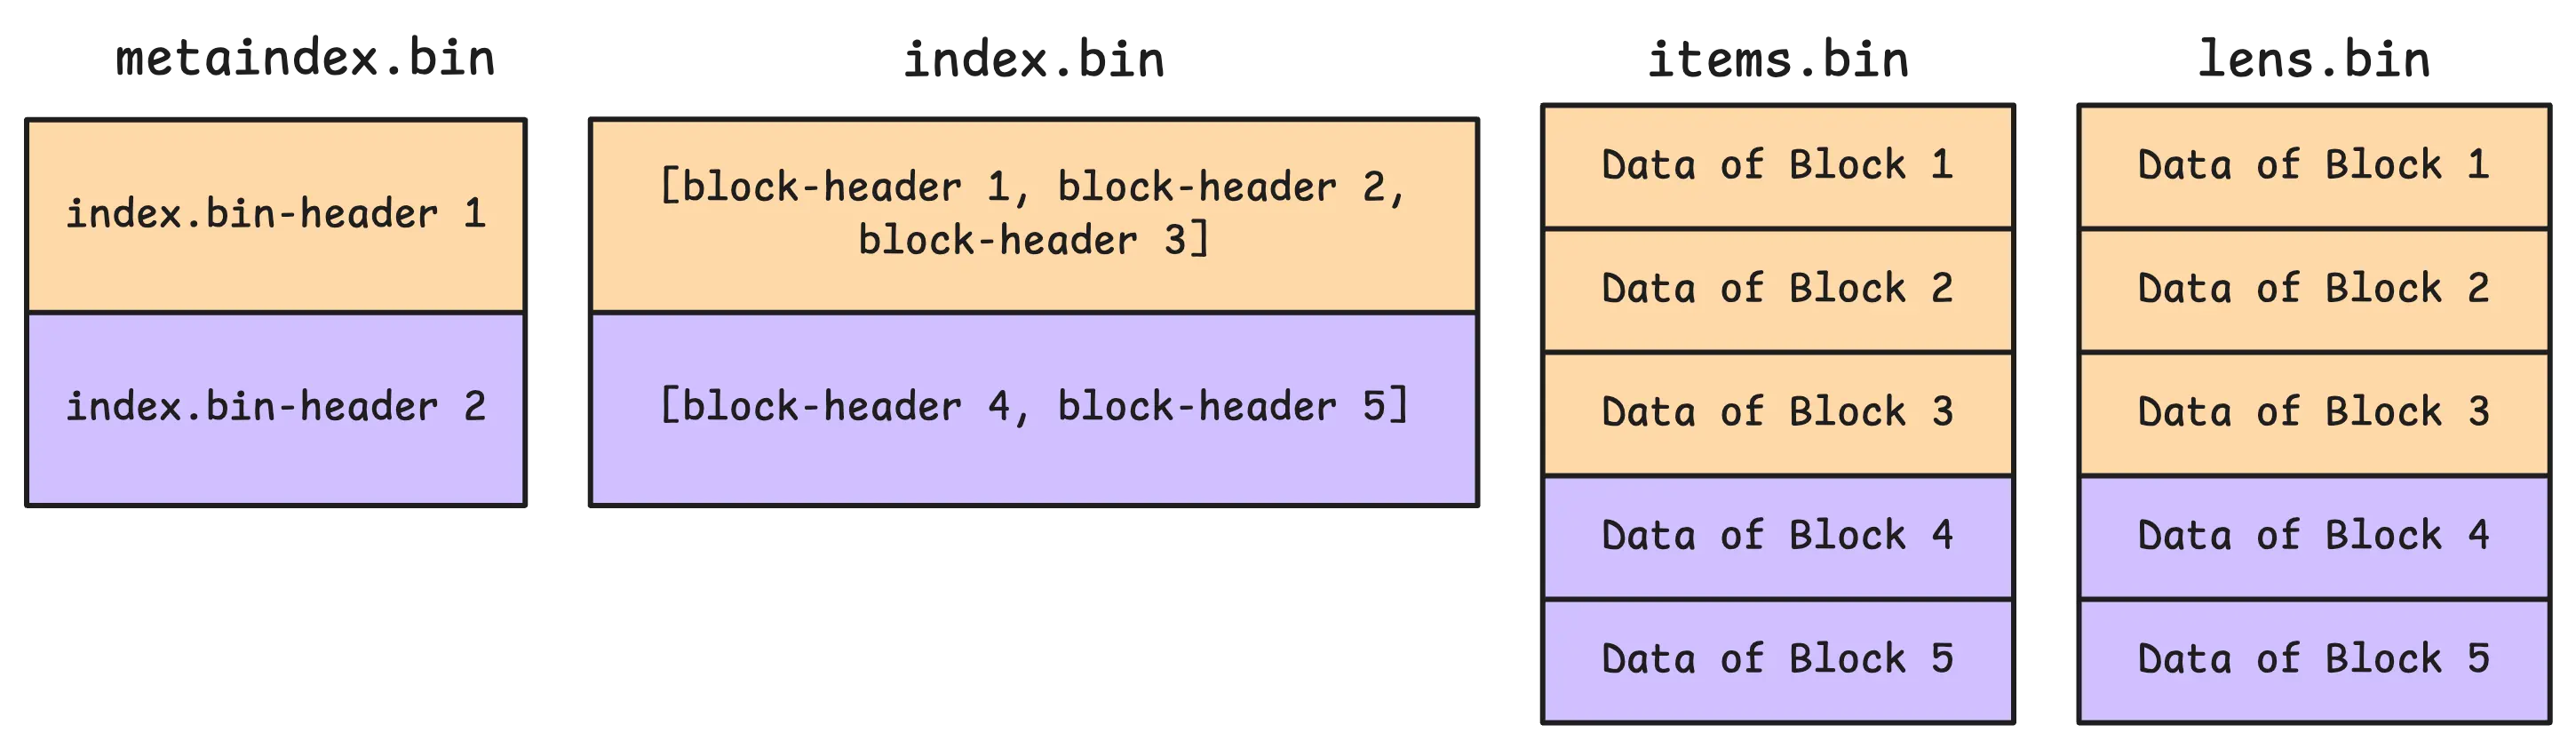
Block boundaries are tracked in index.bin. VictoriaMetrics uses it to locate blocks through another data structure called a block header. In practice, a section in index.bin can store multiple block headers at once:
These block headers store metadata about each block, such as the block’s starting position and size in items.bin and lens.bin. They also store the block’s shared prefix, which is the common prefix for all items in that block:
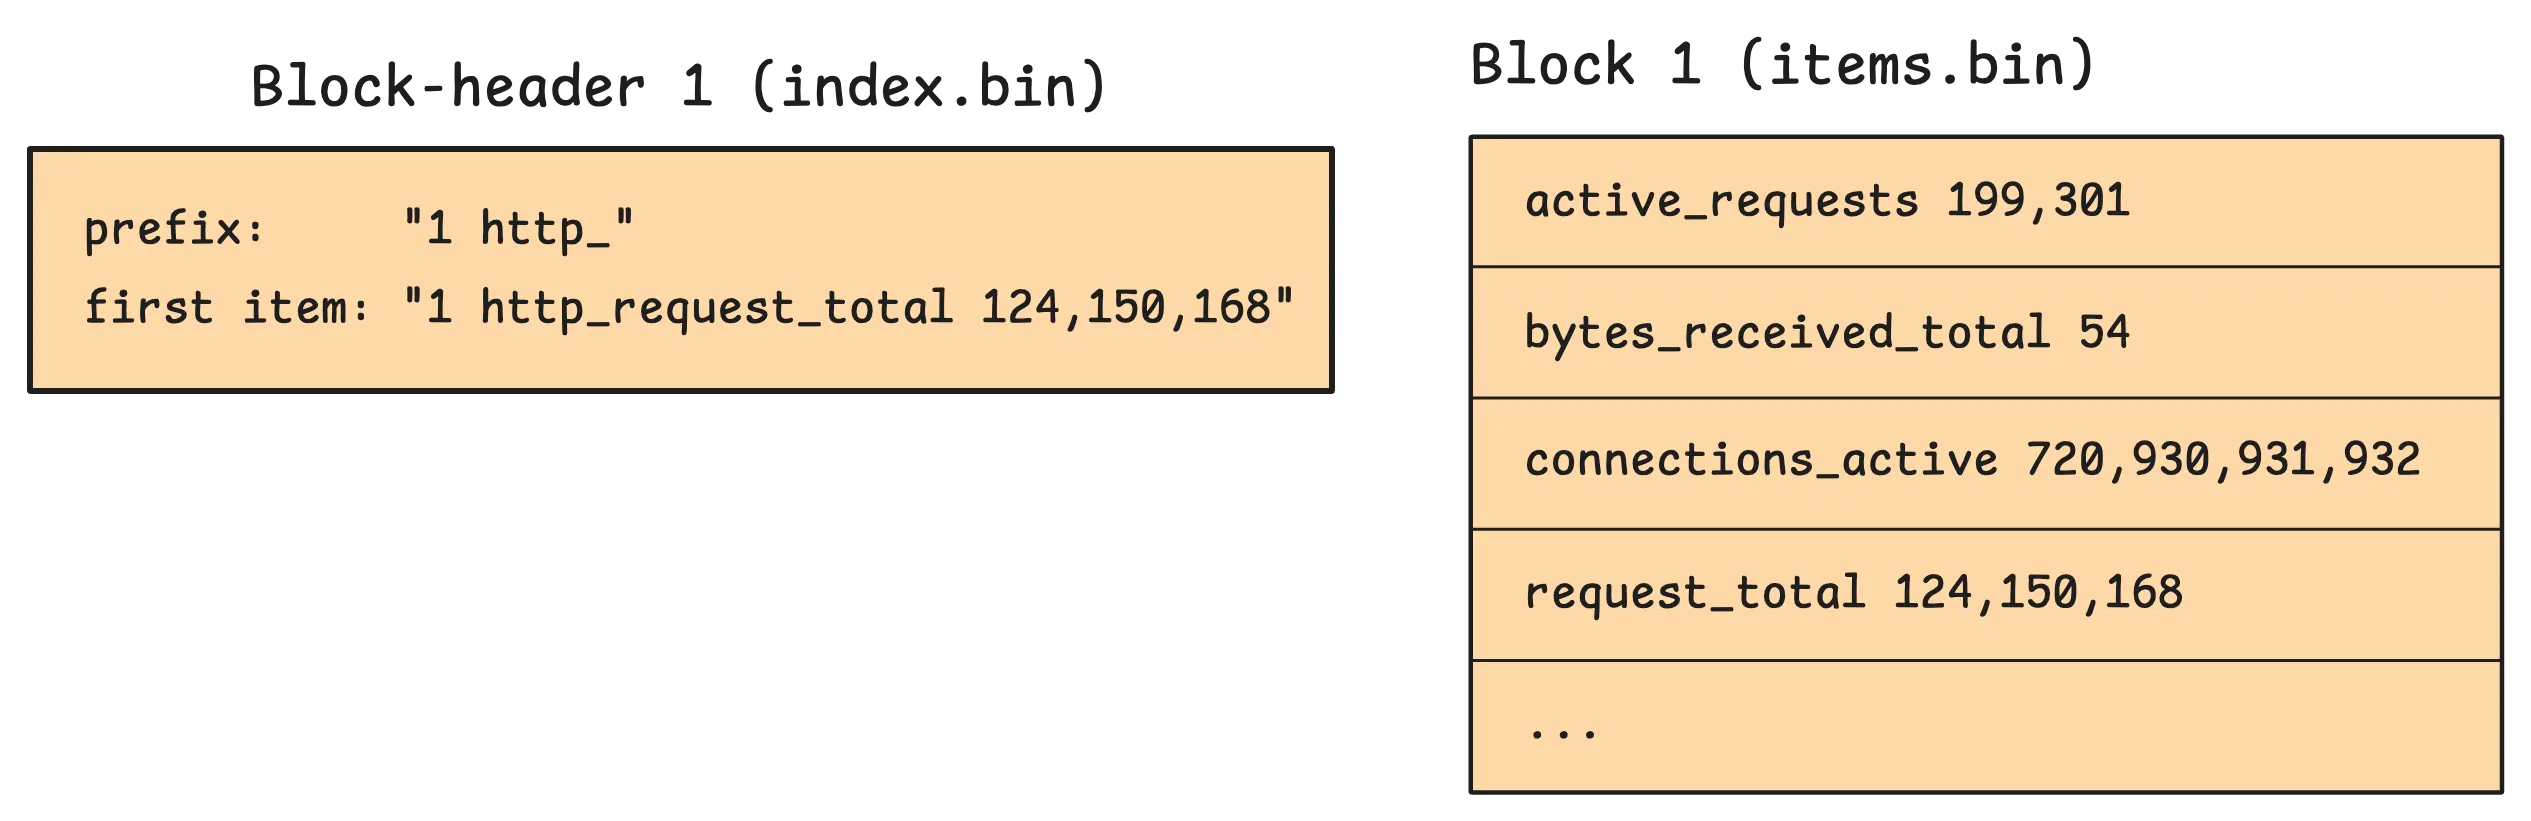
In this example, http_ is the common textual prefix shared by nearby sorted keys. Entries like active_requests 199,301 or connections_active 720,930,931,932 store only the remaining suffix and value parts. Once the reader combines them with the header context and the length metadata from lens.bin, they become full keys again (http_ + active_requests). This lets vmstorage save space by not repeating the same shared bytes in every row, while still seeking quickly because index.bin tells it exactly which block to read.
The first item (firstItem) is stored in the block header itself. The reason is simple: vmstorage can compare block ranges by looking at headers first and skip many blocks without touching the full payload bytes.
On the other hand, metaindex.bin is the top-level directory for the part. It stores lightweight entries that point to sections inside index.bin.
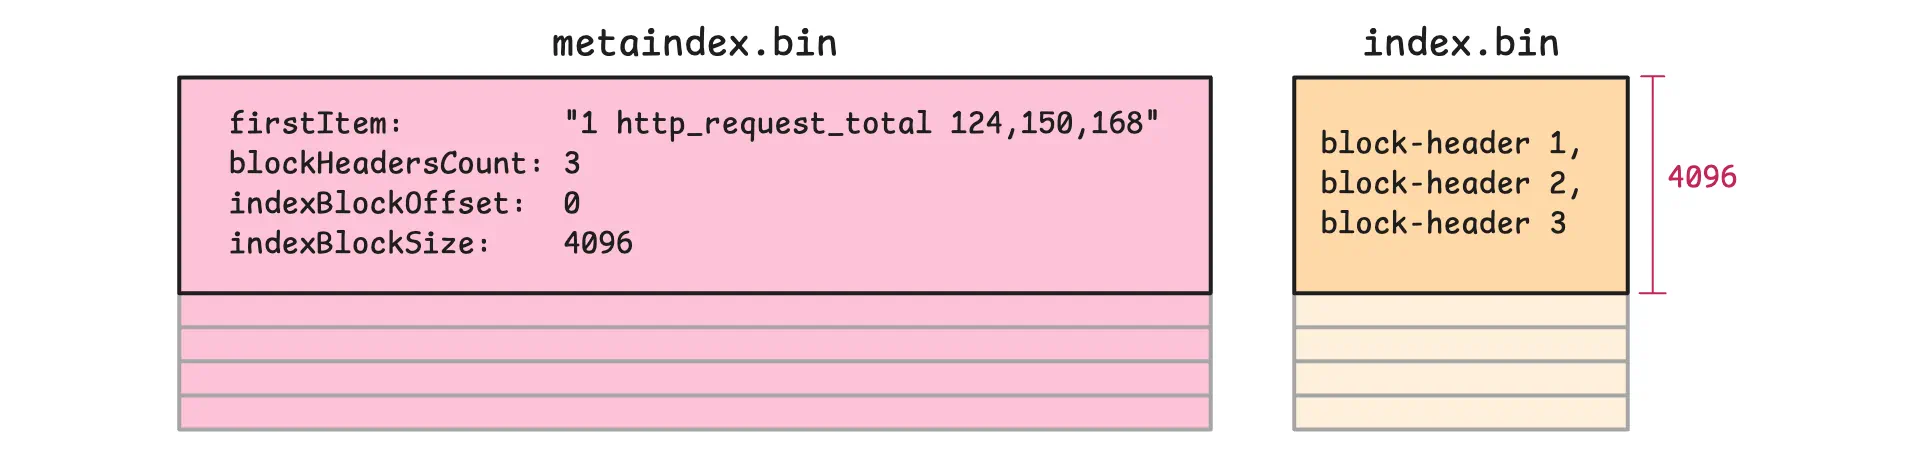
So when vmstorage searches for something like 1 status=200, it first uses metaindex.bin to jump to the relevant section of index.bin, then reads the matching block headers there, and only after that loads the needed block payloads from items.bin and lens.bin. This keeps searches fast because most blocks are skipped before the heavier data files are touched.
At startup, vmstorage goes through a few steps to get everything ready:
vmstoragestarts by readingparts.jsoninto memory. This tells it which parts belong to a given IndexDB.- It then opens each part. As part of that step, it reads
metadata.json, which contains details such as the number of items and blocks, plus the first and last items in the part. That information makes quick comparisons possible later. - During the same startup process, it opens the heavier files (
index.bin,items.bin,lens.bin) without loading all of their payloads into memory up front. - Finally, it loads every
metaindex.binfile into memory. These files are relatively small but very important: they helpvmstoragequickly find the right area inside the largerindex.binfiles.
How IndexDB Handles Data Ingestion
#
When data arrives at vmstorage, the first thing it does is check whether the metric already has a unique ID (TSID). It does this by looking in the TSID cache. This cache is size-bounded, and by default it uses about 37% of the allowed memory (-memory.allowed*).
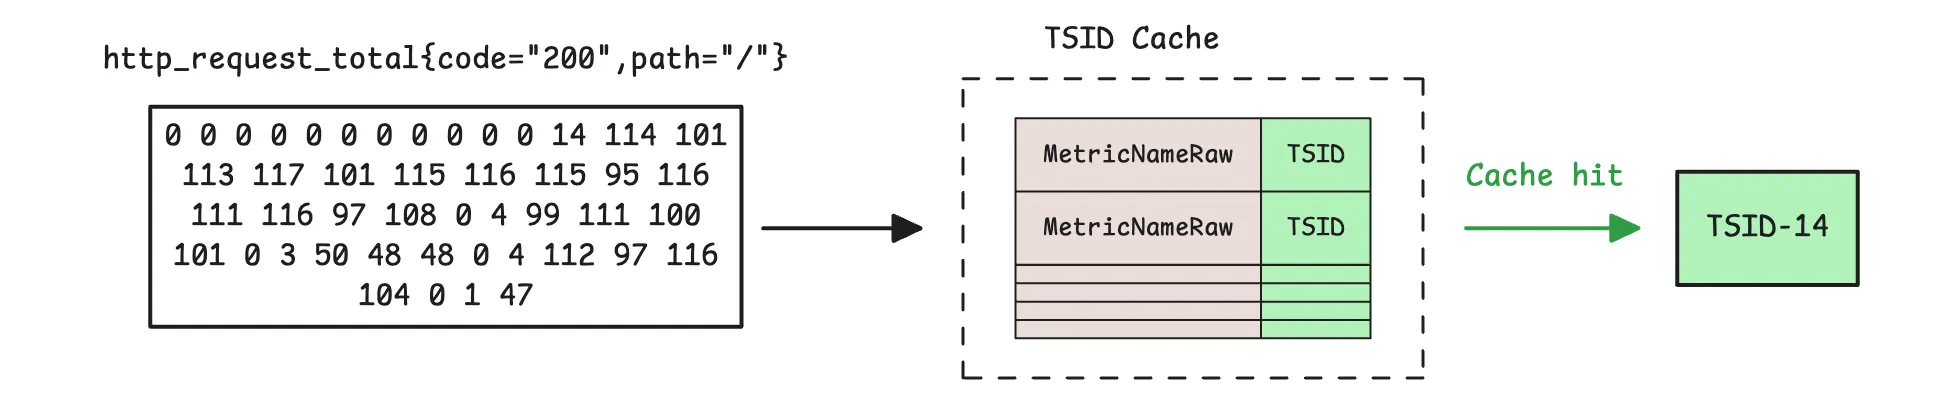
If vmstorage finds the metric name in the TSID cache, ingestion takes the fast path. On a cache miss, ingestion takes the slower path and looks up the TSID in the partition IndexDB that matches the sample timestamp:
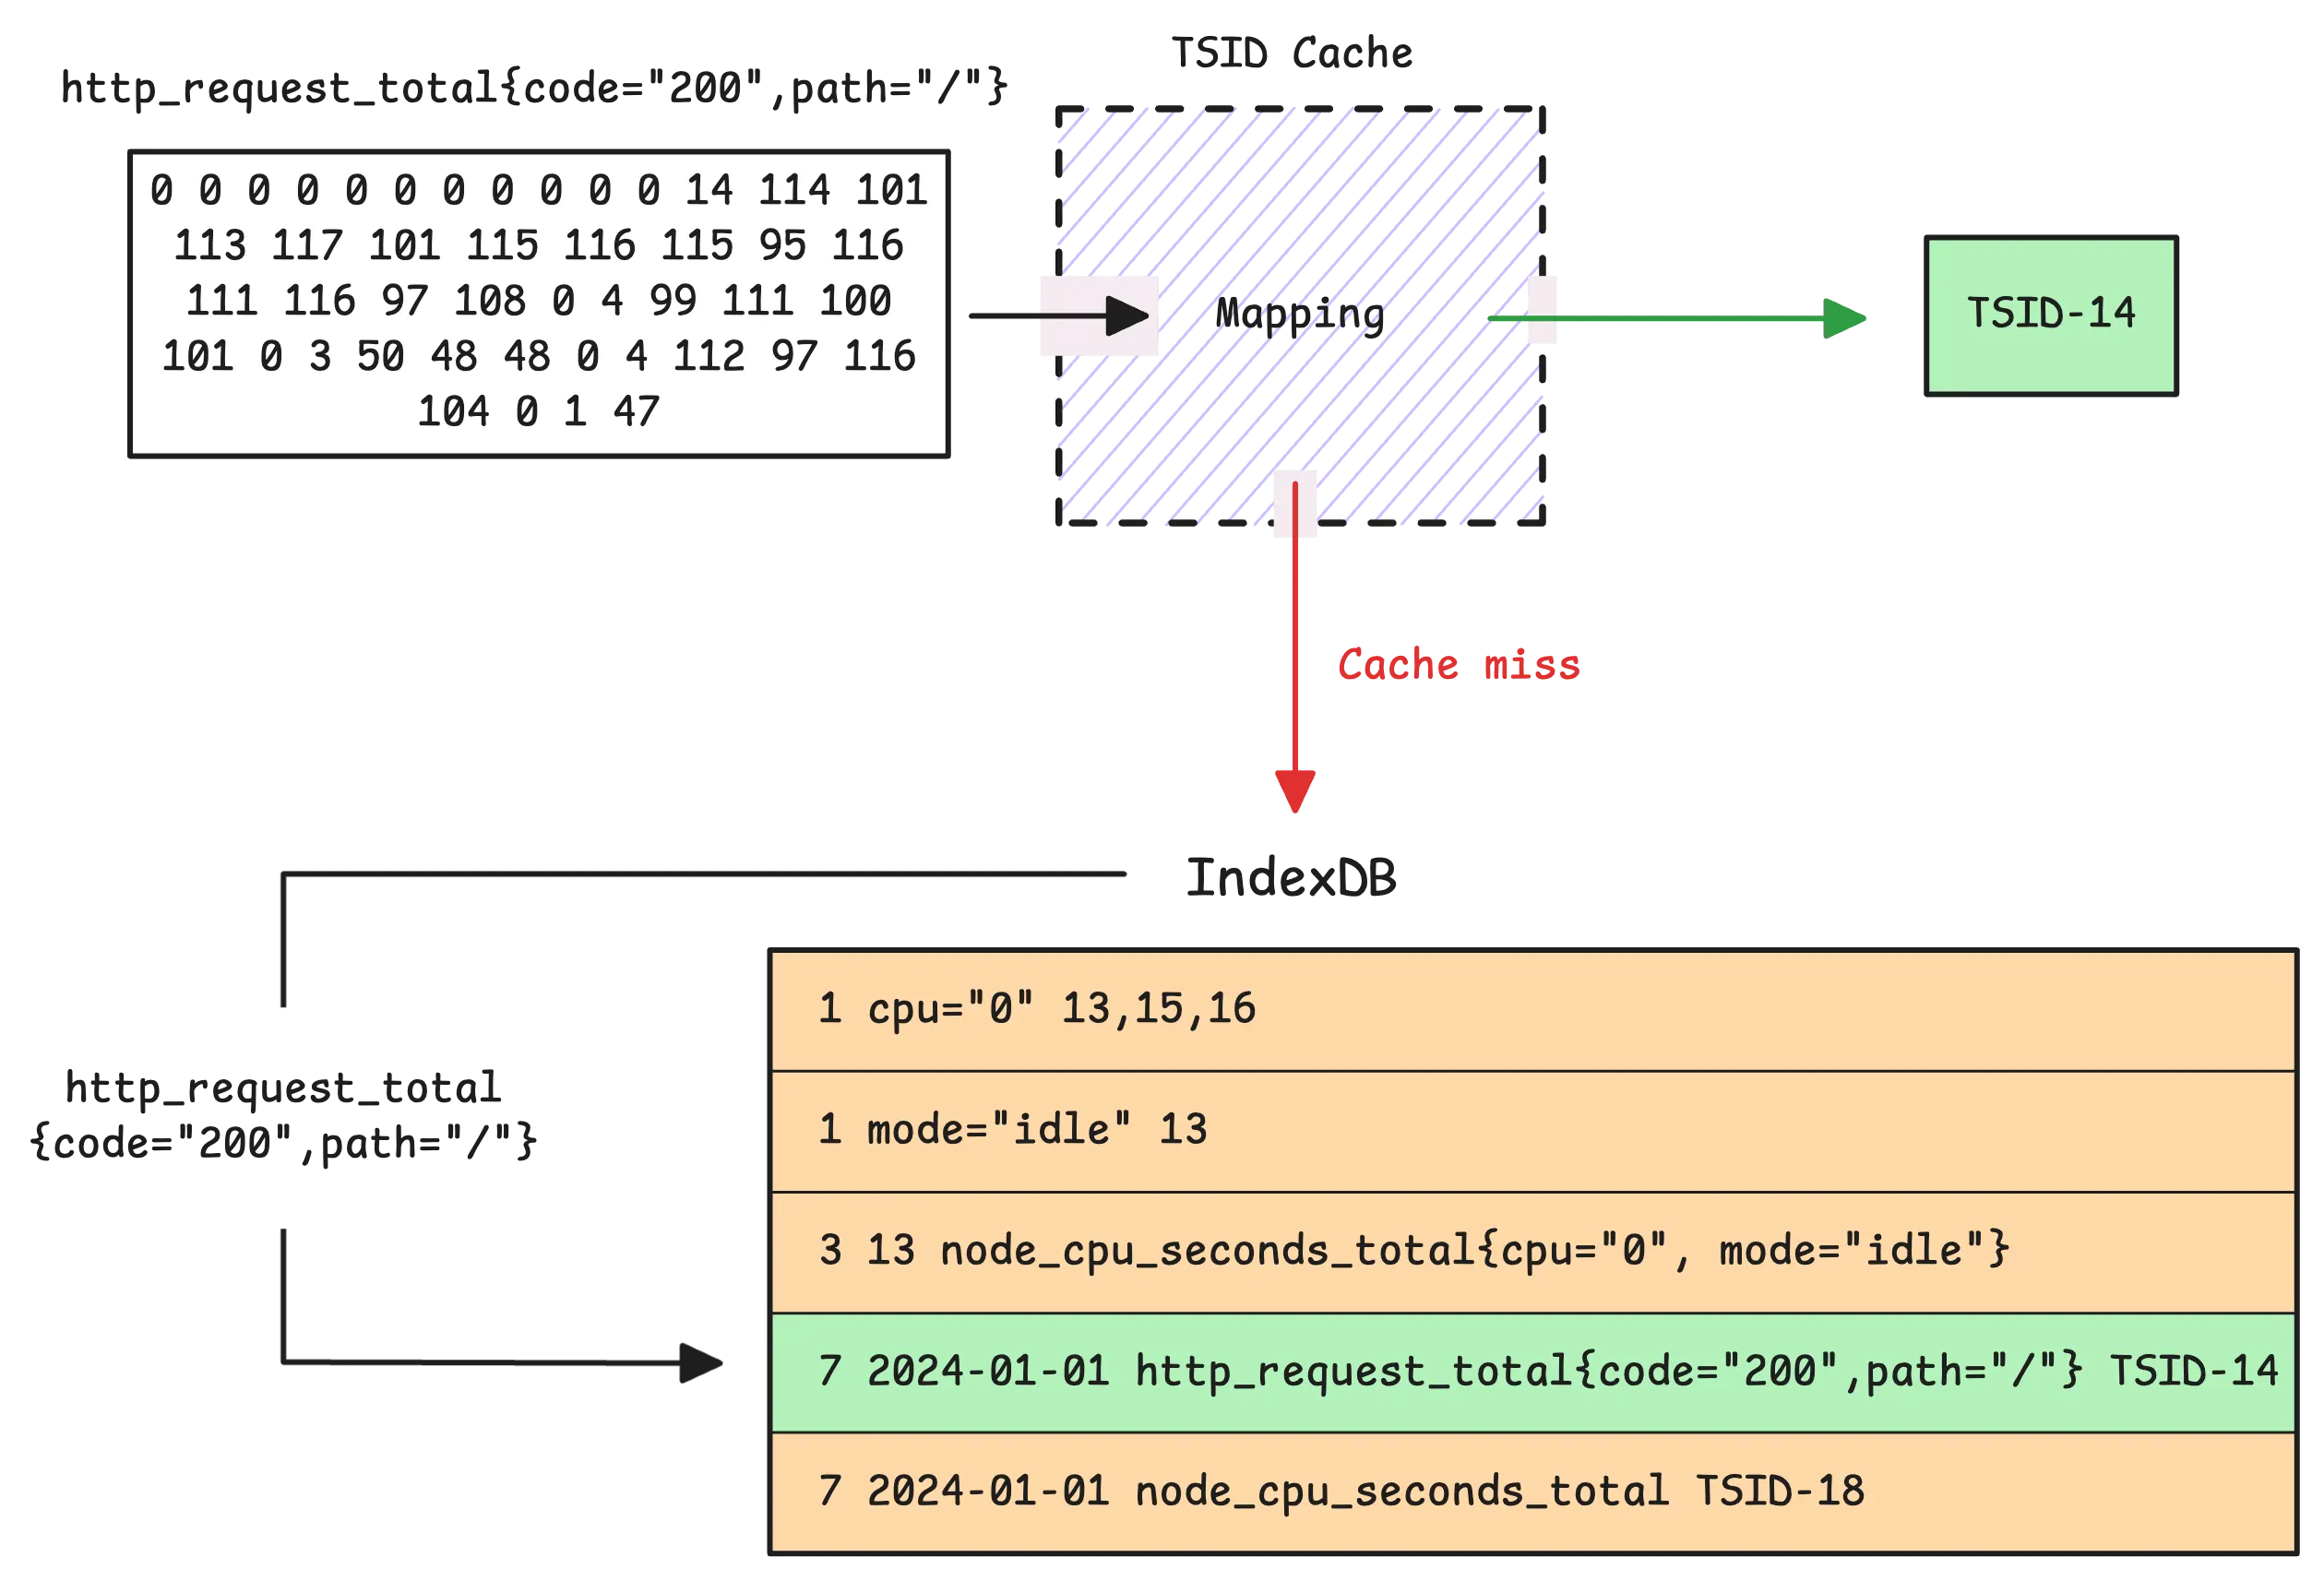
In the default setup, vmstorage uses the date + metric name -> TSID mapping for that date, which is the seventh mapping. If no TSID is found, vmstorage generates a new TSID and creates the required global and per-day index entries for that series in IndexDB.
Tip: Useful metrics
- Slow inserts (rows that go through the slow ingestion path):
vm_slow_row_inserts_total - New timeseries (rows not found in both TSID cache and IndexDB, so a new TSID is created):
vm_new_timeseries_created_total
Most mappings get one new entry per new time series. The main exception is the tag to metric ID index (the first mapping), because a single time series can produce multiple tag-based entries.
To explain this better, imagine we get a time series such as http_request_total{method="GET",status="200"} on January 1st, 2024. In this case, IndexDB creates 3 basic entries for the tag to metric IDs family:
- One entry for the metric name
http_request_total - One entry for
method - One entry for
status
However, each of these must appear in both the global tag to metric IDs index (the first mapping) and the per-day tag to metric IDs index (the sixth mapping). So that makes 6 entries in total.
Let’s see if our assumption is correct:
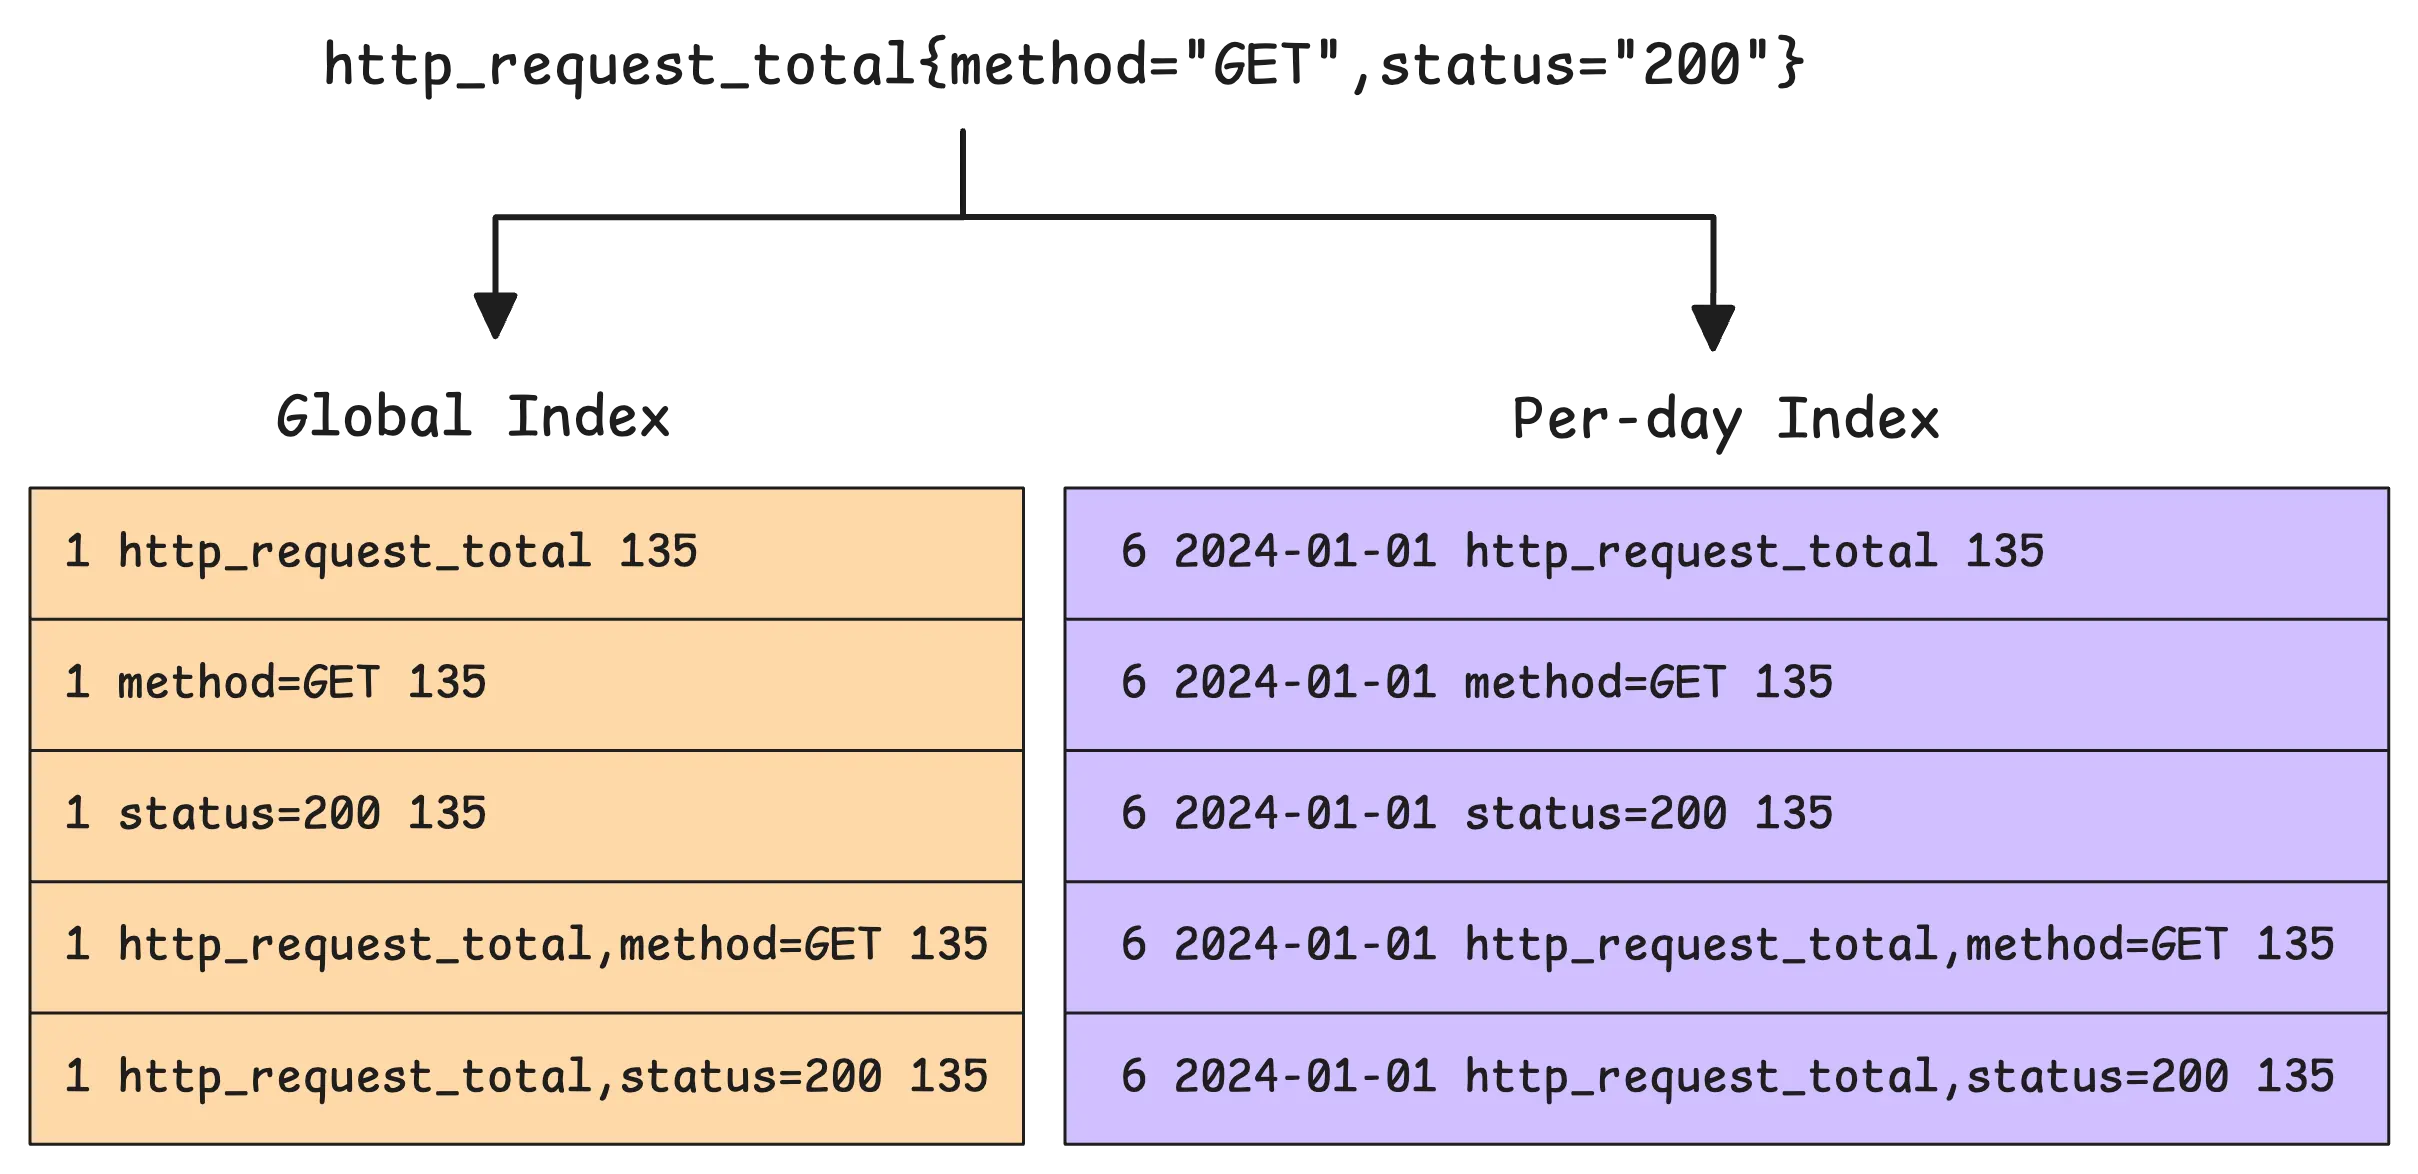
What we just discussed is correct, but it is still missing an important detail. The actual number of new rows added for the tag to metric ID indexes is not 6. It is 10. Why? Because of something called a composite index.
A composite index combines the metric name with a tag key. In this example, that adds two more entries: one for http_request_total + method and one for http_request_total + status. And because both of them are written to the global and per-day indexes, that adds 4 more rows on top of the original 6, giving us 10 in total.
This narrows the search space even further. vmstorage can still search using just the tag (for example, {method="GET"}), but when the metric name is also part of the query (for example, http_request_total{method="GET",status="200"}), the composite index gives it a much more selective path. It is designed to speed things up for common query patterns.
During ingestion, vmstorage also runs two warm-up mechanisms to reduce spikes:
- Before the next month boundary (controlled by
-storage.idbPrefillStart, default 1 hour), vmstorage gradually pre-fills the next partition’s IndexDB for active series. - During the last hour before a new day, vmstorage also gradually creates next-day per-day index entries to smooth out the load spike around midnight.
Tip: Useful metrics
- How many rows were added to IndexDB:
vm_indexdb_items_added_total - How many bytes those rows took up:
vm_indexdb_items_added_size_bytes_total - How many series were pre-created for upcoming index usage:
vm_timeseries_precreated_total
The Merge Process
#
IndexDB’s structure has a lot in common with the main storage in terms of flow: data is buffered in memory first, and then compacted into searchable parts on disk.
The entries we just talked about do not go straight to disk right away. Just like the main storage has a sharded in-memory buffer before flushing, IndexDB has its own sharded in-memory buffer.
In the current implementation, this buffer is split into shards. Each item in it is an encoded index entry that will later be grouped into in-memory blocks and flushed into parts.
So how many shards are there? The number depends on CPU cores, based on this formula:
shard_count = cpu_cores * min(16, cpu_cores)
In other words, the more CPU cores, the more shards. For example, if vmstorage has access to 4 CPU cores, it will create 16 shards. Each shard can hold up to 256 in-memory blocks. A block, in turn, is a small batch of index entries and can hold up to 64 KB of data.
When a shard fills up, its blocks are moved to an intermediate stage called “pending blocks”:
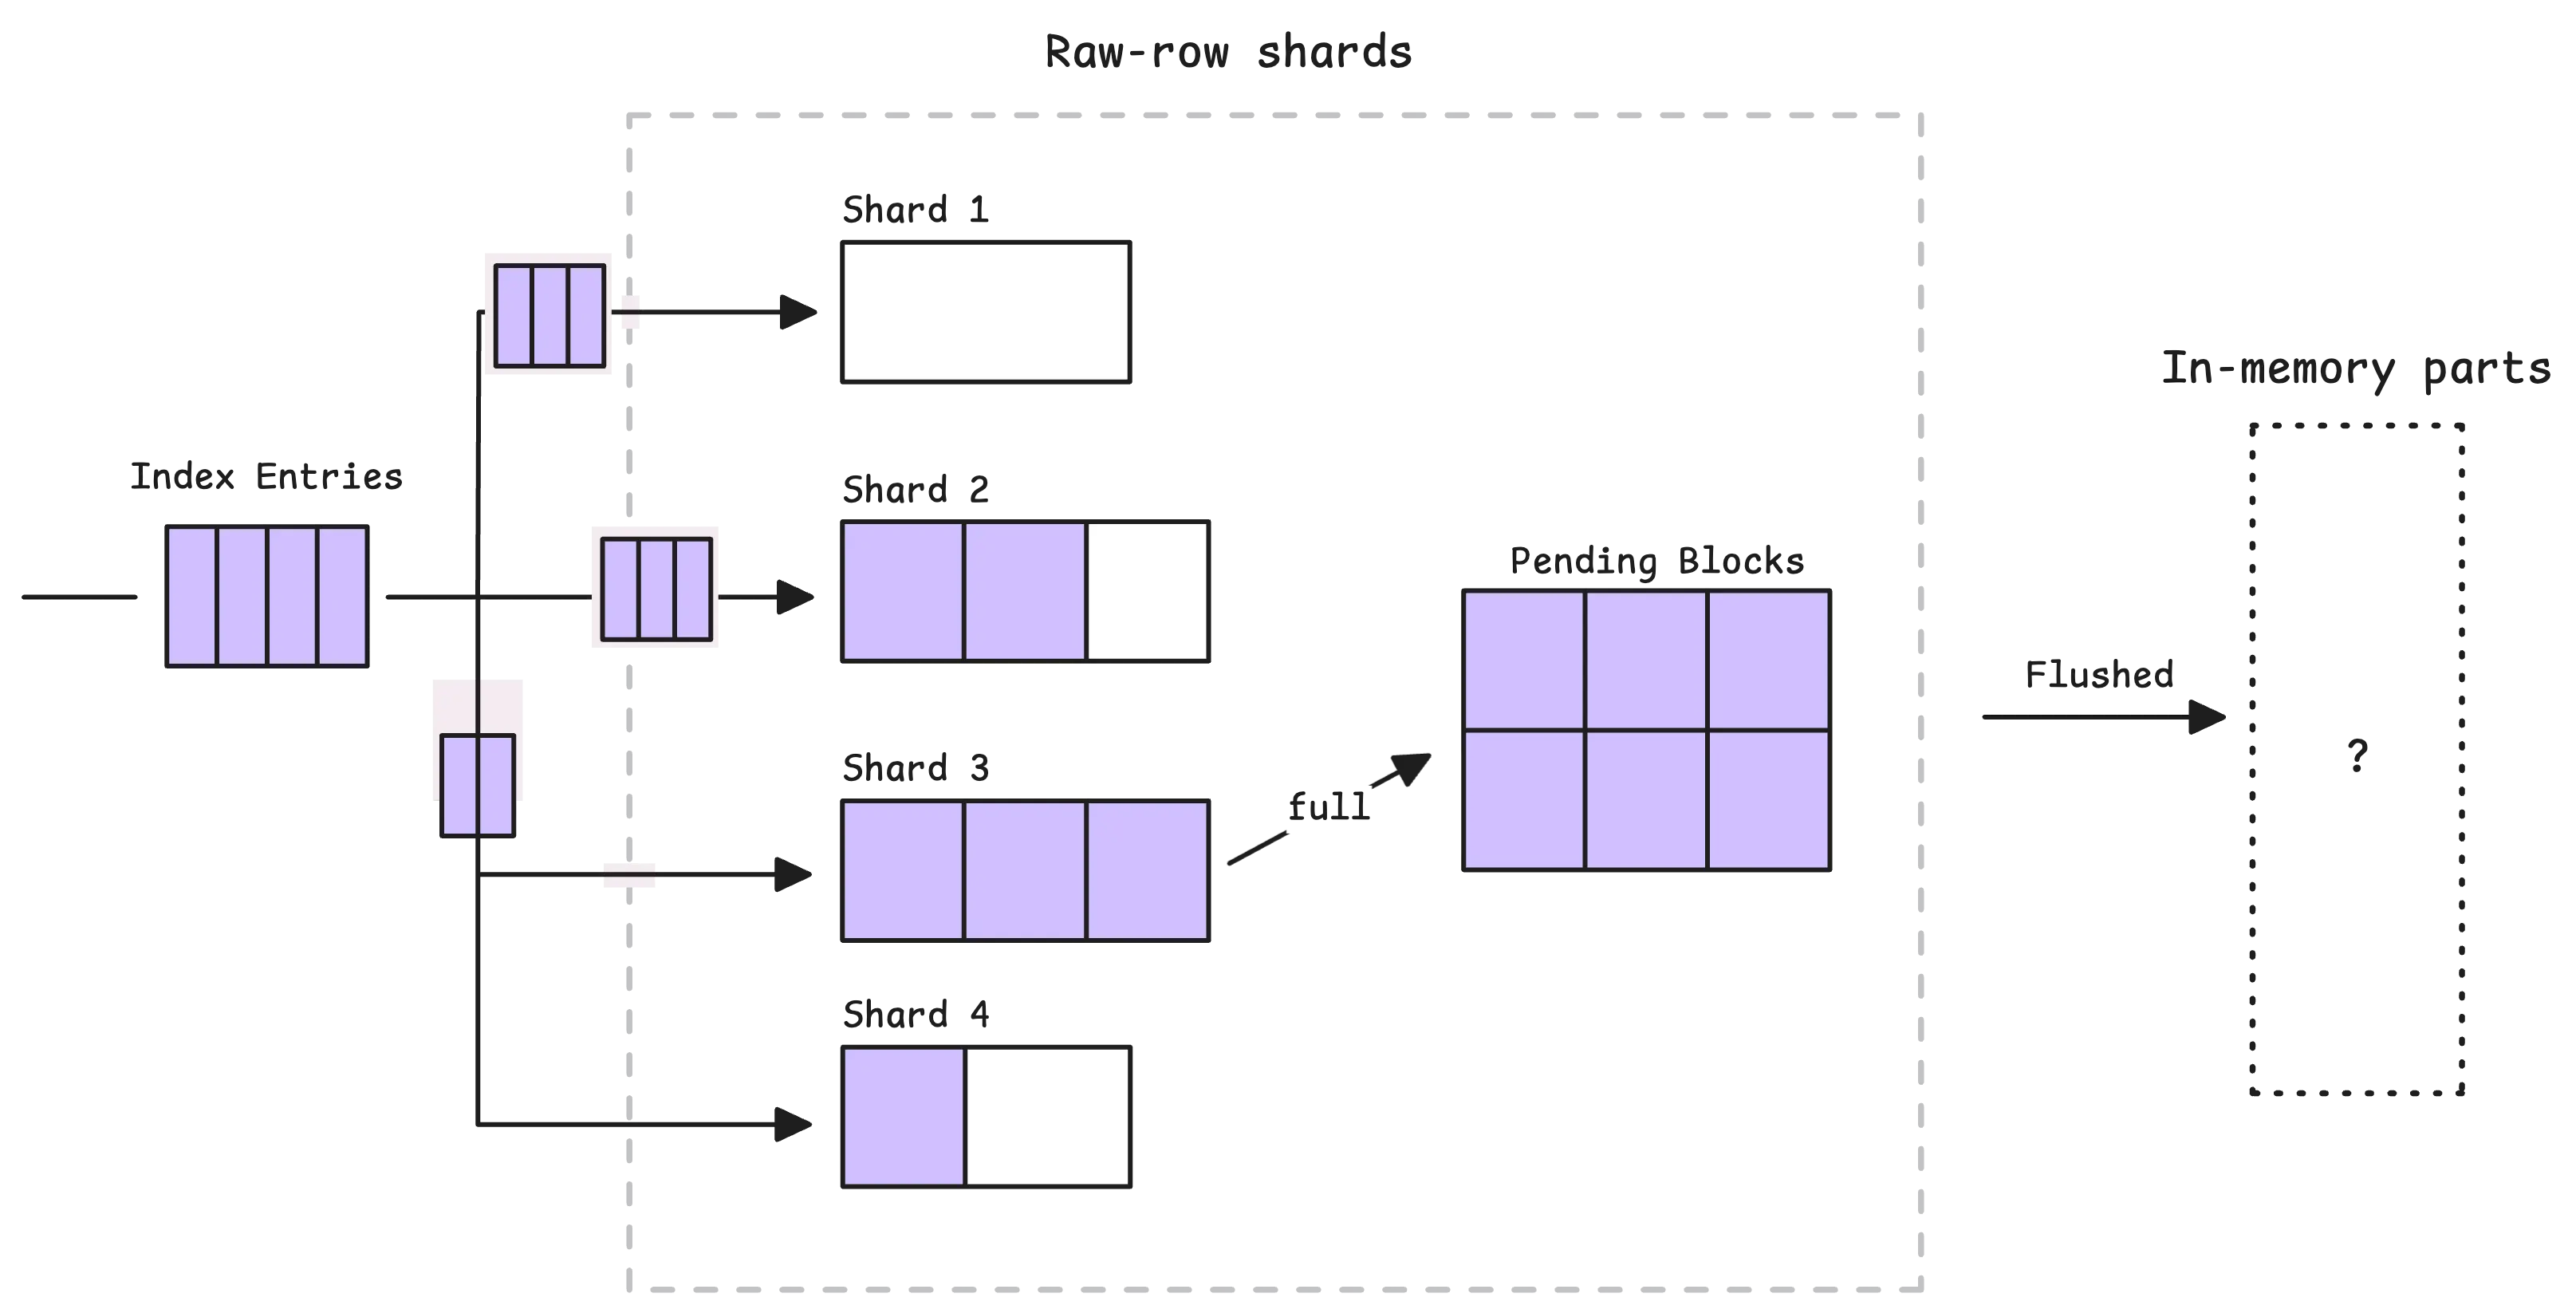
From there, pending blocks are flushed into in-memory parts in two situations: either periodically (every 1 second) or when too many blocks build up in memory.
The flush step does not write those blocks as-is:
- It takes the in-memory blocks selected for flushing
- It reads every item from them
- It merges and sorts those items by key
- It writes the merged, sorted result into a new in-memory part
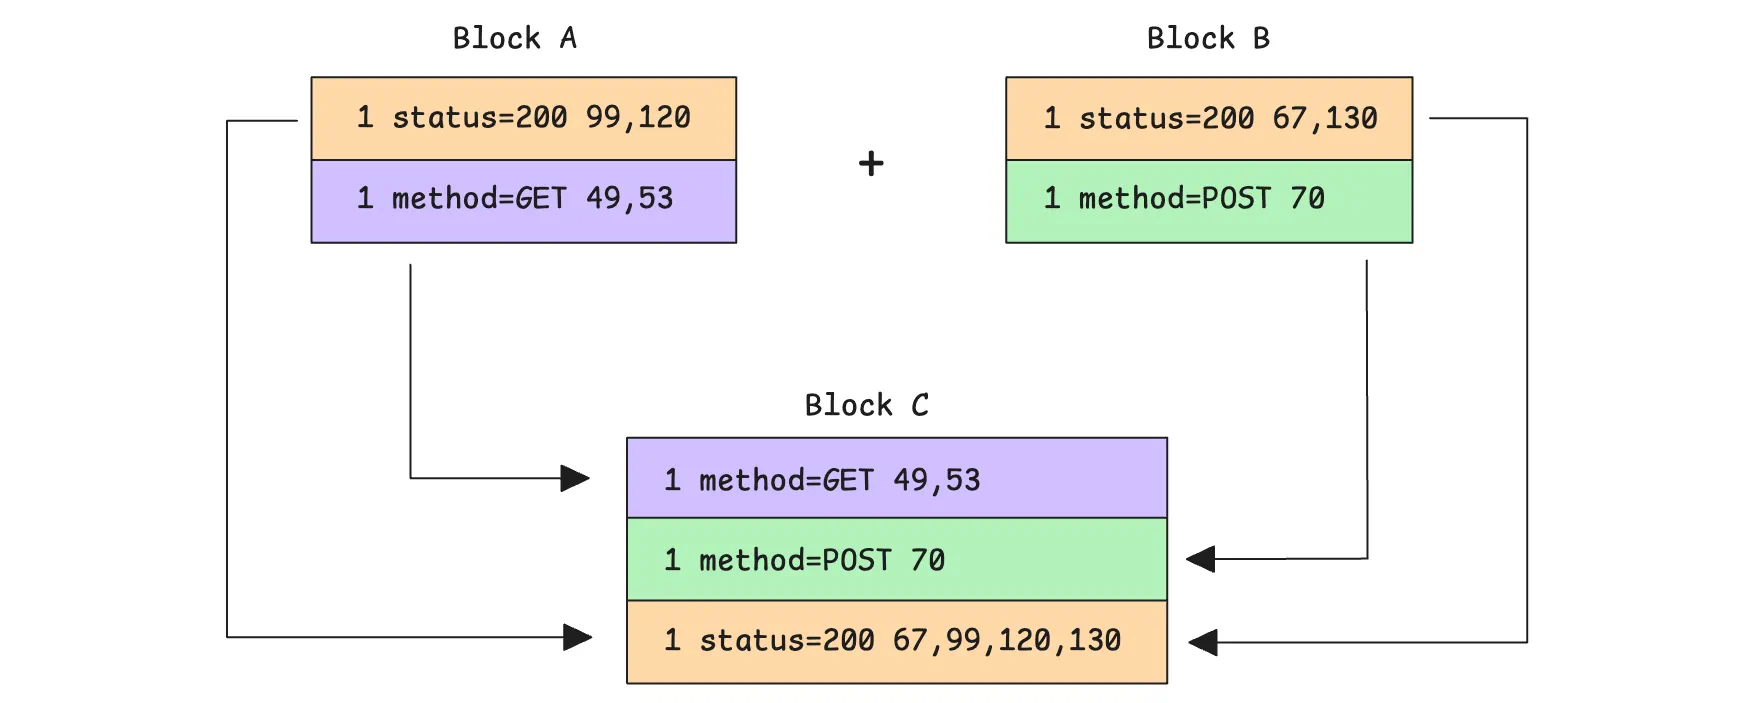
If there are multiple rows with the same tag -> metric IDs prefix (the 1st and 6th mappings), vmstorage also merges them at this stage. It combines their metric ID lists, sorts those IDs, and removes duplicates before writing the final rows.
Now, here’s the big question:
Question!
“Why can the per-day index be faster than the global index?”
With per-day indexing, searches are naturally split by date. When looking for a metric within a specific time range, vmstorage can search only the entries that match the relevant day or days. This greatly reduces the search space because it focuses only on metrics that were active on those dates.
For example, if you’re searching for http_request_total{status="200"} between 13:00 and 14:00 on 2024-01-01:
- The global index would need to scan every
1 status=200entry in the relevant IndexDB partition. Many of those entries could belong to other days in that partition, so they still would not apply to the one-hour window you are looking at. - With the per-day index, IndexDB starts with the date-scoped prefix
6 2024-01-01 status=200and quickly narrows the search to entries from January 1st, 2024. It does not waste time on rows from other days in the same partition.
That is why the per-day index is often faster for short, time-bounded searches. But it is not always faster. In current vmstorage, if the search range is too wide, or already covers the whole IndexDB range, vmstorage switches back to the global index instead.
The downside is that per-day indexes use significantly more disk space than the global index, and they can also increase memory usage because vmstorage must keep more index rows searchable.
For example, if the timeseries http_request_total{status="200"} appears every day, the per-day tag to metric IDs index will add 3 rows per day for it:
- one for the metric name
http_request_total - one for the tag
status="200" - one composite row that combines the metric name with the tag key
Over 7 days, that becomes 21 rows. Meanwhile, the global index needs only those same 3 rows once, no matter how many days the timeseries appears.
Finally, when it comes to merging small parts, merging big parts, and flushing data to disk, IndexDB follows almost the same flow as the main storage. So we’ll skip that here to avoid repeating ourselves.
Who We Are
#
We’re VictoriaMetrics, a team providing open-source, highly scalable, and cost-efficient solutions for monitoring, logging, and tracing, trusted by users worldwide to reduce their observability costs. Check out our VictoriaMetrics, VictoriaLogs, and VictoriaTraces for more details.
Leave a comment below or Contact Us if you have any questions!
comments powered by Disqus