- Blog /
- How vmstorage's IndexDB Works
How vmstorage's IndexDB Works
Share:


This piece is part of our ongoing VictoriaMetrics series, where we break down how different components of the system function:
- How VictoriaMetrics Agent (vmagent) Works
- How vmstorage Handles Data Ingestion
- How vmstorage Processes Data: Retention, Merging, Deduplication,…
- When Metrics Meet vminsert: A Data-Delivery Story
- How vmstorage’s IndexDB Works? (We’re here)
- How vmstorage Handles Query Requests From vmselect
- Inside vmselect: The Query Processing Engine of VictoriaMetrics
Important
This discussion assumes you’ve checked out the earlier articles, which cover how vmstorage handles data ingestion and what goes on when it processes data.
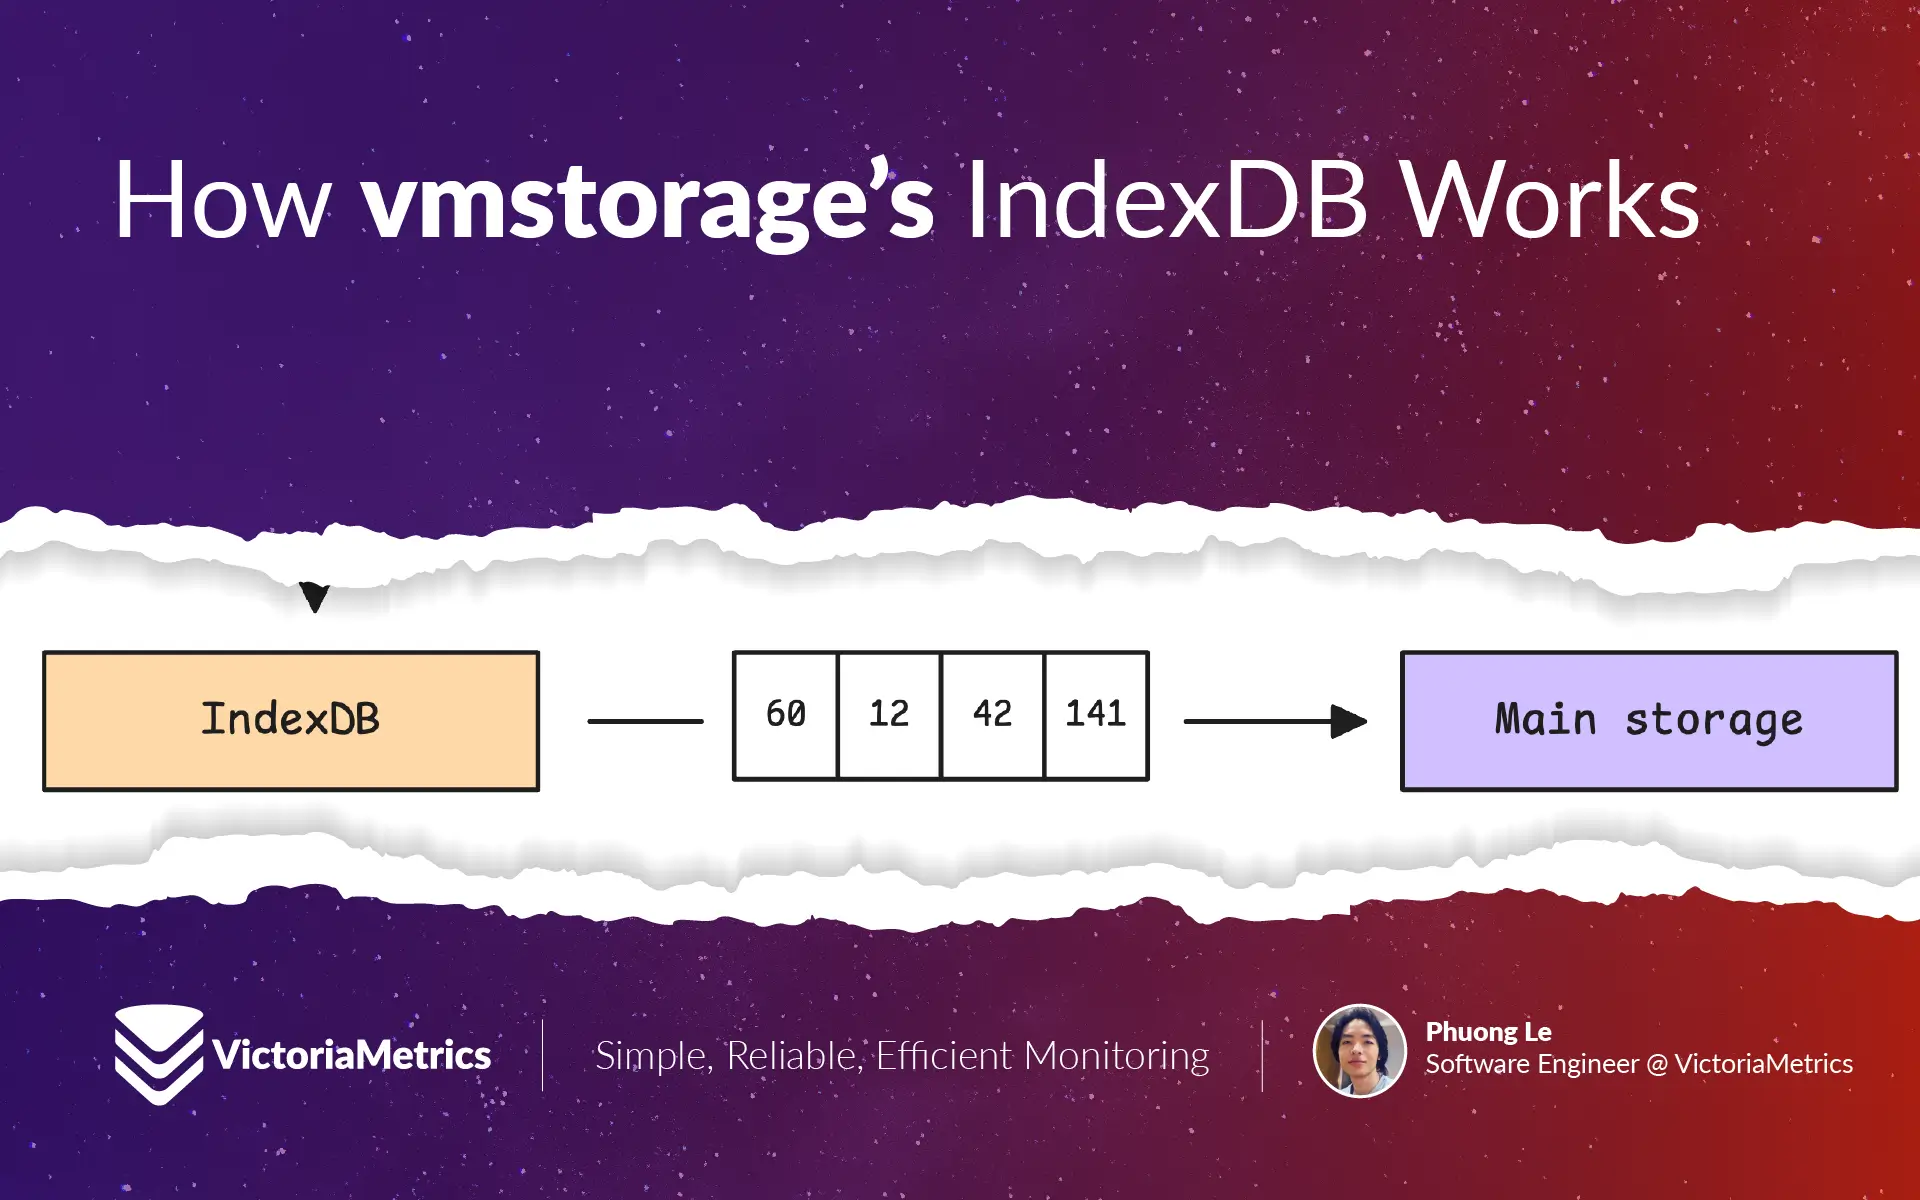
vmstorage doesn’t store the timeseries (e.g. node_cpu_seconds_total{mode="idle"}) directly into its main storage. Instead, it stores TSIDs (unique identifiers for each timeseries), along with the actual values and timestamps.
So, how does vmstorage know which TSID belongs to which metric? That’s where IndexDB steps in — it’s the database that keeps track of the relationship between timeseries and their TSIDs.
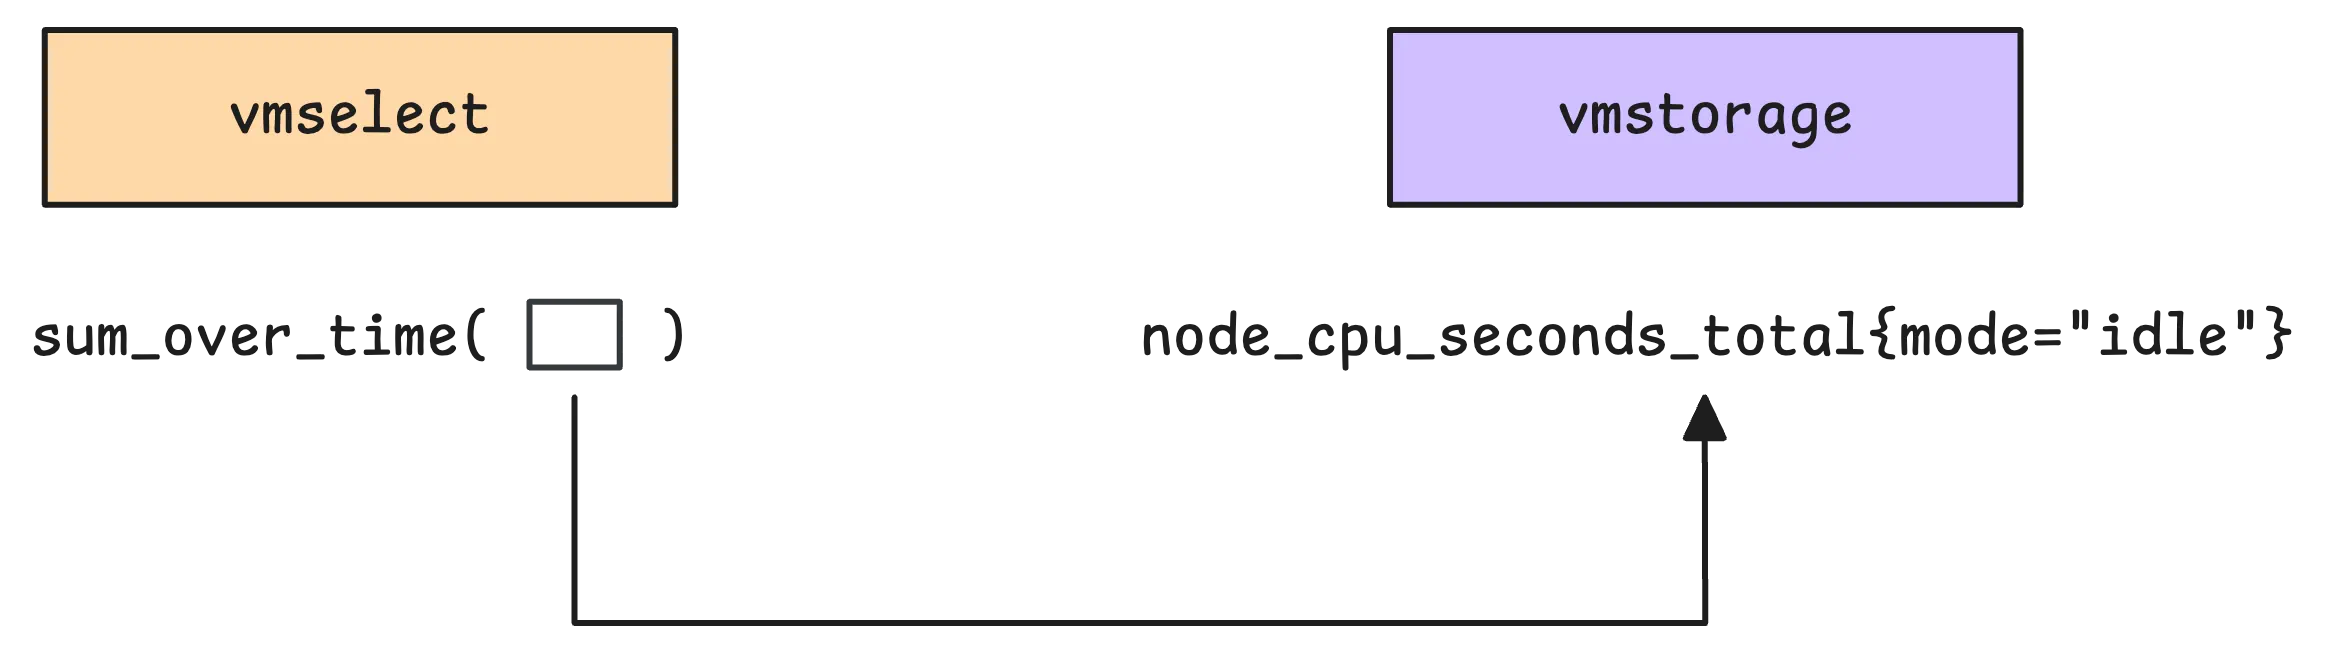
For example, when you make a query — whether you’re using PromQL or the enhanced MetricsQL, such as sum_over_time(node_cpu_seconds_total{mode="idle"}[5m]), vmstorage focuses on two things: the metric you’re asking for, node_cpu_seconds_total{mode="idle"}, and the time range.
The aggregation function sum_over_time is actually handled by vmselect once it gets the samples from vmstorage.
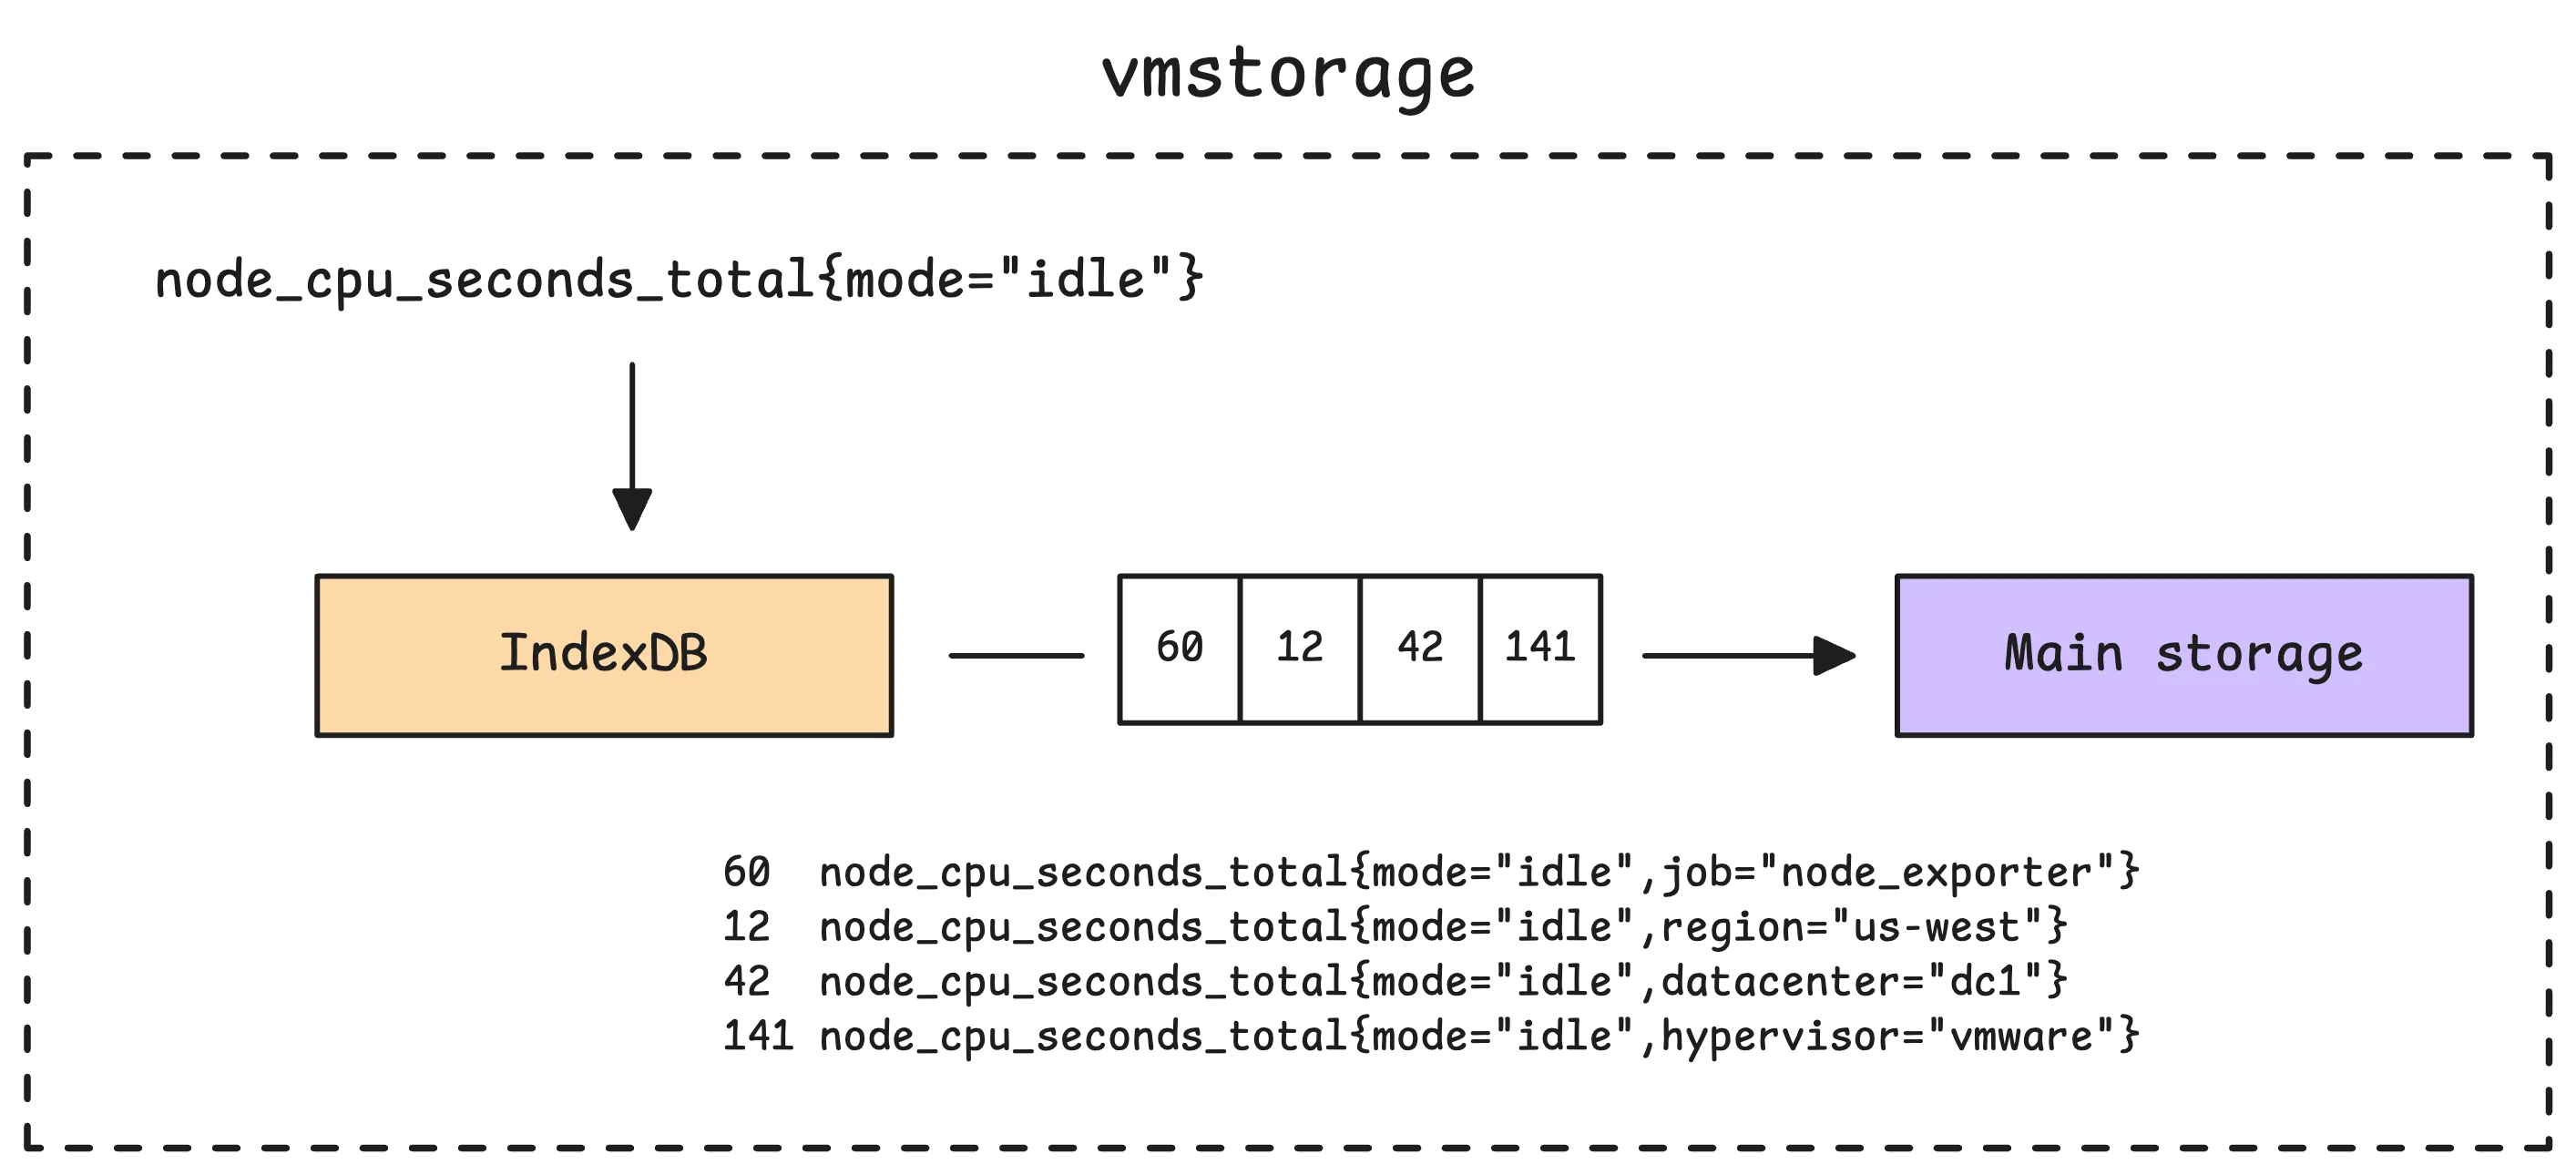
So, what’s the main job of IndexDB?
Simply put, it translates your human-readable metric names, like node_cpu_seconds_total{mode="idle"}, into unique numeric IDs — these are the TSIDs.
Note
TSID (Timeseries ID) is technically a wrapper for a metric ID, with a few extras like account ID or project ID. The metric ID itself is a big, unique number that identifies each timeseries. From the user’s perspective, though, there’s not much difference between TSIDs and metric IDs.
Once the TSIDs are sorted out, vmstorage uses them to dig into its main storage and pull out the actual metric data. Basically, this storage is just a collection of blocks organized by TSID. After retrieving those blocks, vmstorage sends them over to vmselect for further processing.
Now, here’s something we haven’t touched on yet: how exactly does IndexDB deal with new metrics when they’re added to vmstorage? And how does vmstorage handle requests from vmselect? That’s what we’ll cover in this discussion.
How IndexDB is Structured
#
vmstorage uses a three-stage IndexDB setup, which includes the next IndexDB, current IndexDB, and previous IndexDB. These indexes rotate periodically based on the retention period.
- The current IndexDB holds the active index data. Any new timeseries data gets added here.
- The previous IndexDB stores older data that’s still within the retention period, so it’s still available for queries.
- The next IndexDB is essentially a placeholder, set up ahead of time to take over as the current IndexDB during the next rotation.
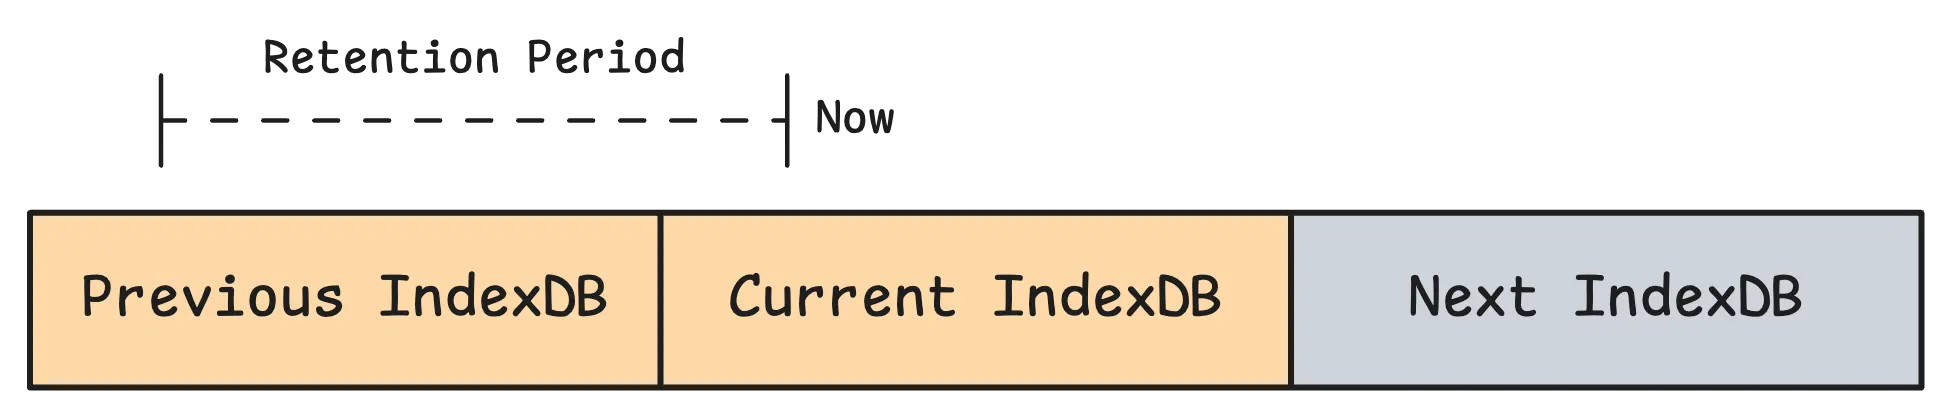
The rotation happens once the retention period hits its deadline (with a small offset for buffer).
Let’s take an example. If you’ve got a 365-day retention period starting on 2023-01-01, the rotation would trigger on 2023-12-31T04:00:00Z. During this process, the next IndexDB takes over as the current IndexDB, the old current IndexDB becomes the previous IndexDB, and the old previous IndexDB is marked for deletion.
If the retention period is updated, the system recalculates the rotation schedule based on the new setting.
Warning: Be cautious when updating the retention policy.
There is a known issue #7609: Changing -retentionPeriod may cause earlier deletion of previous indexDB.
Each row in the IndexDB comes with a numeric prefix (e.g. 1, 2, 3, etc.). This prefix determines what the mapping of that row is supposed to represent. Right now, there are 7 prefixes (or indexes) in play:
- Tag to metric IDs (Global index) – This maps a specific tag to metric IDs. For example,
1 method=GET 49,53or1 status=200 67,99,100,120,130. It’s one of the main mappings used to locate metric IDs. - Metric ID to TSID (Global index) – After finding the metric IDs from the first mapping, this one links each metric ID to its TSID. Example:
2 49 TSID{metricID=49,...}. - Metric ID to metric name (Global index) – This connects a unique metric ID to the actual timeseries we’ve stored. Example:
3 http_request_total{method="GET",status="200"}. - Deleted metric ID – Not really a mapping, but more of a tracker for deleted metric IDs. Example:
4 152. It’s worth noting that deleting timeseries is resource-intensive, so it’s best to minimize how often this happens. - Date to metric ID (Per-day index) – This maps a specific date to a metric ID, helping quickly determine if the metric exists on that date. Example:
5 2024-01-01 152,5 2024-01-01 153. - Date with tag to metric IDs (Per-day index) – Similar to the first mapping, but scoped to a specific date for faster lookups. Example:
6 2024-01-01 method=GET 152,156,201. - Date with metric name to TSID (Per-day index) – This one looks up the TSID of a specific metric on a specific date. Example:
7 2024-01-01 http_request_total{method="GET",status="200"} TSID{metricID=49,...}.
You don’t need to commit all of these to memory. As we keep going, they’ll pop up when needed, and you’ll see how they work in practice.
IndexDB on Disk
#
IndexDB follows a structure that’s similar to the main storage, but the internal data it stores is a bit different. Instead of things like values and timestamps, it works with items, and lengths.
Here’s a quick look at how it’s organized on disk:
/path/to/indexdb/
├── 181B3F97816592AA/       # Previous indexdb (16 hex digits)
│   ├── parts.json          # List of all parts
│   ├── 181B3F9782297961/   # Part directory (random numbers)
│   │   ├── metadata.json   # Part's metadata
│   │   ├── items.bin
│   │   ├── lens.bin
│   │   ├── index.bin
│   │   └── metaindex.bin
│   ├── 181D447DFCF1147A/   # Another part
│   │   └── (same structure as above)
│   └── ...                 # More parts
│
├── 181B3F97816592AB/       # Current indexdb
│   └── (same structure as prev)
│
└── 181B3F97816592AC/       # Next indexdb
    └── (same structure as prev)
The items.bin file stores the entries we talked about earlier (e.g., 1 method=GET 49,53 or 2 status=200 67,99,100,120,130). The lens.bin file helps locate the start and end of each item in items.bin.
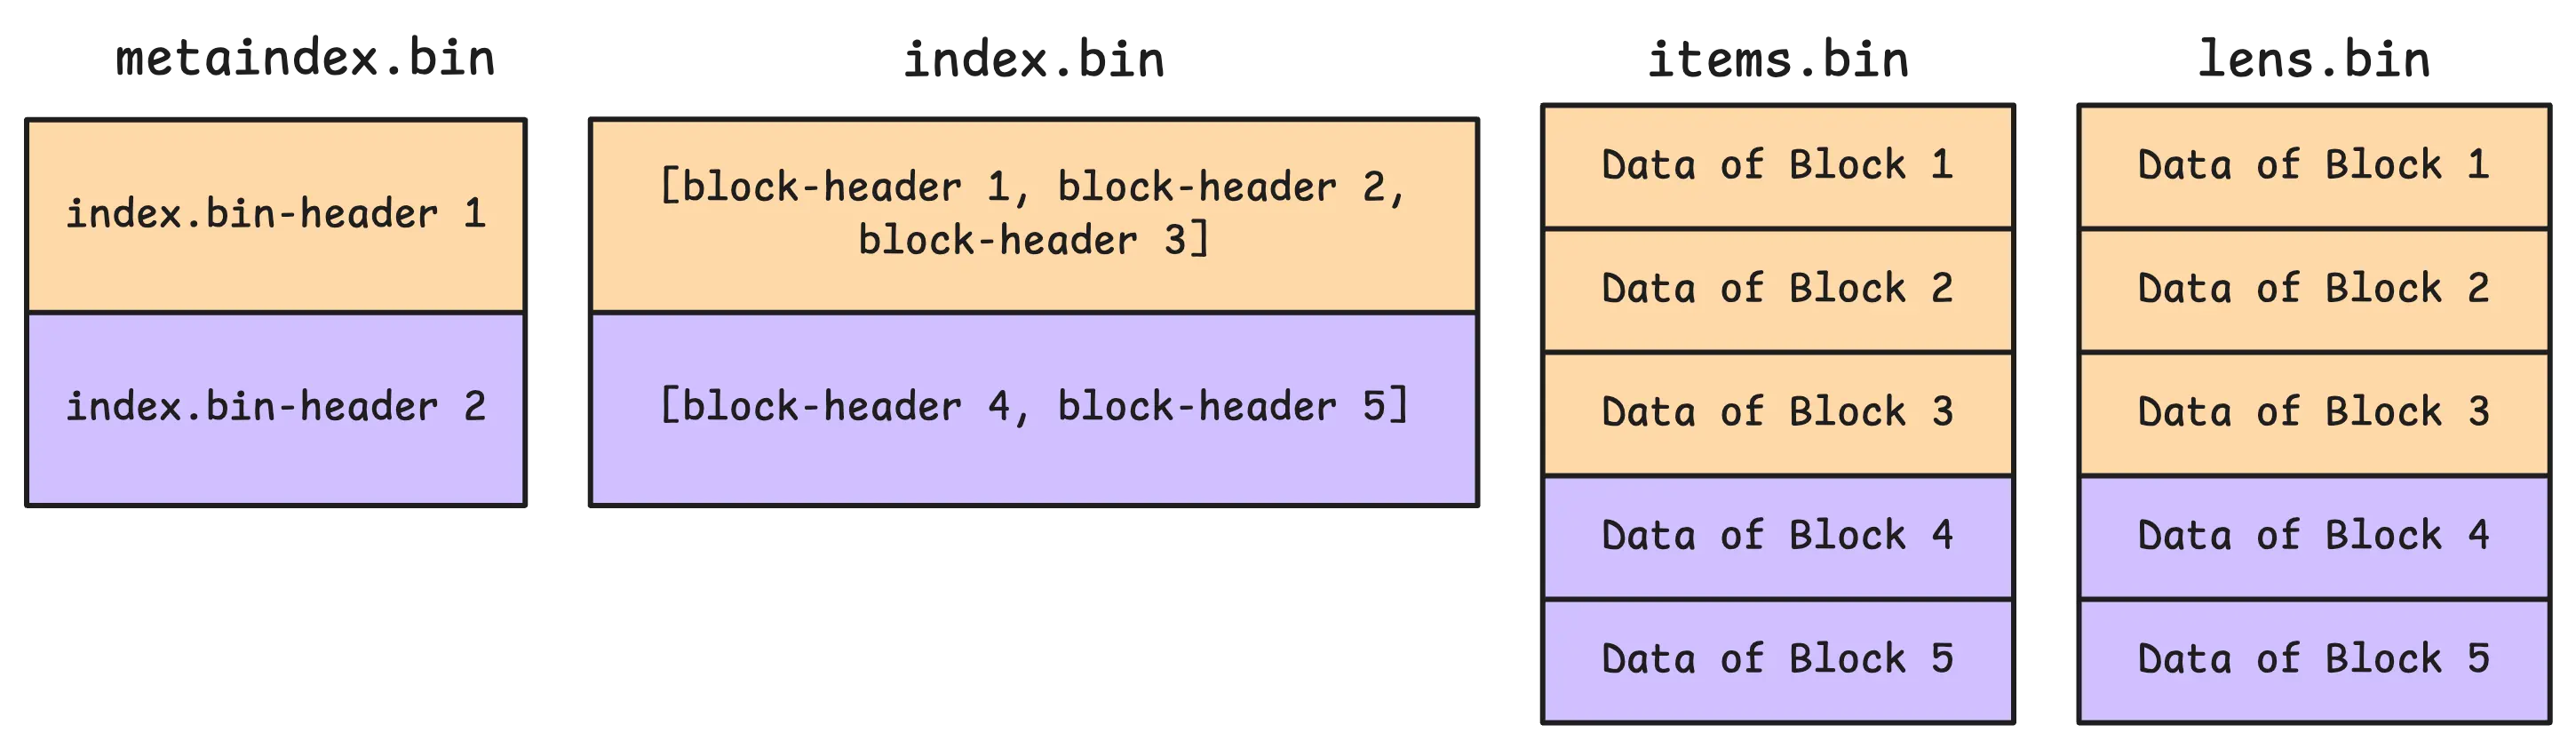
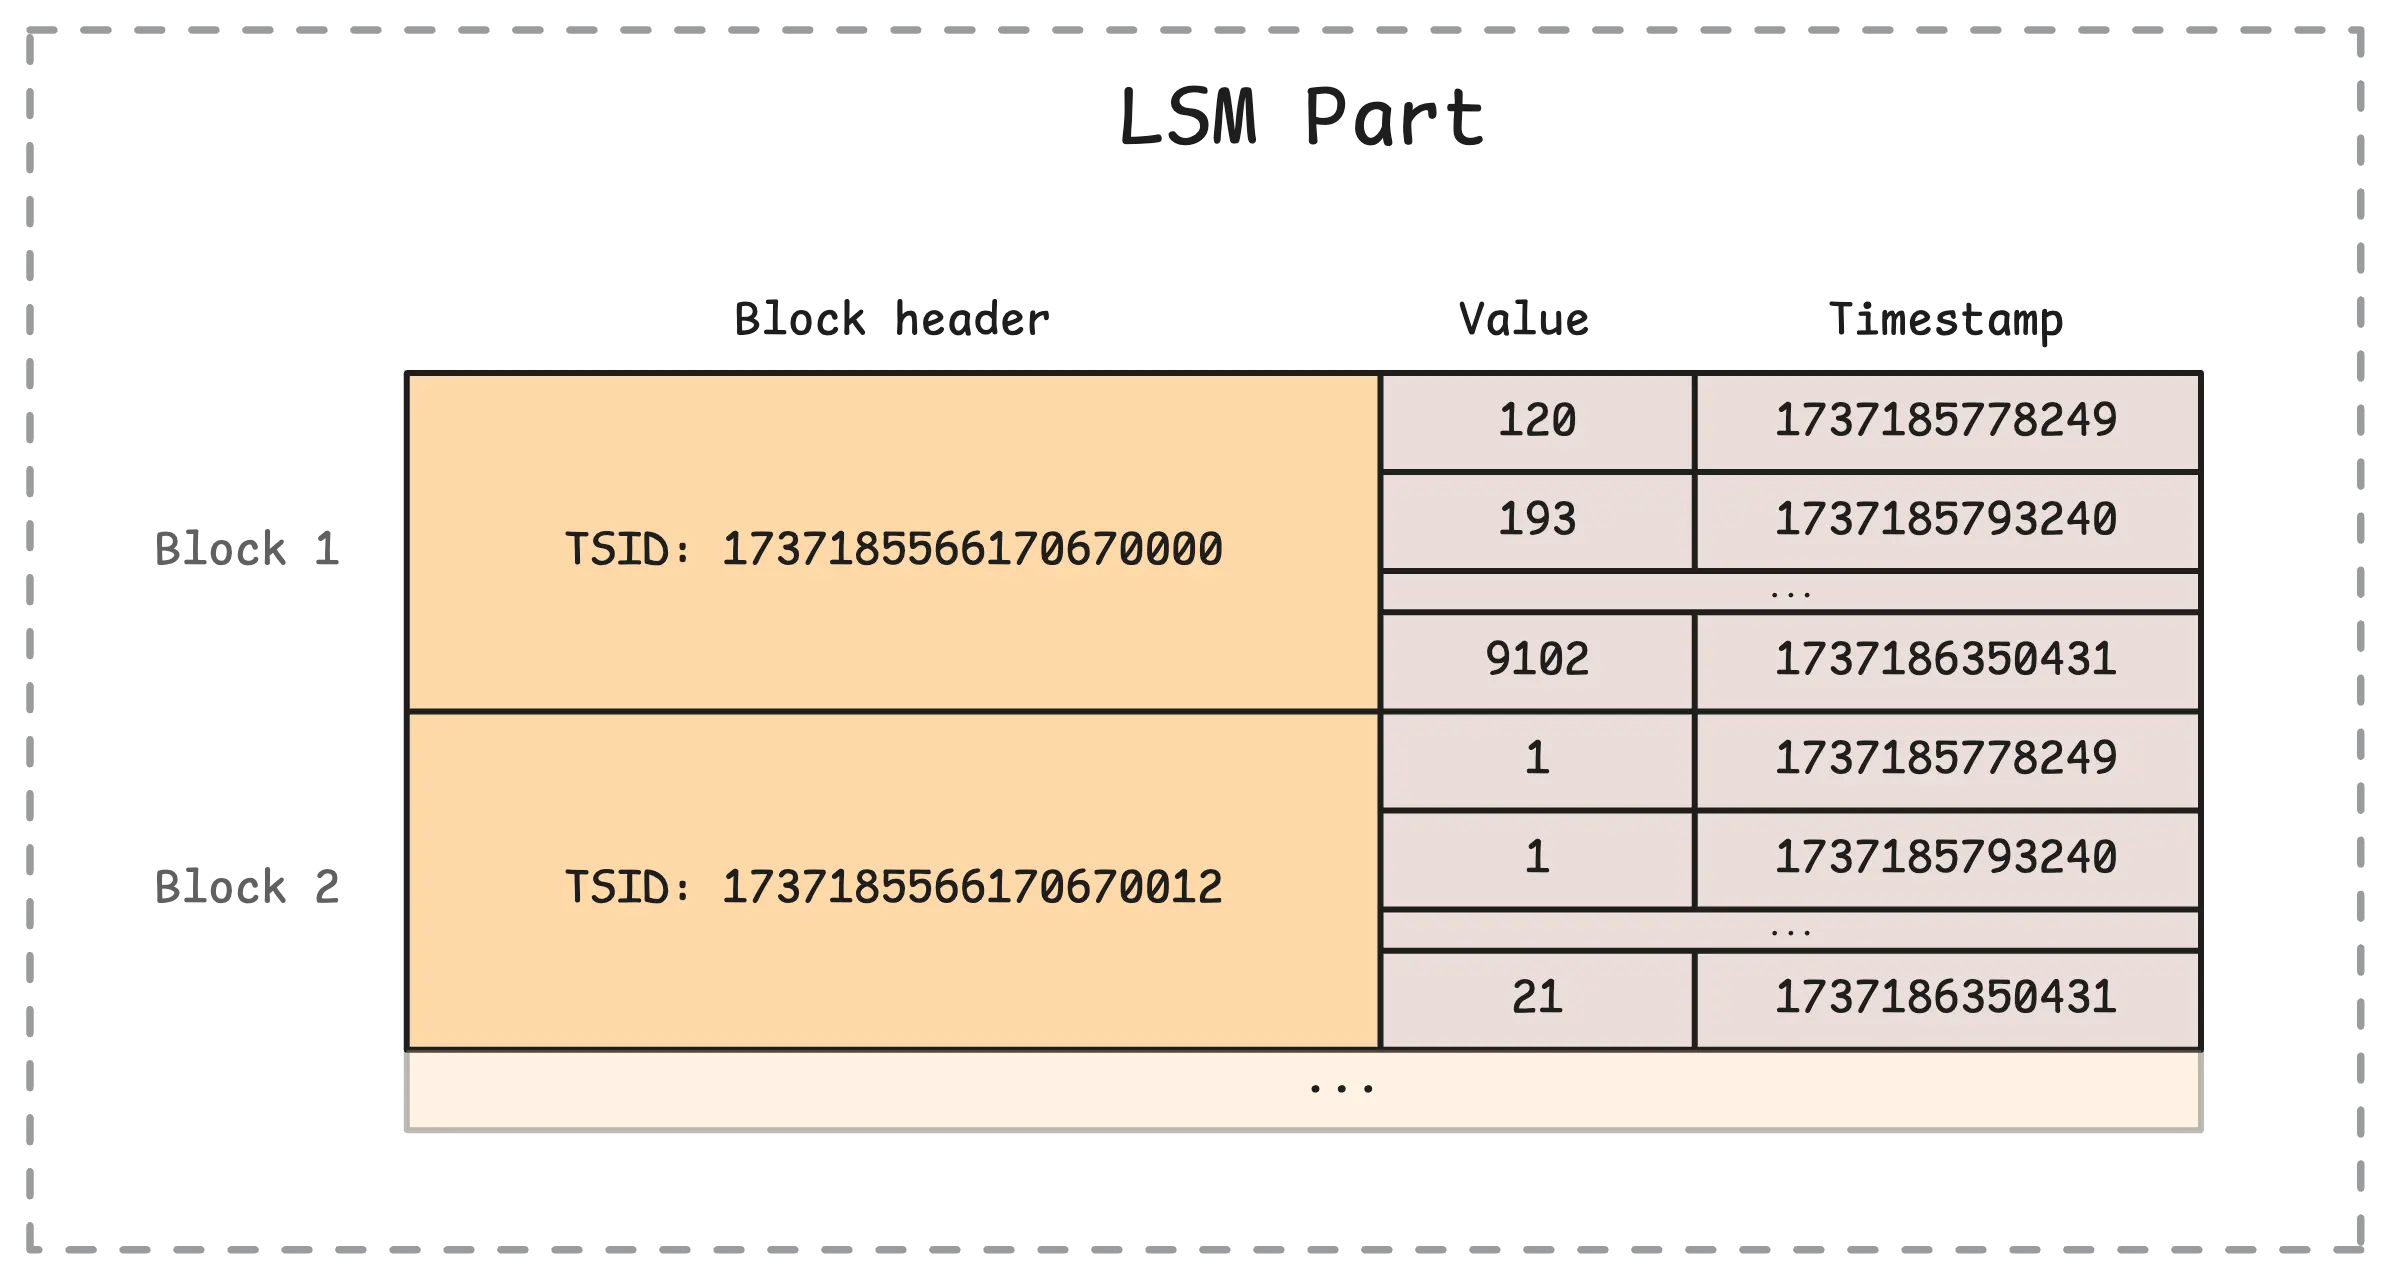
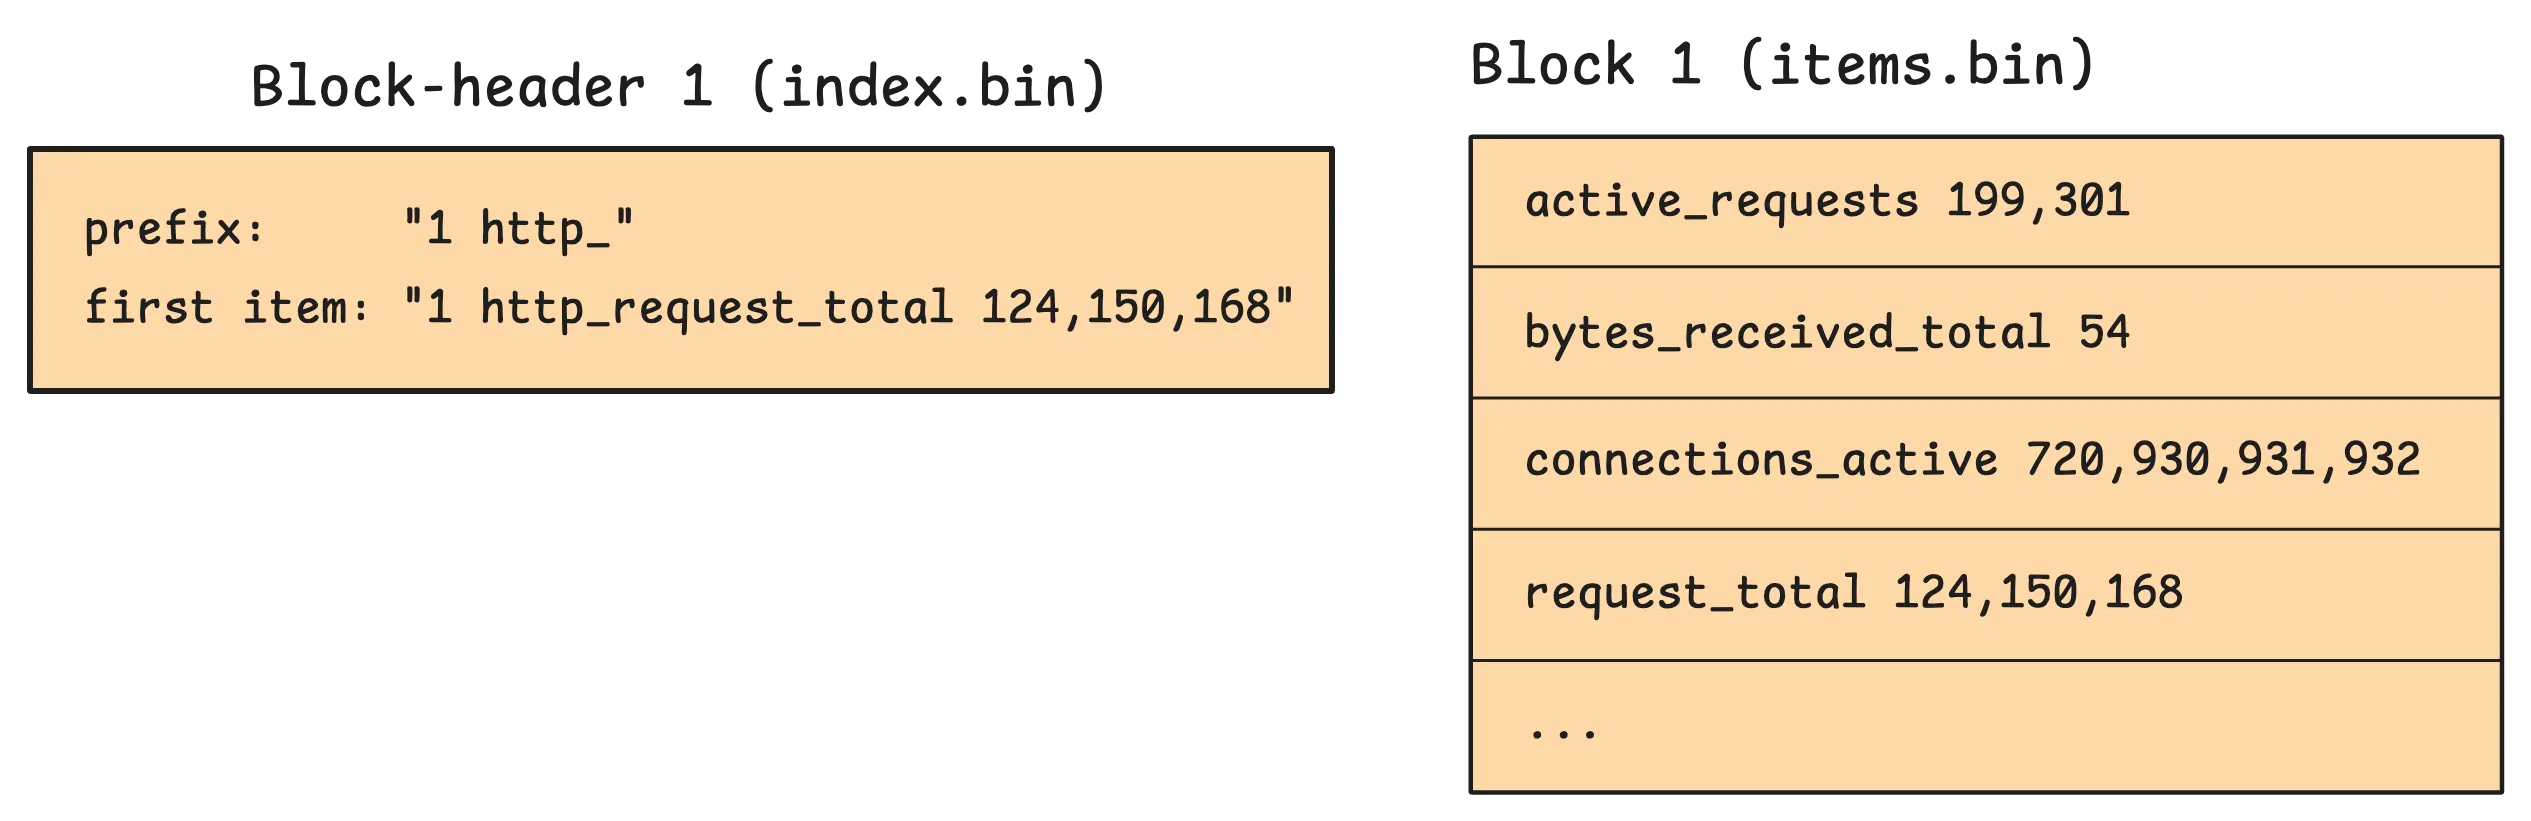
The index.bin file, on the other hand, is where block headers live. These headers store metadata about each block, like the block’s starting and ending positions in items.bin and lens.bin. They also include the block’s shared prefix, which is the common prefix for all the items in that block:
During startup, vmstorage goes through a few key steps to get everything ready:
- It starts by reading the
parts.jsonfile. This tells vmstorage which parts belong to which IndexDB. At this stage, it opens (but doesn’t actually read) the heavier files likeindex.bin,items.bin, andlens.bin. - It then loads all the
metadata.jsonfiles from every part into memory. These files include details like the number of items and blocks, as well as the first and last items in the part. This makes quick comparisons possible later. - Finally, it loads all the
metaindex.binfiles from every part, whether big or small. These files are relatively lightweight but critical — they help vmstorage quickly find the right data inside the largerindex.binfiles.
How IndexDB Handles Data Ingestion
#
When data arrives at vmstorage, the first thing it does is check whether the metric already has a unique ID (TSID). It does this by looking in the TSID cache. If it finds a match, great—things move quickly. But if there’s a cache miss, it’s considered a slow insert, and vmstorage falls back to consulting IndexDB instead.
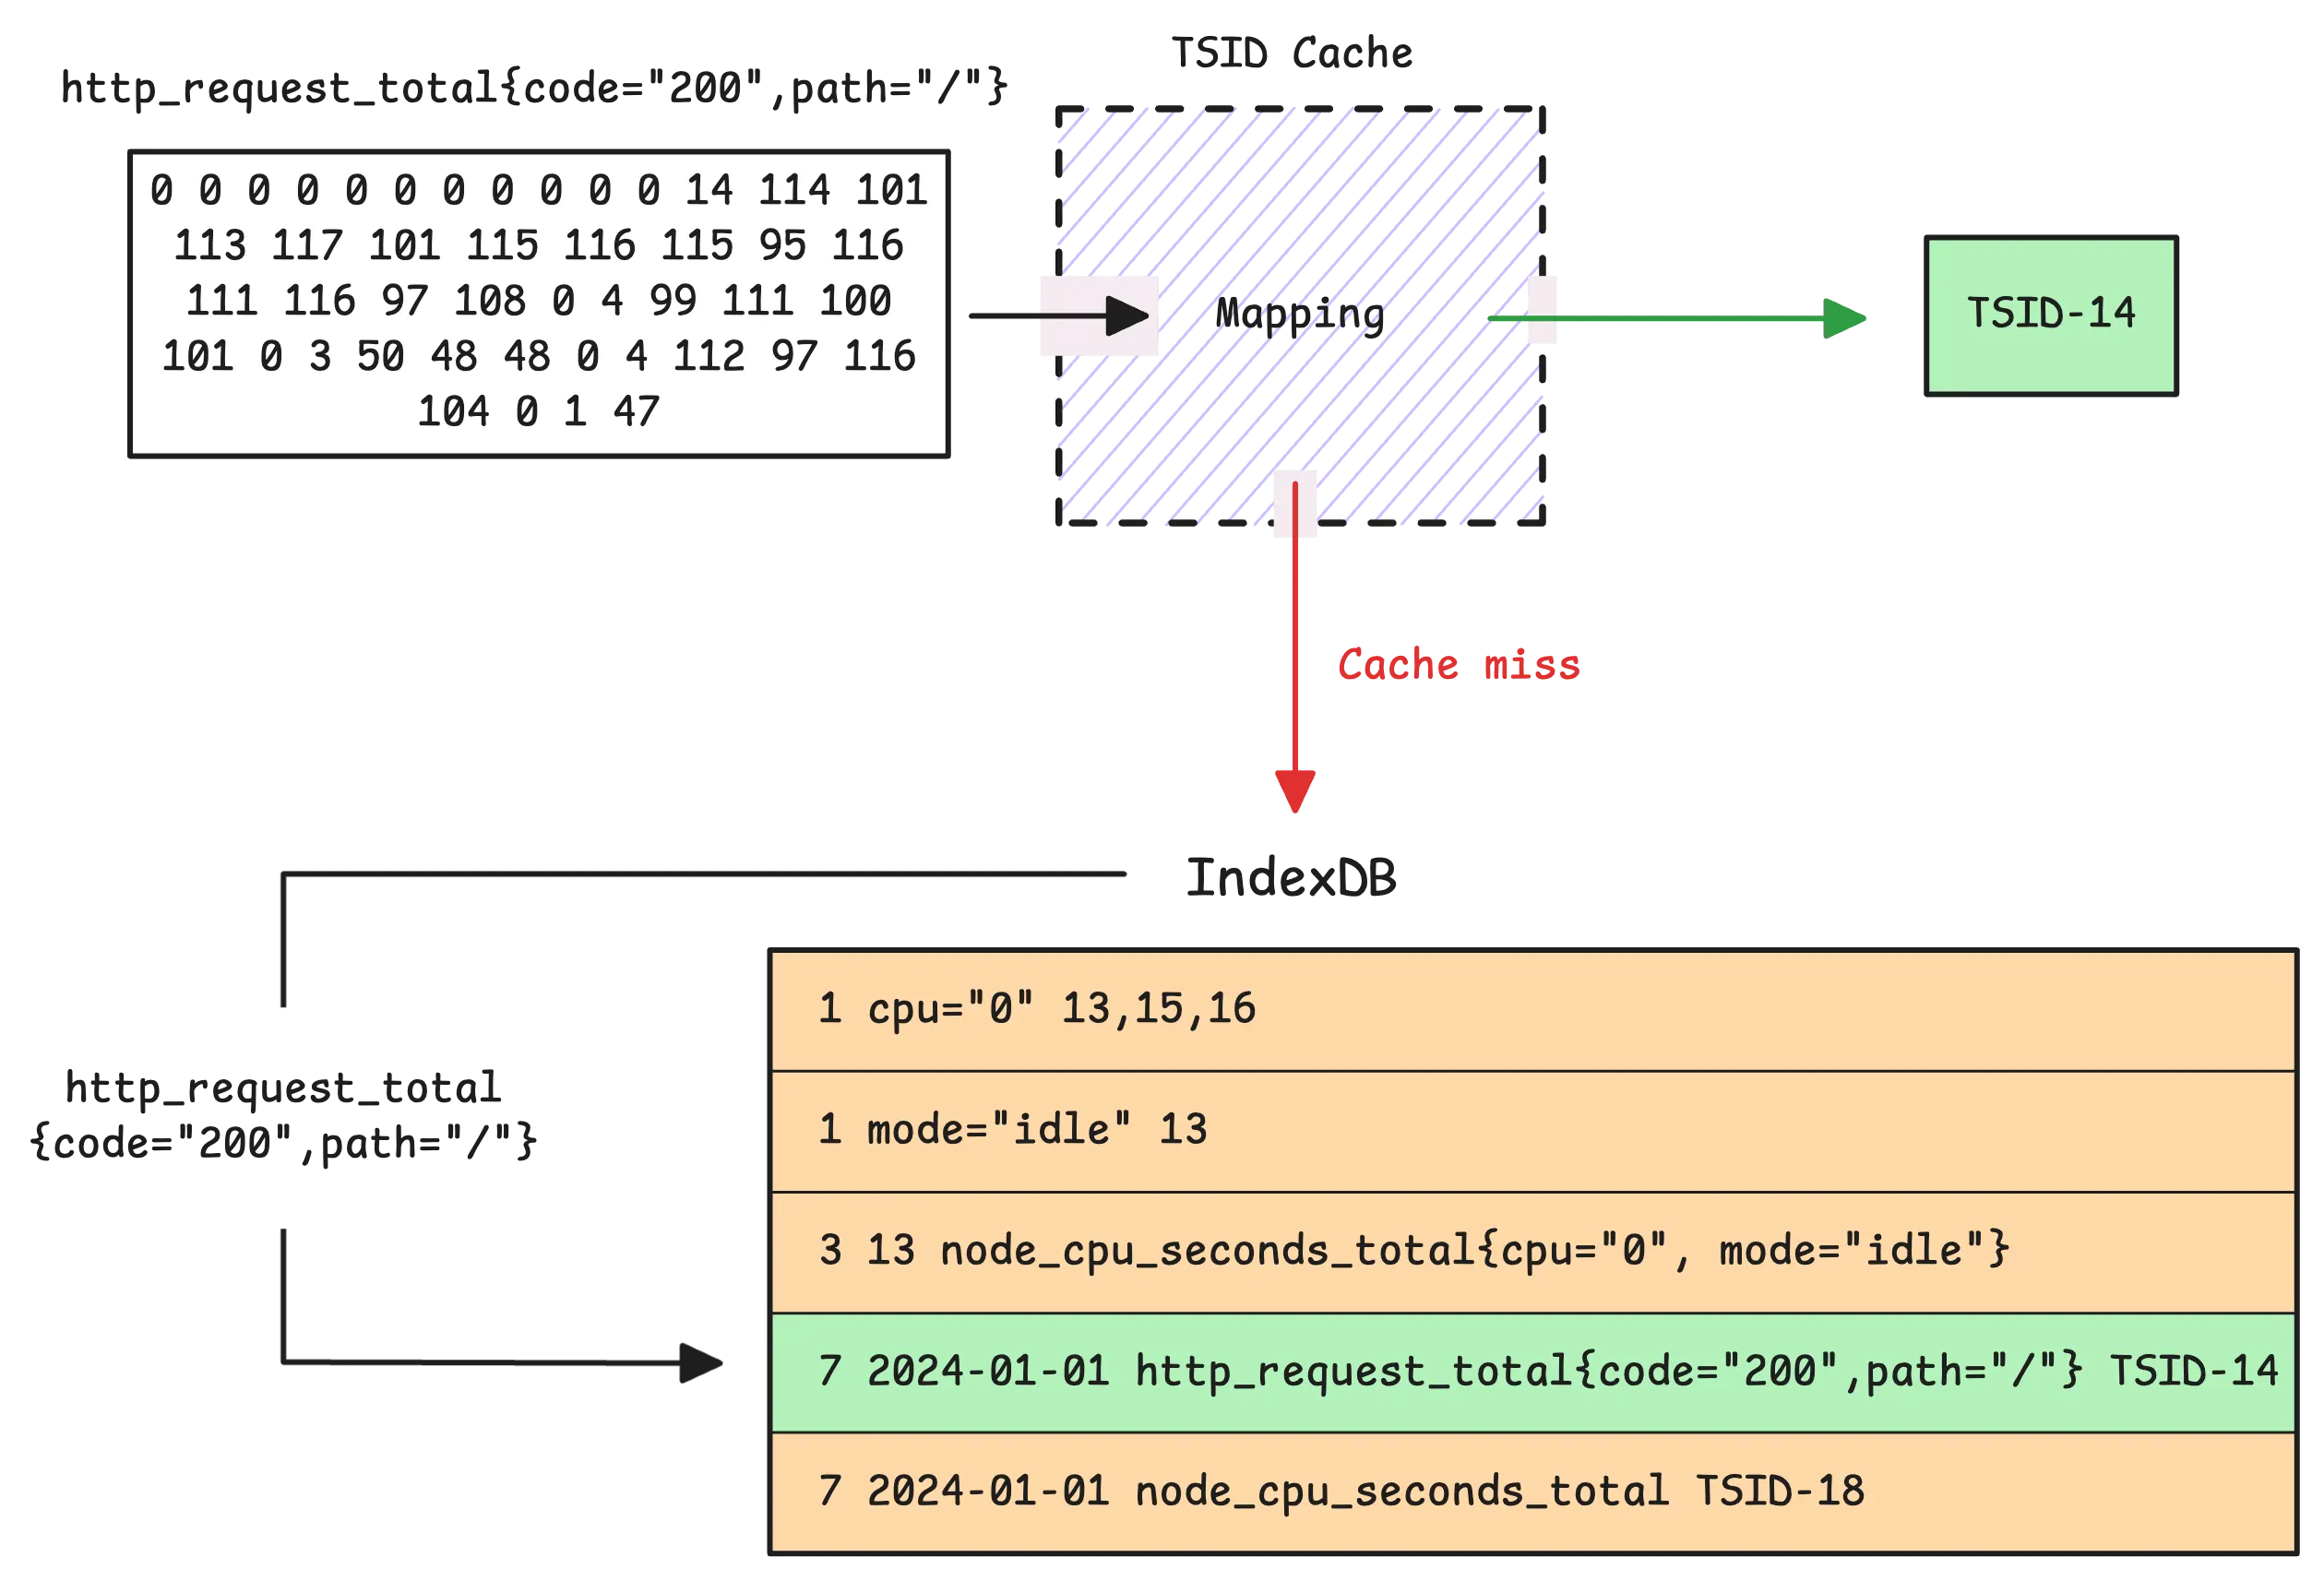
Here’s how it works: IndexDB uses its seventh prefix mapping (date + metric name -> TSID) to look for the TSID in both the current and previous IndexDB (as long as the previous one is still relevant). If the TSID isn’t found, vmstorage creates a brand-new TSID for the timeseries and adds it to all seven indexes.
Tip: Useful metrics
- Slow inserts (cache misses):
vm_slow_row_inserts_total - New timeseries (cache misses that also weren’t in IndexDB):
vm_new_timeseries_created_total
Most indexes get one new entry — except for the tag to metric ID index.
To explain this better, imagine we get a timeseries like http_request_total{method="GET",status="200"} on January 1st, 2024. In this case, IndexDB creates 3 entries: one for the metric name http_request_total, one for method, and one for status in both global and per-day tag to metric IDs indexes, right?
So, it’s 6 entries in total. Let’s see if our assumption is correct:
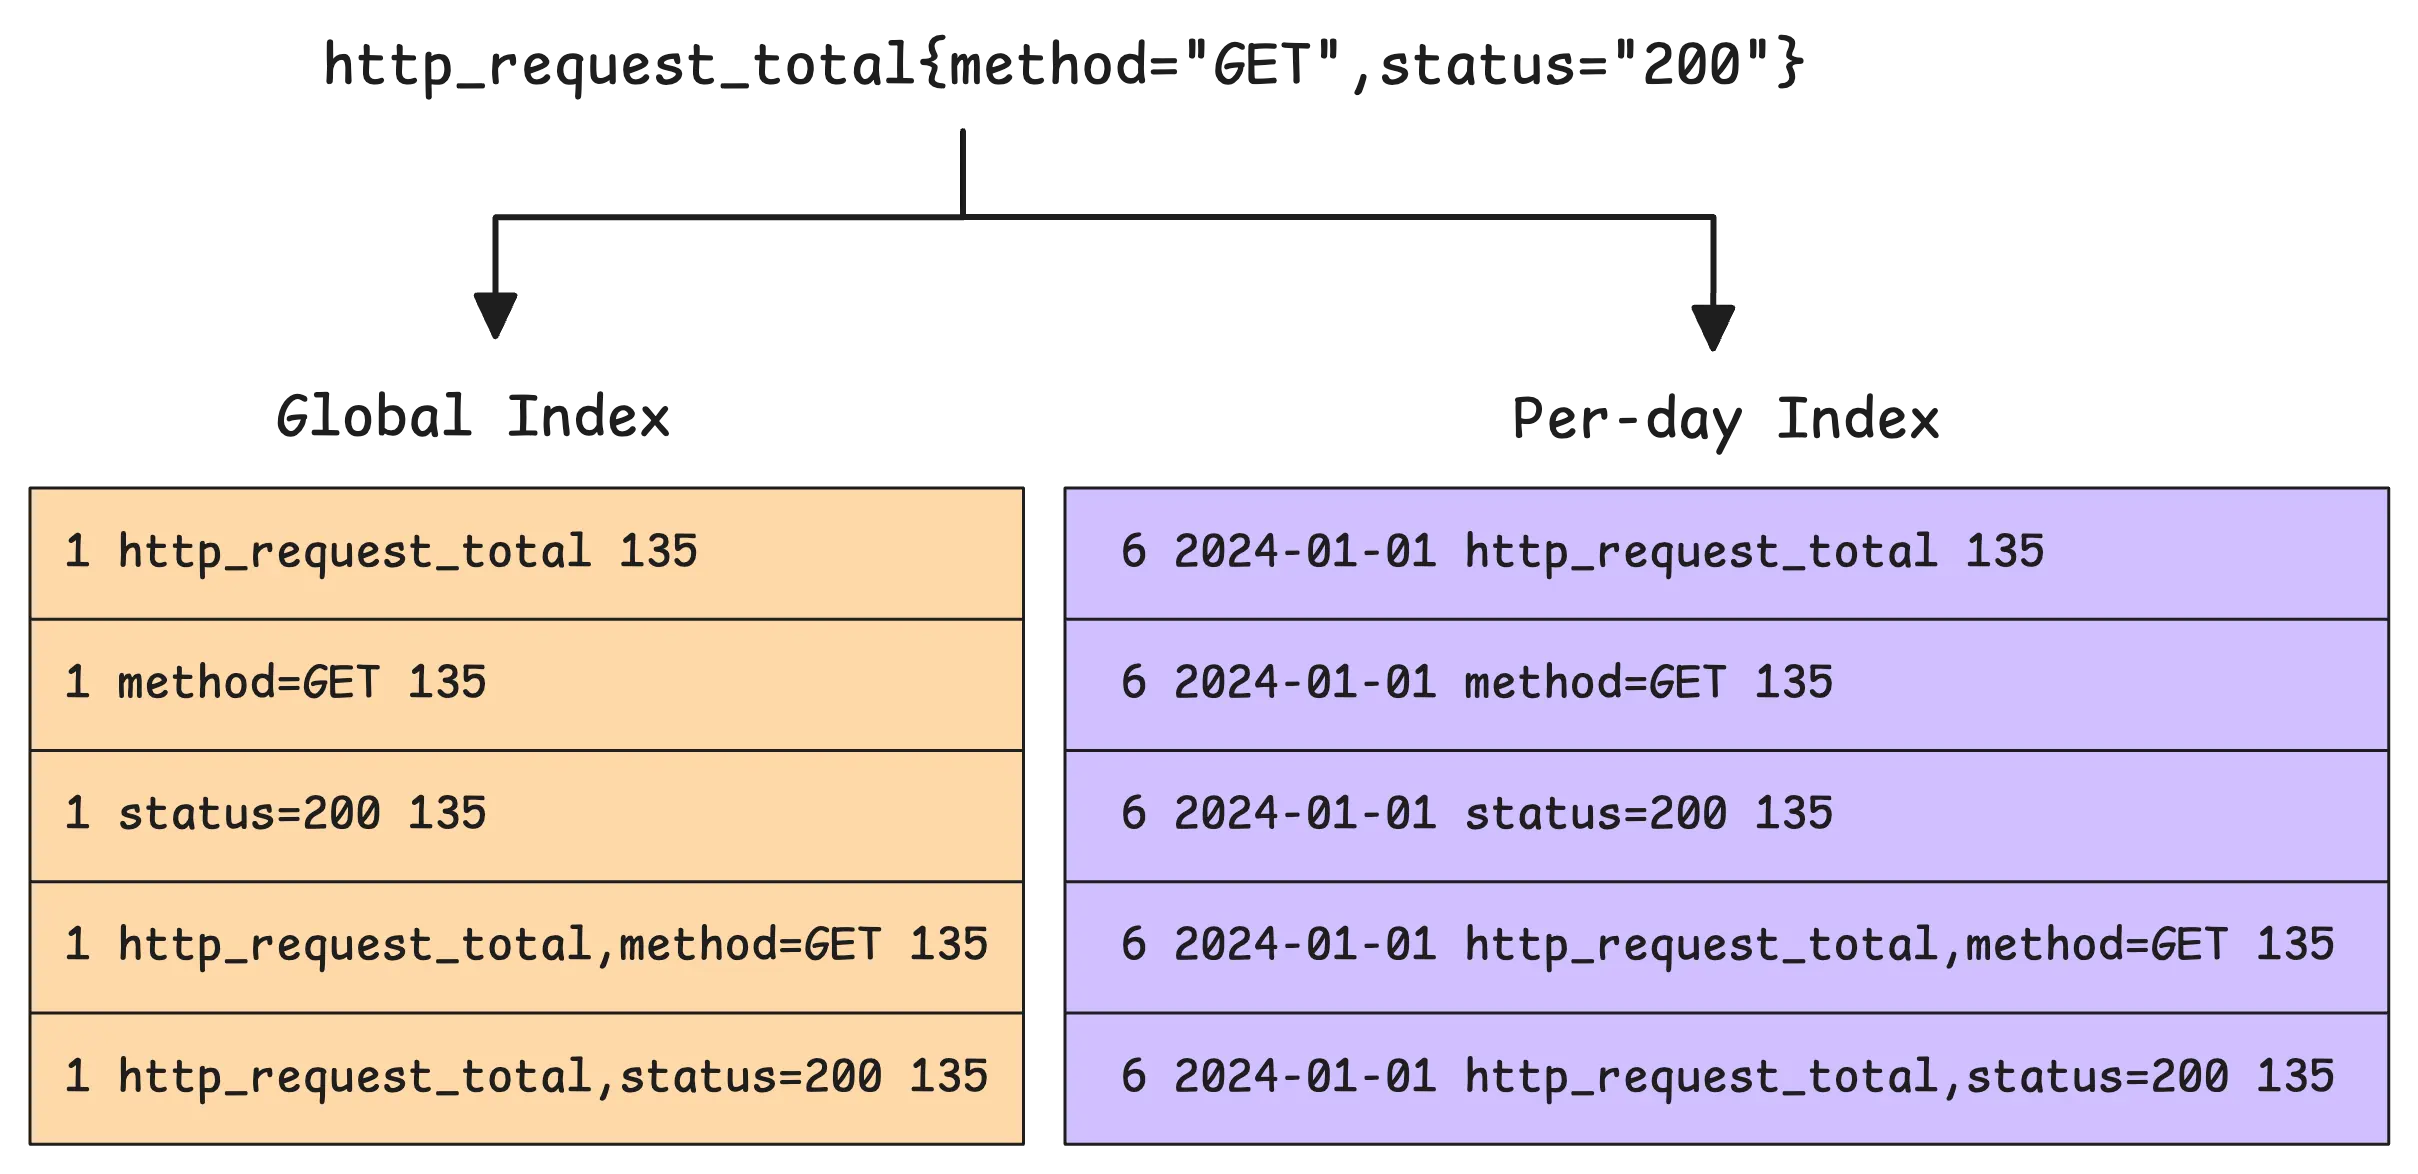
What we just discussed isn’t correct. The actual number of new rows added for the tag to metric ID index isn’t 6 — it’s 10. Why? Because of something called a composite index.
A composite index combines the metric name with its tags. This narrows down the search space even further. It means you can search using just the tag (e.g., {method="GET"}) or combine it with the metric name (e.g., http_request_total{method="GET",status="200"}). It’s designed to speed things up for most scenarios.
At the end of the ingestion process, two warmup steps kick in:
- One hour before the next rotation (when the current and next IndexDB switch roles), the next IndexDB gets pre-filled with metrics being ingested during that time.
- One hour before the new day starts, vmstorage pre-populates all the per-day indexes for the next day, including the last three indexes.
Tip: Useful metrics
- How many rows were added to IndexDB:
vm_indexdb_items_added_total - How many bytes those rows took up:
vm_indexdb_items_added_size_bytes_total - How many metrics were pre-populated into the next IndexDB:
vm_timeseries_precreated_total
The Merge Process
#
IndexDB’s structure has a lot in common with the main storage. Both include in-memory buffers, in-memory parts, small parts, and big parts.
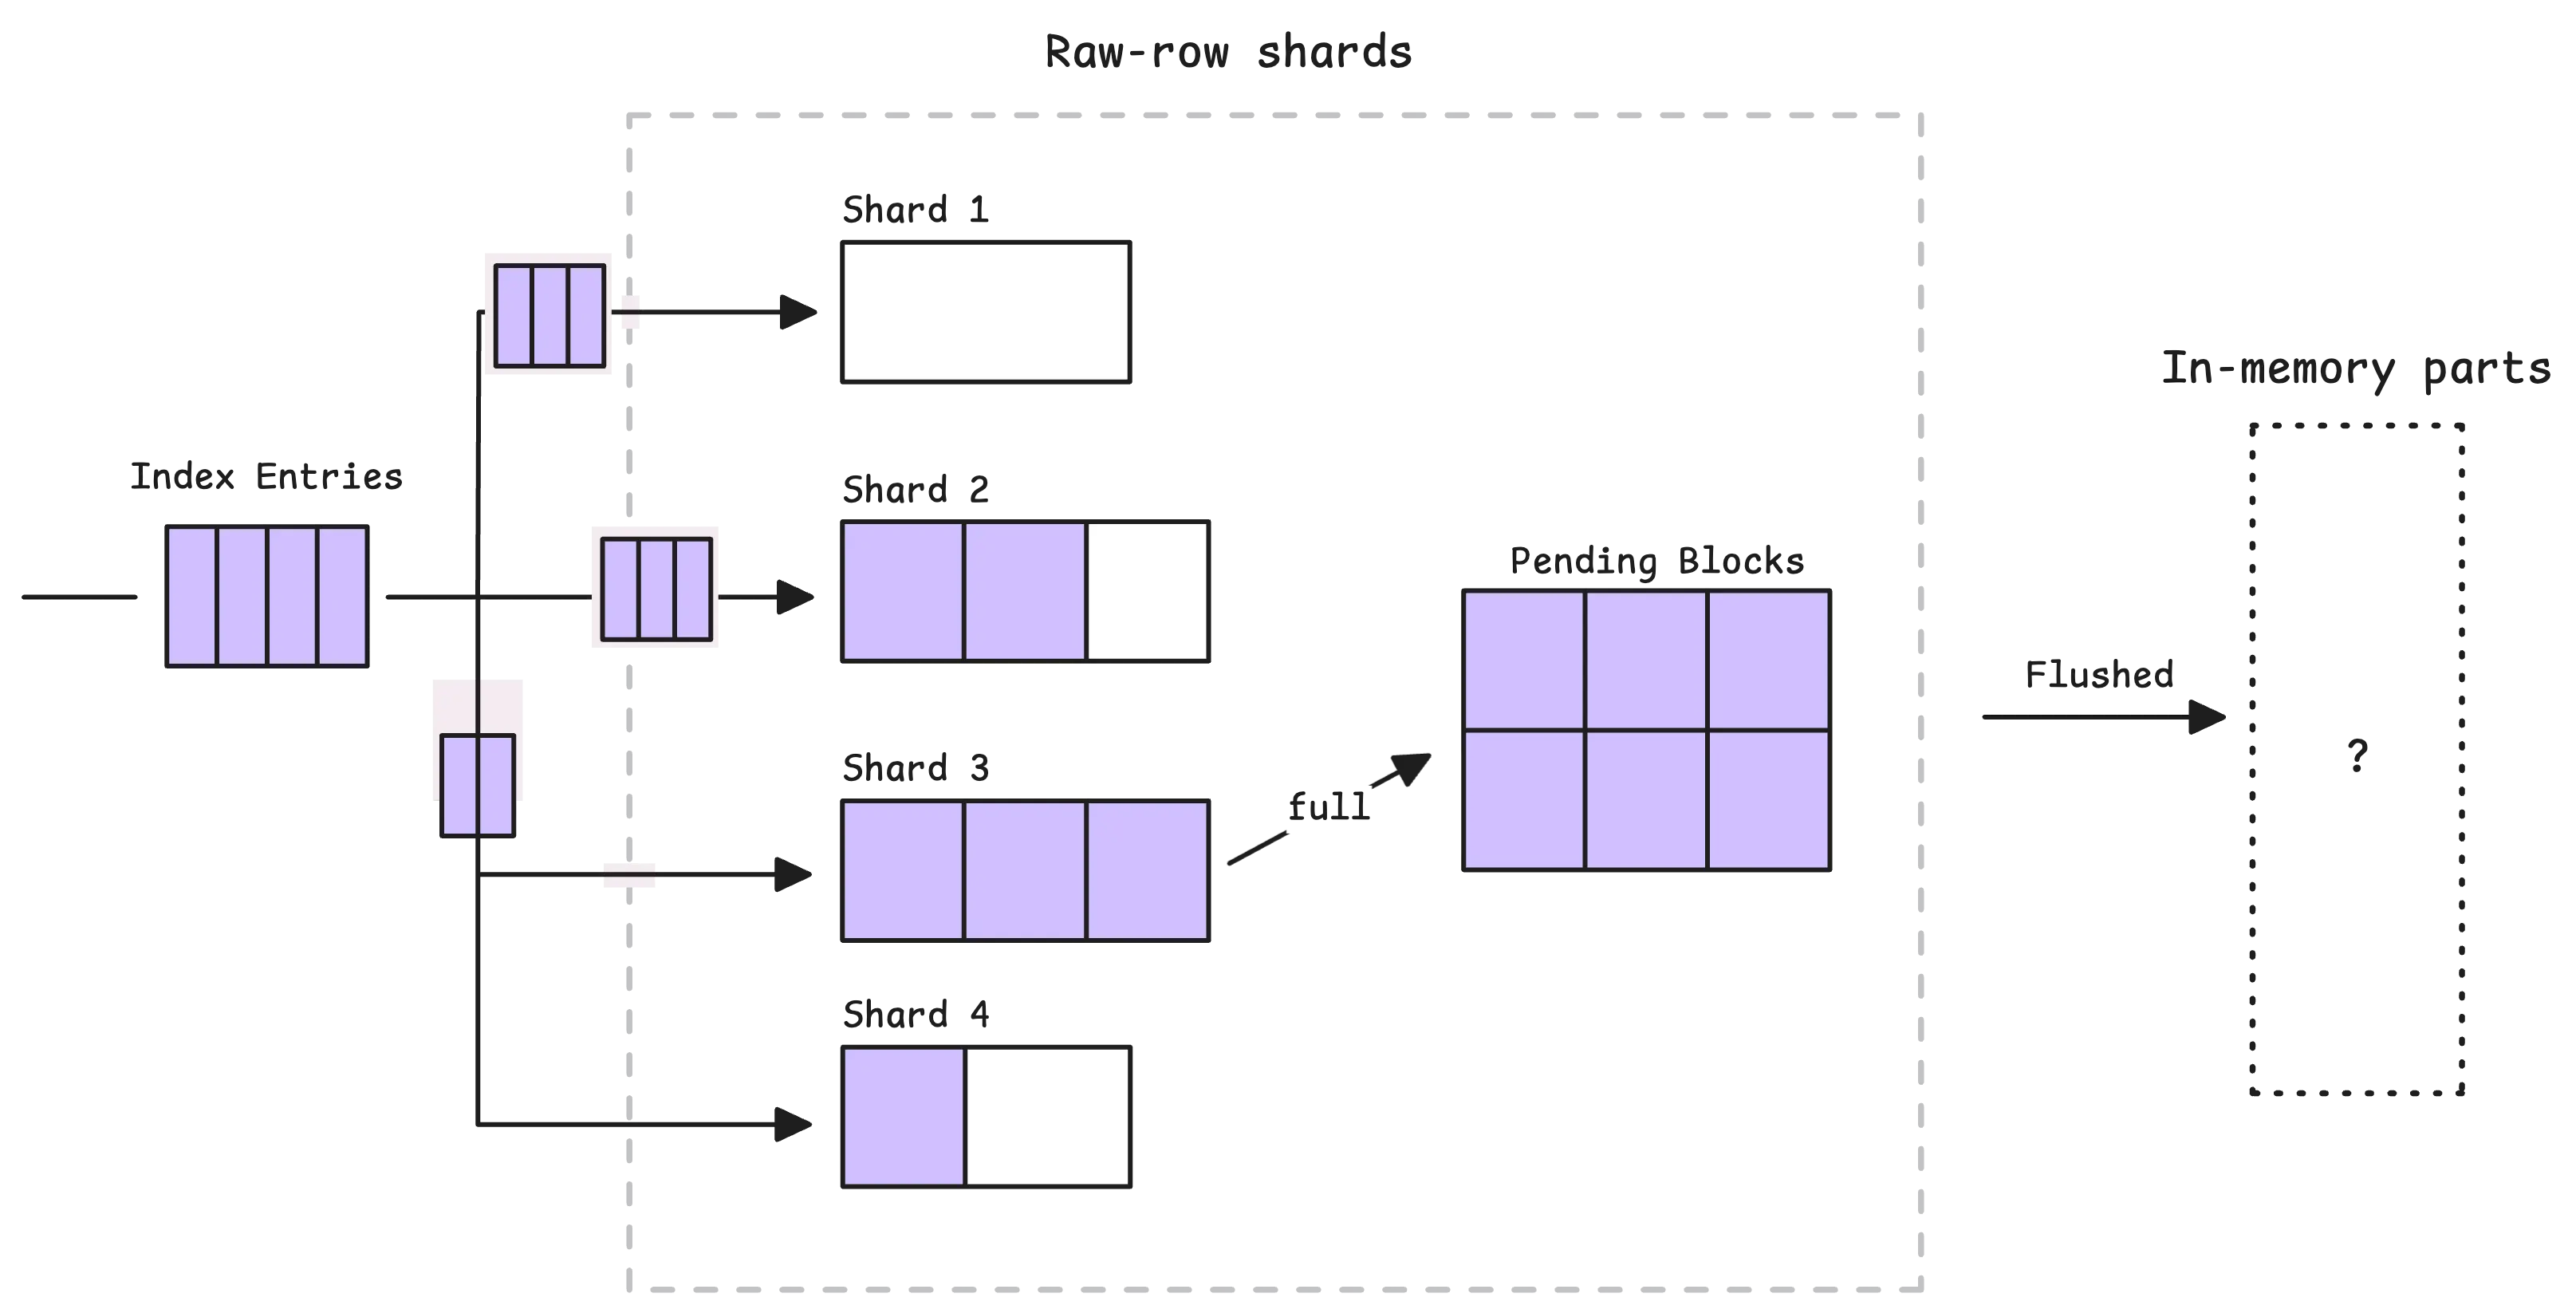
However, the entries we just talked about don’t go straight to disk right away. Just like the main storage uses raw-row shards as a buffer, IndexDB has its own version of a buffer. Let’s call it the in-memory block shard, since each entry here is a block (not a TSID row, like in the main storage’s shard).
So, how many shards are there? The number depends on your CPU cores, based on this formula:
shard_count = cpu_cores * min(16, cpu_cores)
In other words, the more CPU cores, the more shards. For example, if vmstorage has access to 4 CPU cores, it will create 16 shards. Each shard can hold up to 256 in-memory blocks. A block, in turn, is a set of index entries and can hold up to 64 KB of data.
When a shard is full, its blocks are flushed into an intermediate stage called “pending blocks”:
From there, the pending blocks are flushed into in-memory parts in two situations: either periodically every 1 second, or when too many blocks accumulate.
The flush process doesn’t just group all the blocks into a part — it merges them. It works like this: the system sorts all the entries in the blocks, reads multiple blocks at once, picks the smallest item from these blocks, and adds it to a new sorted block. This way, items in the part are sorted by prefix.
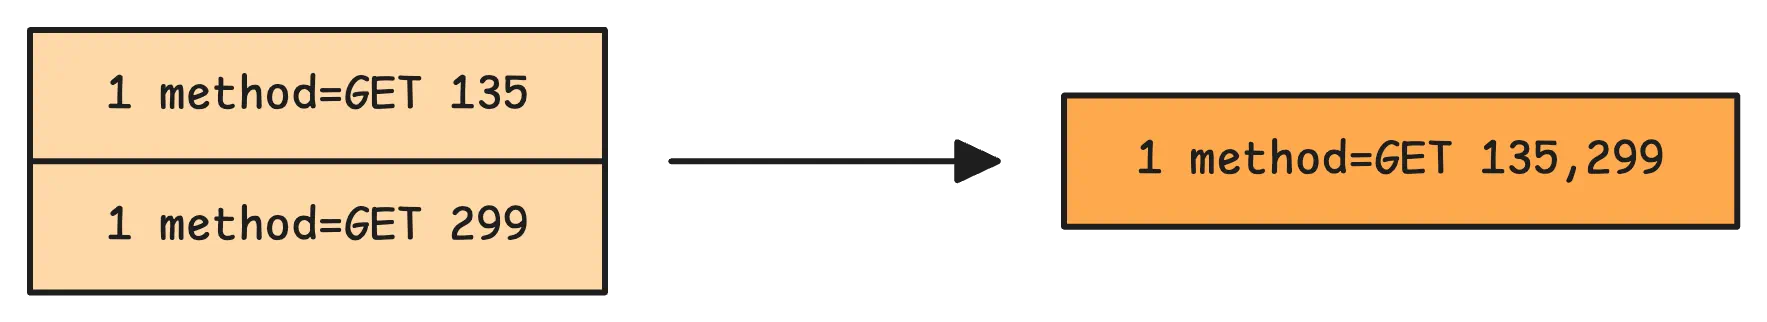
In addition to everything else, the tag to metric IDs mapping gets even more compact thanks to a combining metric ID technique.
Initially, each row in the tag to metric IDs mapping contains a single metric ID. But after the merge process, these rows are transformed into sets of metric IDs:
Now, here’s the big question:
“Why is the per-day index faster than the global index?”
With per-day indexing, searches are naturally split by date. When looking for a metric within a specific time range, the system only searches through entries that match the date prefix. This dramatically reduces the search space since it only focuses on metrics that were active on the relevant days.
For example, if you’re searching for http_request_total{status="200"} between 13:00 and 14:00 on 2024-01-01:
- The global index would need to scan every
1 status=200entry across the entire retention period. Most of those entries wouldn’t even apply to the one-hour window you’re looking at. - With the per-day index, IndexDB starts with the date prefix
6 2024-01-01 status=200and quickly narrows down the search to entries from January 1st, 2024. It doesn’t waste time on data from other days, like December or later dates.
The downside is that per-day indexes use significantly more disk and memory compared to the global index.
If you have a timeseries that appears daily, http_request_total{status="200"}, the per-day tag to metric IDs index will generate 21 entries over 7 days (3 entries per day × 7 days). Meanwhile, the global index will only need 3 entries for the same timeseries, no matter how many days it spans.
Finally, when it comes to merging small parts, big parts, and flushing data to disk, the process works similarly to how it’s done in the main storage. So, we’ll skip that here to avoid repeating ourselves.
Who We Are
#
Need to monitor your services to see how everything performs and to troubleshoot issues? VictoriaMetrics is a fast, open-source, and cost-efficient way to stay on top of your infrastructure’s performance.
If you come across anything outdated or have questions, feel free to send me a DM on X (@func25).
Leave a comment below or Contact Us if you have any questions!
comments powered by Disqus