- Blog /
- Inside vmselect: The Query Processing Engine of VictoriaMetrics
Inside vmselect: The Query Processing Engine of VictoriaMetrics
Share:


This piece is part of our ongoing VictoriaMetrics series, where we break down how different components of the system function:
- How VictoriaMetrics Agent (vmagent) Works
- How vmstorage Handles Data Ingestion
- How vmstorage Processes Data: Retention, Merging, Deduplication,…
- When Metrics Meet vminsert: A Data-Delivery Story
- How vmstorage’s IndexDB Works?
- How vmstorage Handles Query Requests From vmselect
- Inside vmselect: The Query Processing Engine of VictoriaMetrics
Receive Requests
#
vmselect handles multiple requests from different APIs at the same time. But there’s a limit—twice the number of CPU cores, capped at 16 (unless you configure it differently using -search.maxConcurrentRequests).
The reason for this 8-core limit is that running too many concurrent requests is not beneficial, as each request typically uses all CPU cores during query execution. So, if you’re running on more than 4 cores, vmselect allows up to 8 concurrent requests.
When requests exceed this limit, they wait in a queue for up to 10 seconds (-search.maxQueueDuration). If they’re still waiting after that, they get dropped.
Metrics: Is vmselect overwhelmed?
- How many requests are actively being processed:
vm_concurrent_select_current - The fixed number of concurrent requests allowed:
vm_concurrent_select_capacity - How often vmselect hits its request limit:
vm_concurrent_select_limit_reached_total - How many requests time out in the queue:
vm_concurrent_select_limit_timeout_total
vmselect processes range query requests through these HTTP paths:
- In a cluster setup:
select/{tenantID}/prometheus/api/v1/query_range - In a single-node setup:
/api/v1/query_range
A few request settings are worth noting:
- Deadlines: By default, a request has 30 seconds to complete (
-search.maxQueryDuration). You can override this with thetimeoutquery parameter. - Caching: Query results may be cached in memory. To bypass caching, use the
nocacheparameter to disable caching for individual requests or the-search.disableCacheflag to disable caching entirely. - Lookback delta: is controlled by
-search.maxLookbackor can be set per request using themax_lookbackparameter. If neither is set, vmselect automatically determines a value based on the data. - Step: If the
stepparameter isn’t provided, vmselect defaults to 5 minutes. Typically, query editors like Grafana or vmui handle this for you.
Not sure what lookback delta or step means? Check out Instant Queries and Range Queries Explained.
Parse Query
#
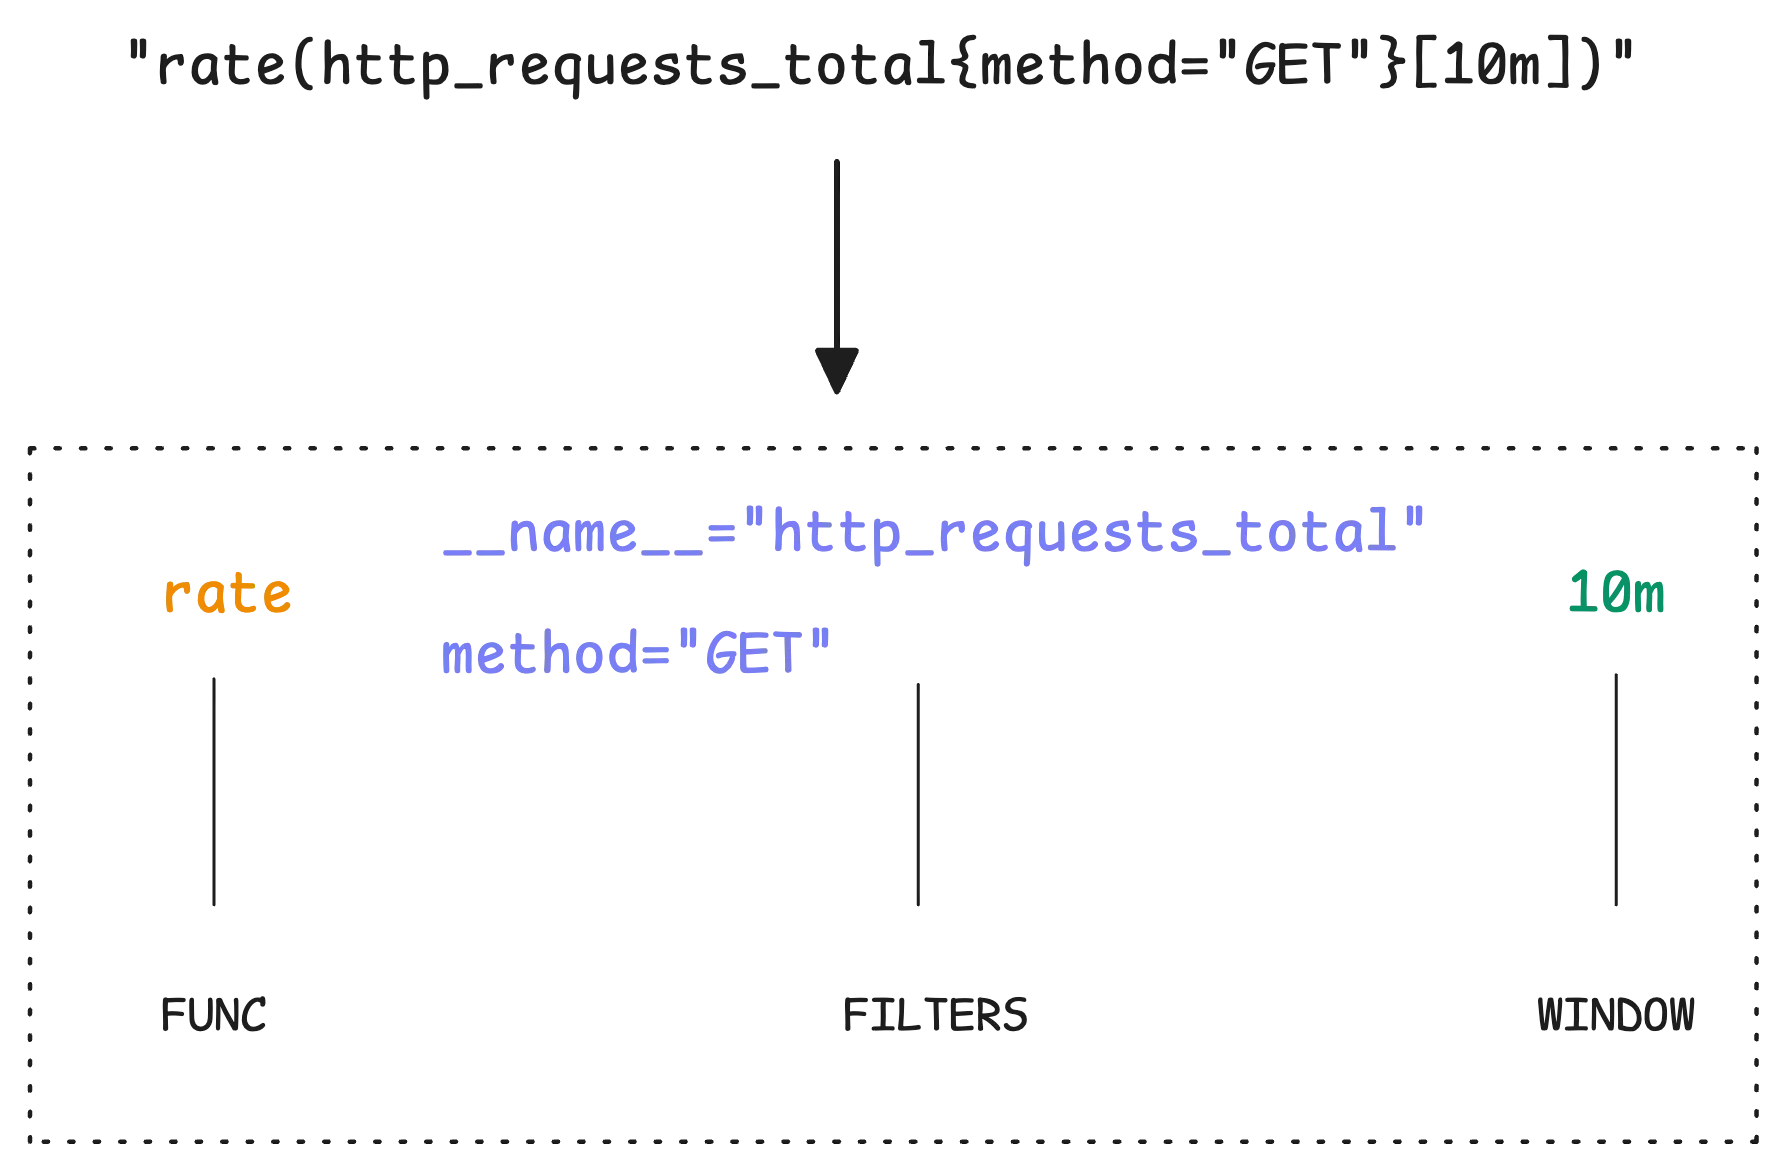
vmselect takes your query as a raw string, like rate(http_requests_total{method="GET"}[10m]). Before it can do anything, it has to break that down into structured data for analysis:
To avoid the overhead of parsing the same query over and over, vmselect caches structured query results in memory.
Is the parsing cache working well?
- How many requests hit the cache:
vm_cache_requests_total{type="promql/parse"} - How many cache misses:
vm_cache_misses_total{type="promql/parse"} - How many entries are currently in the cache:
vm_cache_entries{type="promql/parse"}
If a query is likely invalid, vmselect automatically tweaks it to make it valid—no need to manually adjust parameters. For example, avg_over_time(temperature) wouldn’t work because avg_over_time needs a range vector. Instead of rejecting it outright, vmselect rewrites it as avg_over_time(temperature[1i]). In this case, 1i equals the step parameter provided in the API request.
This implicit conversion makes queries easier to write, but it can also hide mistakes. If you prefer strict validation, set the -search.disableImplicitConversion flag to force vmselect to reject invalid queries. If you like the convenience but still want visibility, enable -search.logImplicitConversion to get warnings when adjustments happen.
At this point, vmselect has a basic understanding of the query and moves on to fetch data from vmstorage.
Fetch Data
#
vmselect first figures out what kind of expressions are in your query. It could be a rollup function like sum_over_time or rate, a transformation function like abs or sqrt, or a binary operation like +, -, *, /. Each type needs to be handled differently. No need to go into all the details here—there’s a separate article for that later.
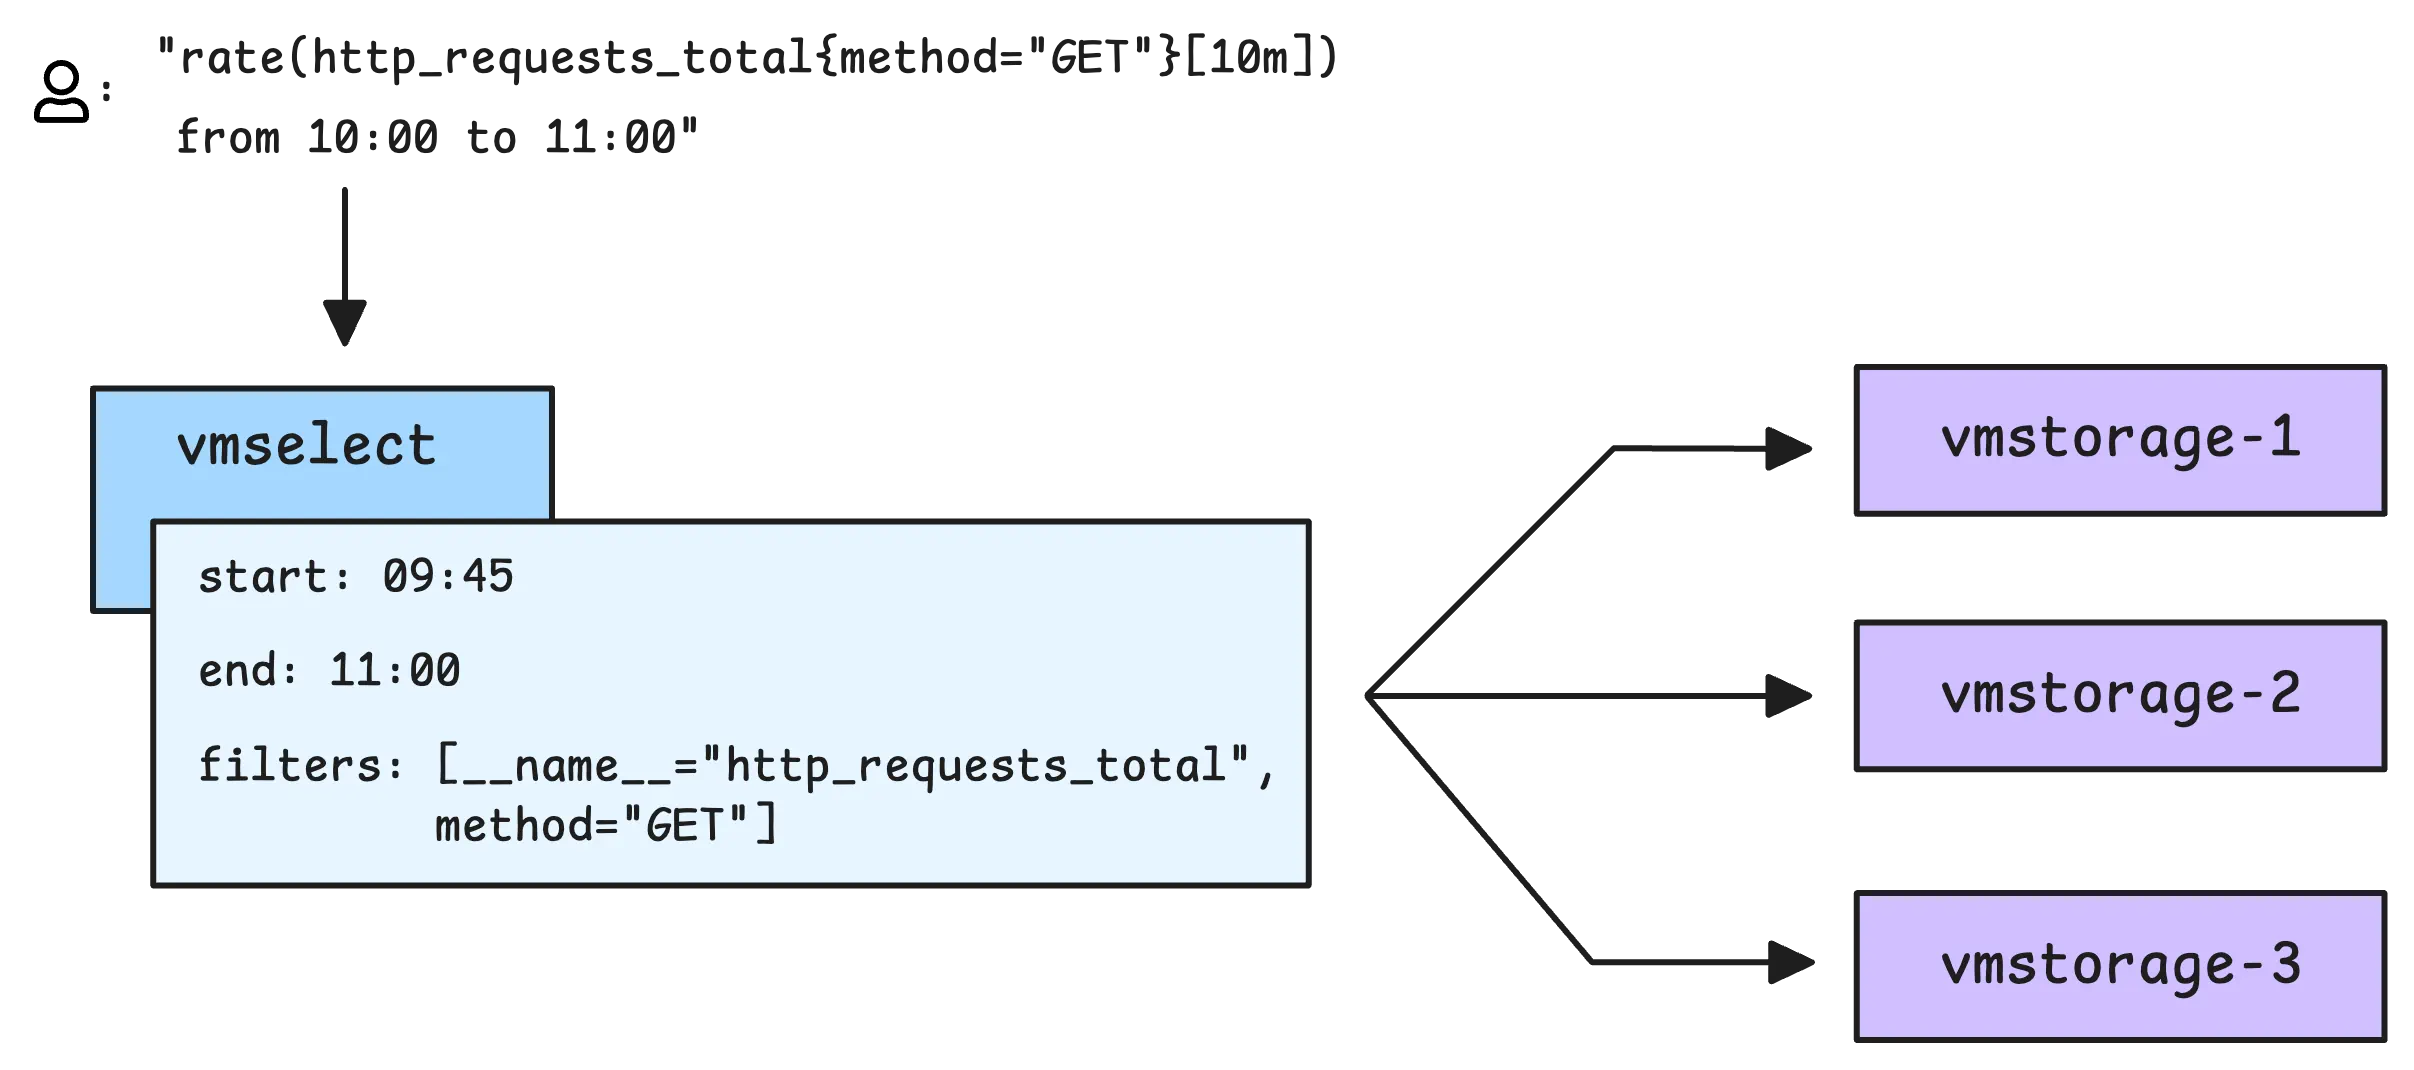
Some functions need historical data to work, like increase and rate. vmselect automatically pulls in older data, even from before your query’s start time. For example, if you query data starting at 10:00, it might fetch data from 09:00 to 10:00. But how much historical data is needed?
The exact amount depends on your query and the settings:
period = max(step, window) + silence_interval
So the actual start of the query is shifted by the period:
start = requested_start - period
Let’s take an example:
- The silence interval is 5 minutes (
-search.minStalenessInterval) - You query
rate(http_requests_total[10m])at 10:00, so the window is 10 minutes drived from the query ([10m]). - Assume the
stepis very small compare to the window.
The actual start is:
period = max(step, window) + silence_interval
       = max(step, 10m) + 5m
       = 15m

start = requested_start - period
      = 10:00 - 15m
      = 09:45
So, vmselect will actually fetch data from 09:45 instead of your original query 10:00. If your metrics are collected at an unusual interval—say, every 15 minutes instead of the usual scrape frequency—you might need to increase silence interval value to make sure vmselect gathers enough data.
In the last section of this discussion, you will know that the most recent data points (up to 30 seconds) are not included in the results.
Once the time range is set, vmselect builds a search query with tag filters and sends it to all vmstorage nodes:
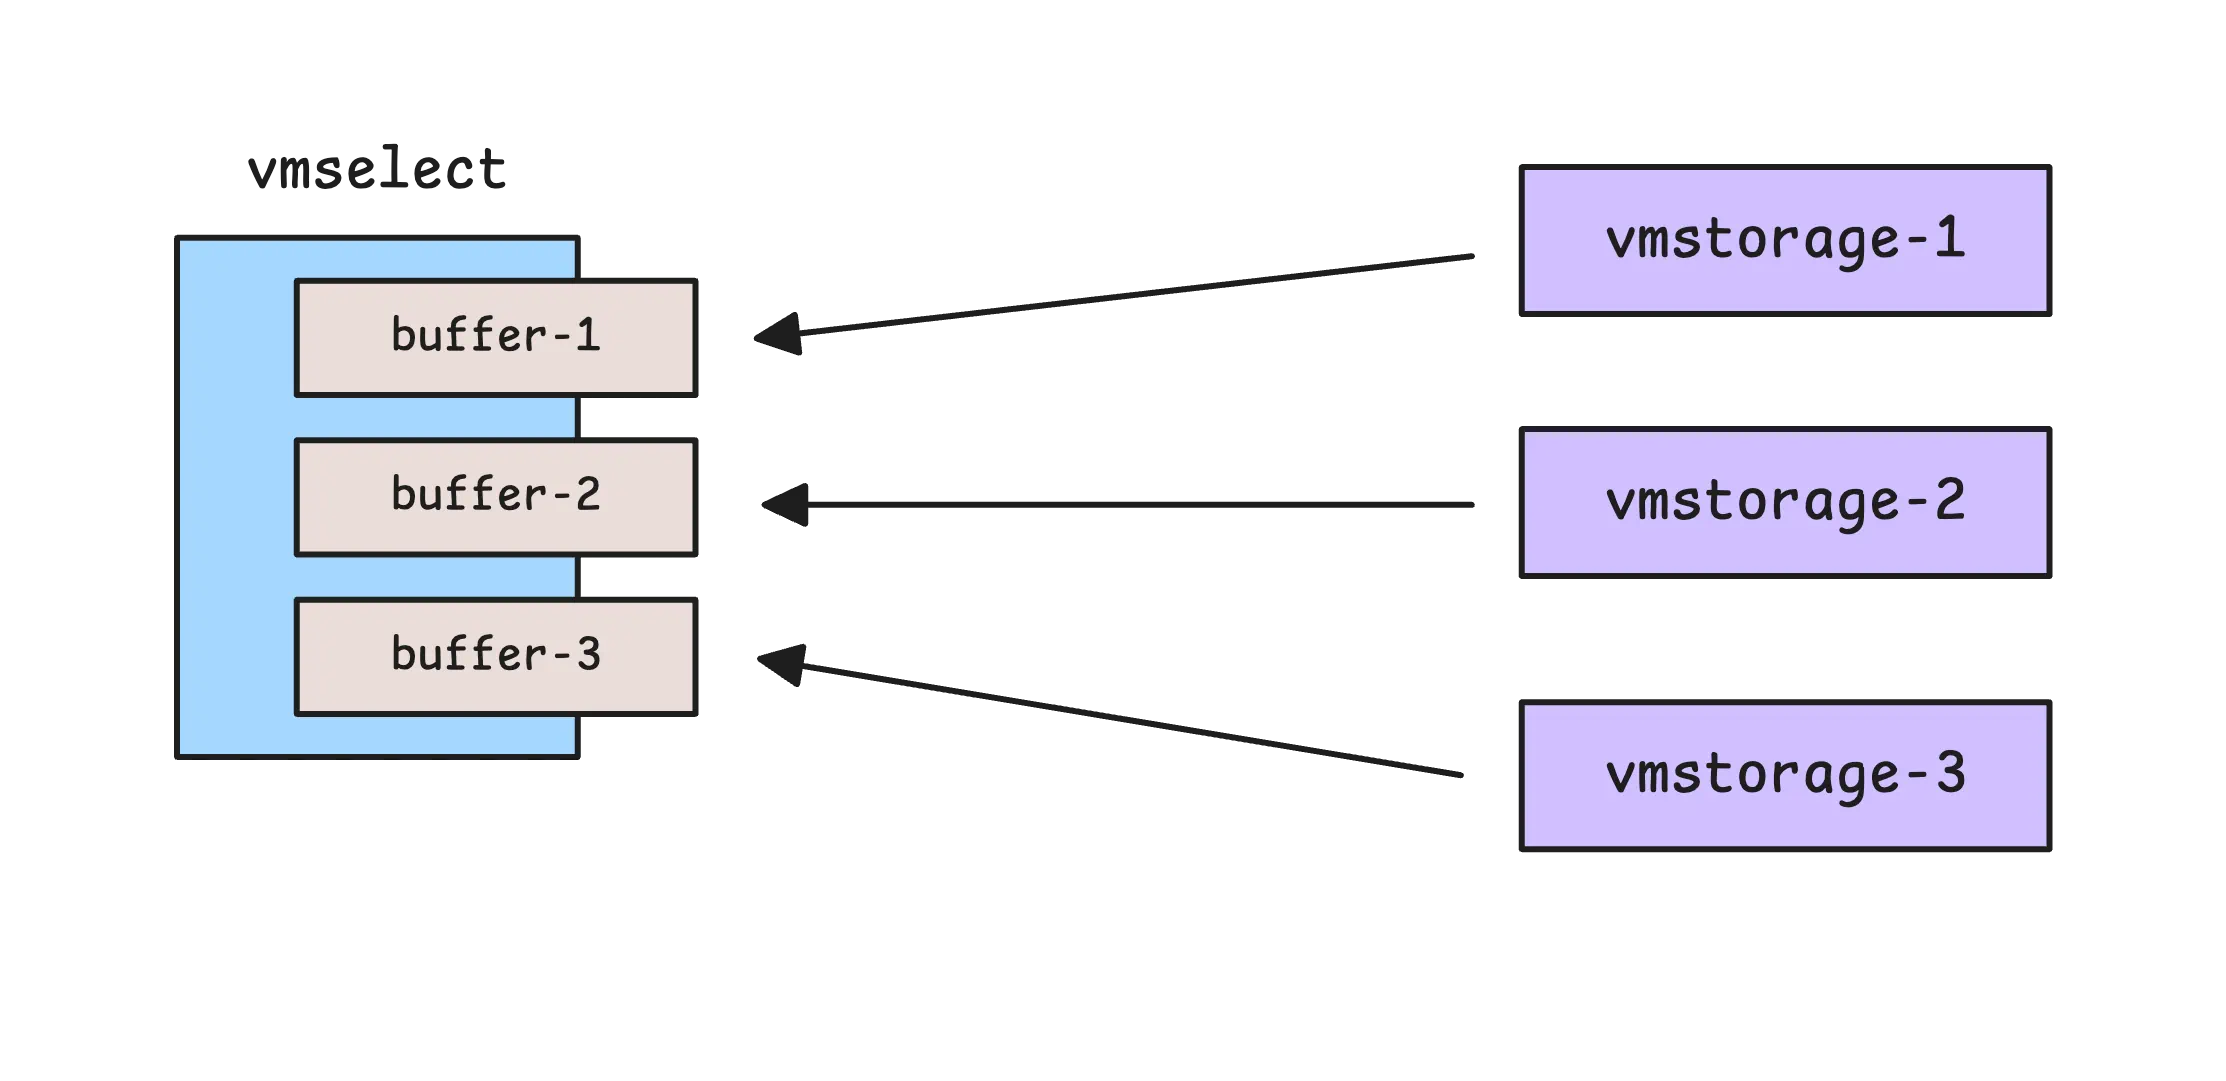
Each vmstorage node streams back matching data in blocks. These blocks are first stored in an in-memory buffer for each vmstorage node:
The buffer size depends on your system, ranging from 64 KB to 4 MB. It’s calculated as:
bufferSize = clamp(system memory / 1024, 64 KB, 4 MB)
So, if your system has 16 GB of memory, the buffer size is intended to be 16 MB but will be capped at 4 MB.
Note that, these buffers are not shared across queries. Instead, each query will have its own set of in-memory buffers.
To check how much memory is allocated for these buffers, use vm_tmp_blocks_max_inmemory_file_size_bytes. This shows the maximum size a temporary file can reach before spilling to disk. The actual size of a buffer after use is recorded in vm_tmp_blocks_inmemory_file_size_bytes. So, what these numbers tell you:
- If the actual sizes are much smaller than the maximum, the buffer might be too large.
- If they often hit the maximum, queries might be spilling to disk too frequently.
You can tune the buffer size using -search.inmemoryBufSizeBytes flag.
Any intermediate data that doesn’t fit in memory is spilled to temporary files on disk. In the cluster version, enable this by setting -cacheDataPath; files are written under -cacheDataPath/tmp/searchResults. In single‑node VictoriaMetrics, spilling is always enabled and files are written under -storageDataPath/tmp/searchResults.
When query load is high, you might notice increased disk I/O on vmselect nodes.
Metrics: Is your disk handling the load?
- How many temporary files have been created:
vm_tmp_blocks_files_created_total. - Free space available in the temporary directory:
vm_tmp_blocks_files_directory_free_bytes.
If some vmstorage nodes fail and can’t respond with their data, vmselect will still process the query with the available data by default. There are two scenarios here:
- For recent data, the available data is considered complete because when one vmstorage node fails, the other nodes receive the data for that failed node.
- For older data, the available data is partial because the failed node may have retained part of the data.
In the second case, this can be misleading since the results may be incomplete. To make errors more obvious, set the -search.denyPartialResponse flag. For better fault tolerance and data availability, you can organize vmstorage nodes into groups with a replication factor. More details on that here: vmstorage groups at vmselect.
Metrics: Are vmstorage nodes working properly?
- How many search requests were sent to each node:
vm_requests_total{action="search", type="rpcClient", name="vmselect"} - How many search requests failed:
vm_request_errors_total{action="search", type="rpcClient", name="vmselect"}
Evaluating & Memory Usage
#
As blocks arrive from multiple vmstorage nodes, vmselect merges them while keeping the data in order. If replication is enabled on vminsert, some data might be duplicated:
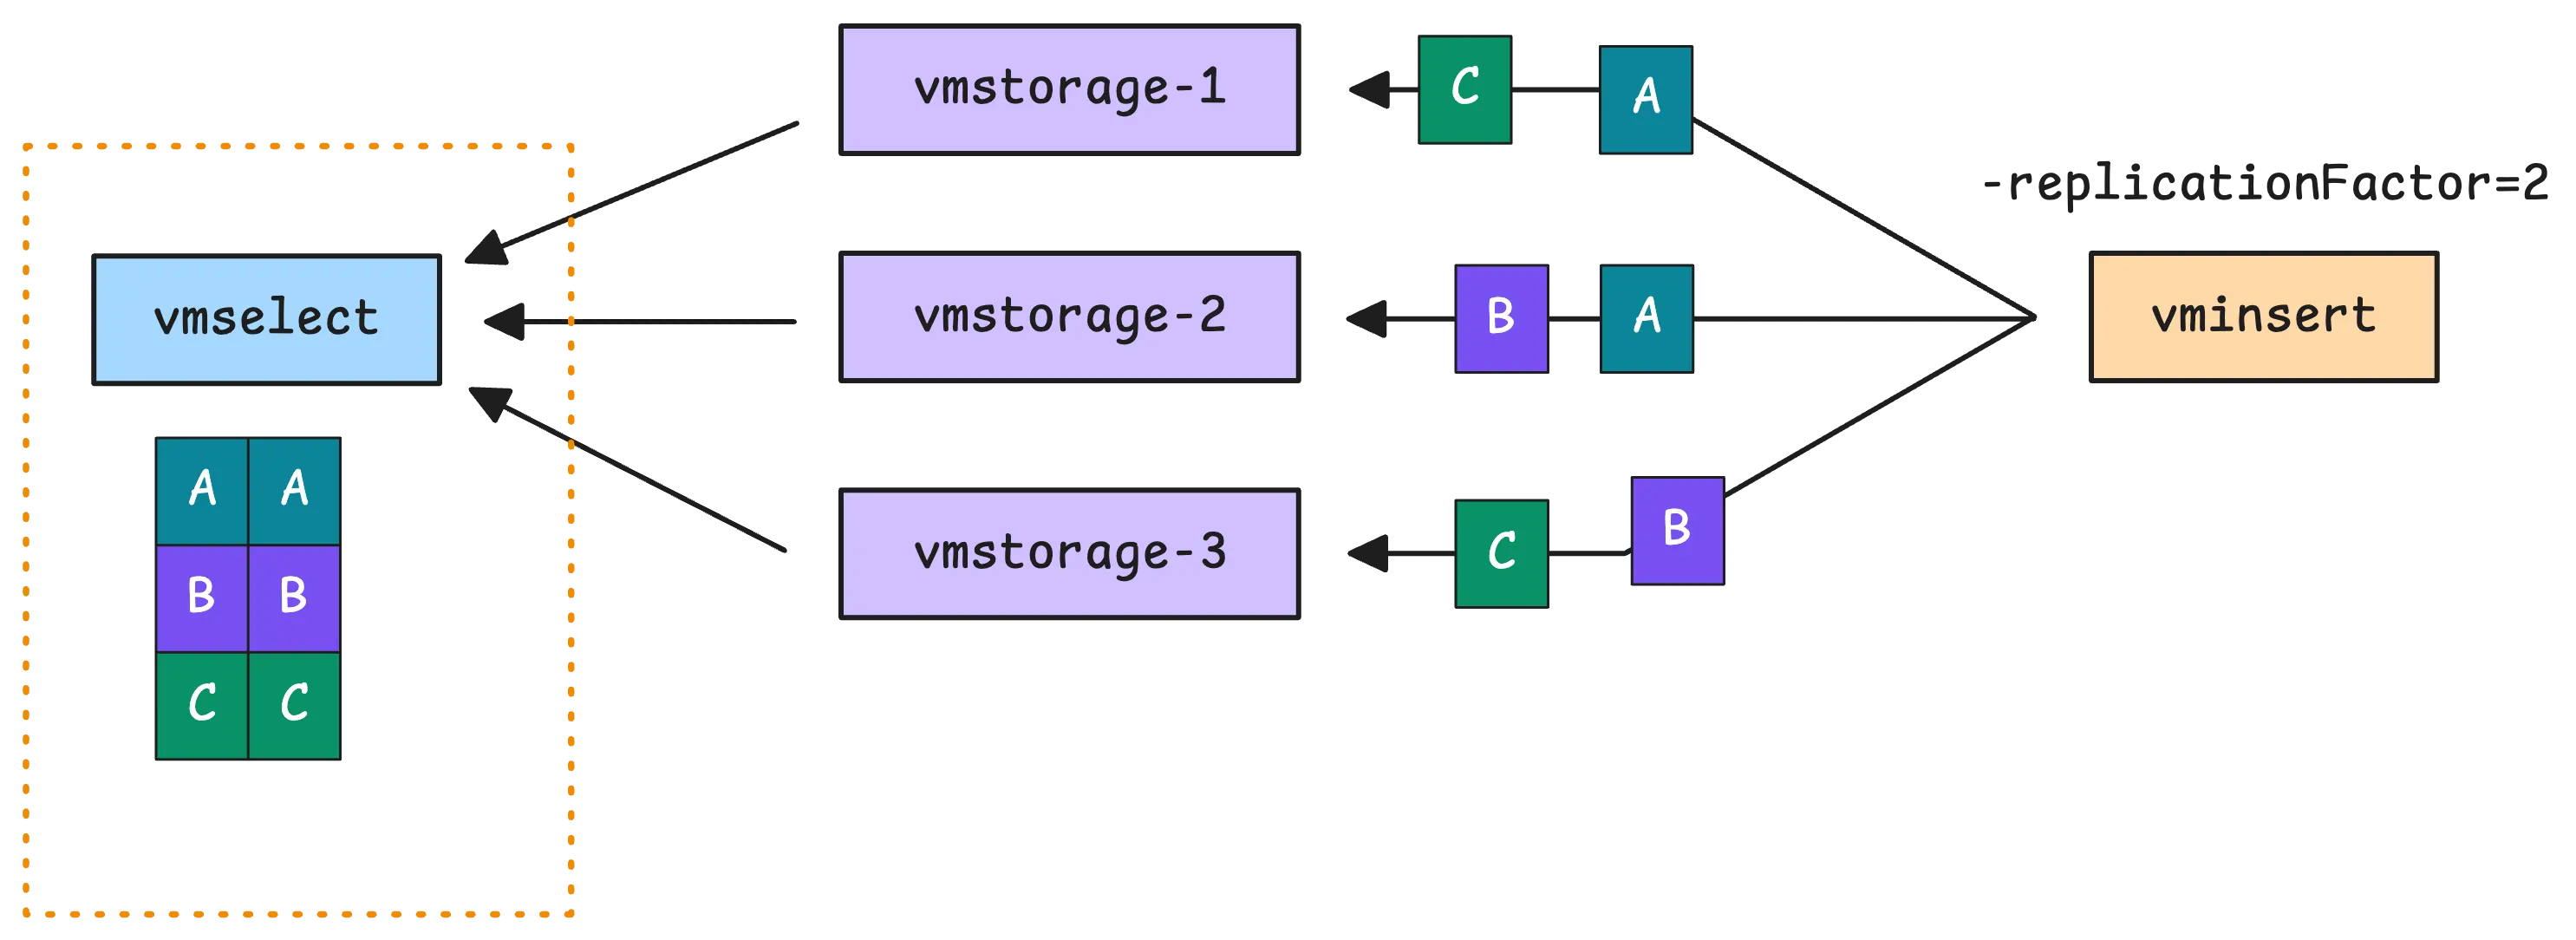
To handle this, vmselect should be set up with deduplication using a small interval, like 1 millisecond (-dedup.minScrapeInterval=1ms). When multiple data points have the same timestamp (or are within 1 millisecond), vmselect keeps only the latest one. Without deduplication, functions like sum_over_time, count_over_time, and quantile_over_time can produce incorrect results.
vmselect uses up to 60% of system memory (-memory.allowedPercent) for its activities. It will try to stay under this limit, but it doesn’t guarantee that it will use the full amount.
Before executing a query, vmselect estimates its memory usage and applies several safeguards. All running queries combined can use up to 25% of the allowed memory. If a query would exceed this limit, vmselect rejects it and returns an error.
Quiz: How much memory is allocated for running queries in your system?
Suppose your vmselect memory limit is 60 GiB:
- The allowed memory is 60 * 60% = 36 GiB.
- All running queries combined can use up to 25% of the allowed memory, which is 36 * 25% = 9 GiB.
To monitor memory usage more closely, set -search.logQueryMemoryUsage with a threshold. If a query crosses this limit, vmselect logs a warning and increments the vm_memory_intensive_queries_total metric. For stricter control, limit memory per query using -search.maxMemoryPerQuery.
Once the data is ready, vmselect processes it based on your query. If the query includes aggregation functions like sum, avg, min, or max, vmselect groups the data and runs calculations across multiple time series. This can be memory-intensive, especially for high-cardinality metrics.
To reduce memory usage, vmselect applies incremental aggregation where possible. Instead of loading everything at once, it processes time series in batches, updating results step by step.
Is incremental aggregation applied to your query?
To confirm it’s used, enable query tracing (trace=1) and look for a trace line like “rollup … with incremental aggregation …”; that indicates the optimized path ran.
For more complex functions like quantile or histogram_quantile, incremental processing isn’t an option. These functions need all data points at once to calculate an accurate result, which means higher memory usage.
Once the query is evaluated, vmselect caches the results if caching isn’t disabled. This rollup result cache uses up to 12.5% of allowed memory.
The cache avoids storing very recent data; anything from now-5m to now is left out (-search.cacheTimestampOffset) because this 5-minute window of data is considered incomplete. Some of the samples are delayed and haven’t been ingested into VictoriaMetrics yet.
This is an in-memory cache, but it can be made persistent by setting -cacheDataPath. With this option, cached results are saved to disk at -cacheDataPath/rollupResult when vmselect shuts down and reloaded on startup if available.
In rare cases, cached results become outdated due to major changes in underlying data. If needed, the cache can be reset with the -search.resetRollupResultCacheOnStartup flag or through the /internal/resetRollupResultCache API.
Metrics: Is rollup caching improving performance?
- Requests fully served from cache:
vm_rollup_result_cache_full_hits_total - Requests partially served from cache (with the remaining data fetched and processed in real-time):
vm_rollup_result_cache_partial_hits_total - Requests that had to be processed from scratch (cache miss):
vm_rollup_result_cache_miss_total
Last but not least, the data returned by vmselect has a delay of 30 seconds (-search.latencyOffset).
This means that the most recent data points will not appear in your chart immediately. The reason for this delay is to account for ‘incomplete data.’ The 30-second window represents the period during which vmselect considers data points to be potentially incomplete and therefore may be misleading.
Who We Are
#
Need to monitor your services to see how everything performs and to troubleshoot issues? VictoriaMetrics is a fast, open-source, and cost-efficient way to stay on top of your infrastructure’s performance.
If you come across anything outdated or have questions, feel free to send me a DM on X (@func25).
Leave a comment below or Contact Us if you have any questions!
comments powered by Disqus