- Blog /
- When Metrics Meet vminsert: A Data-Delivery Story
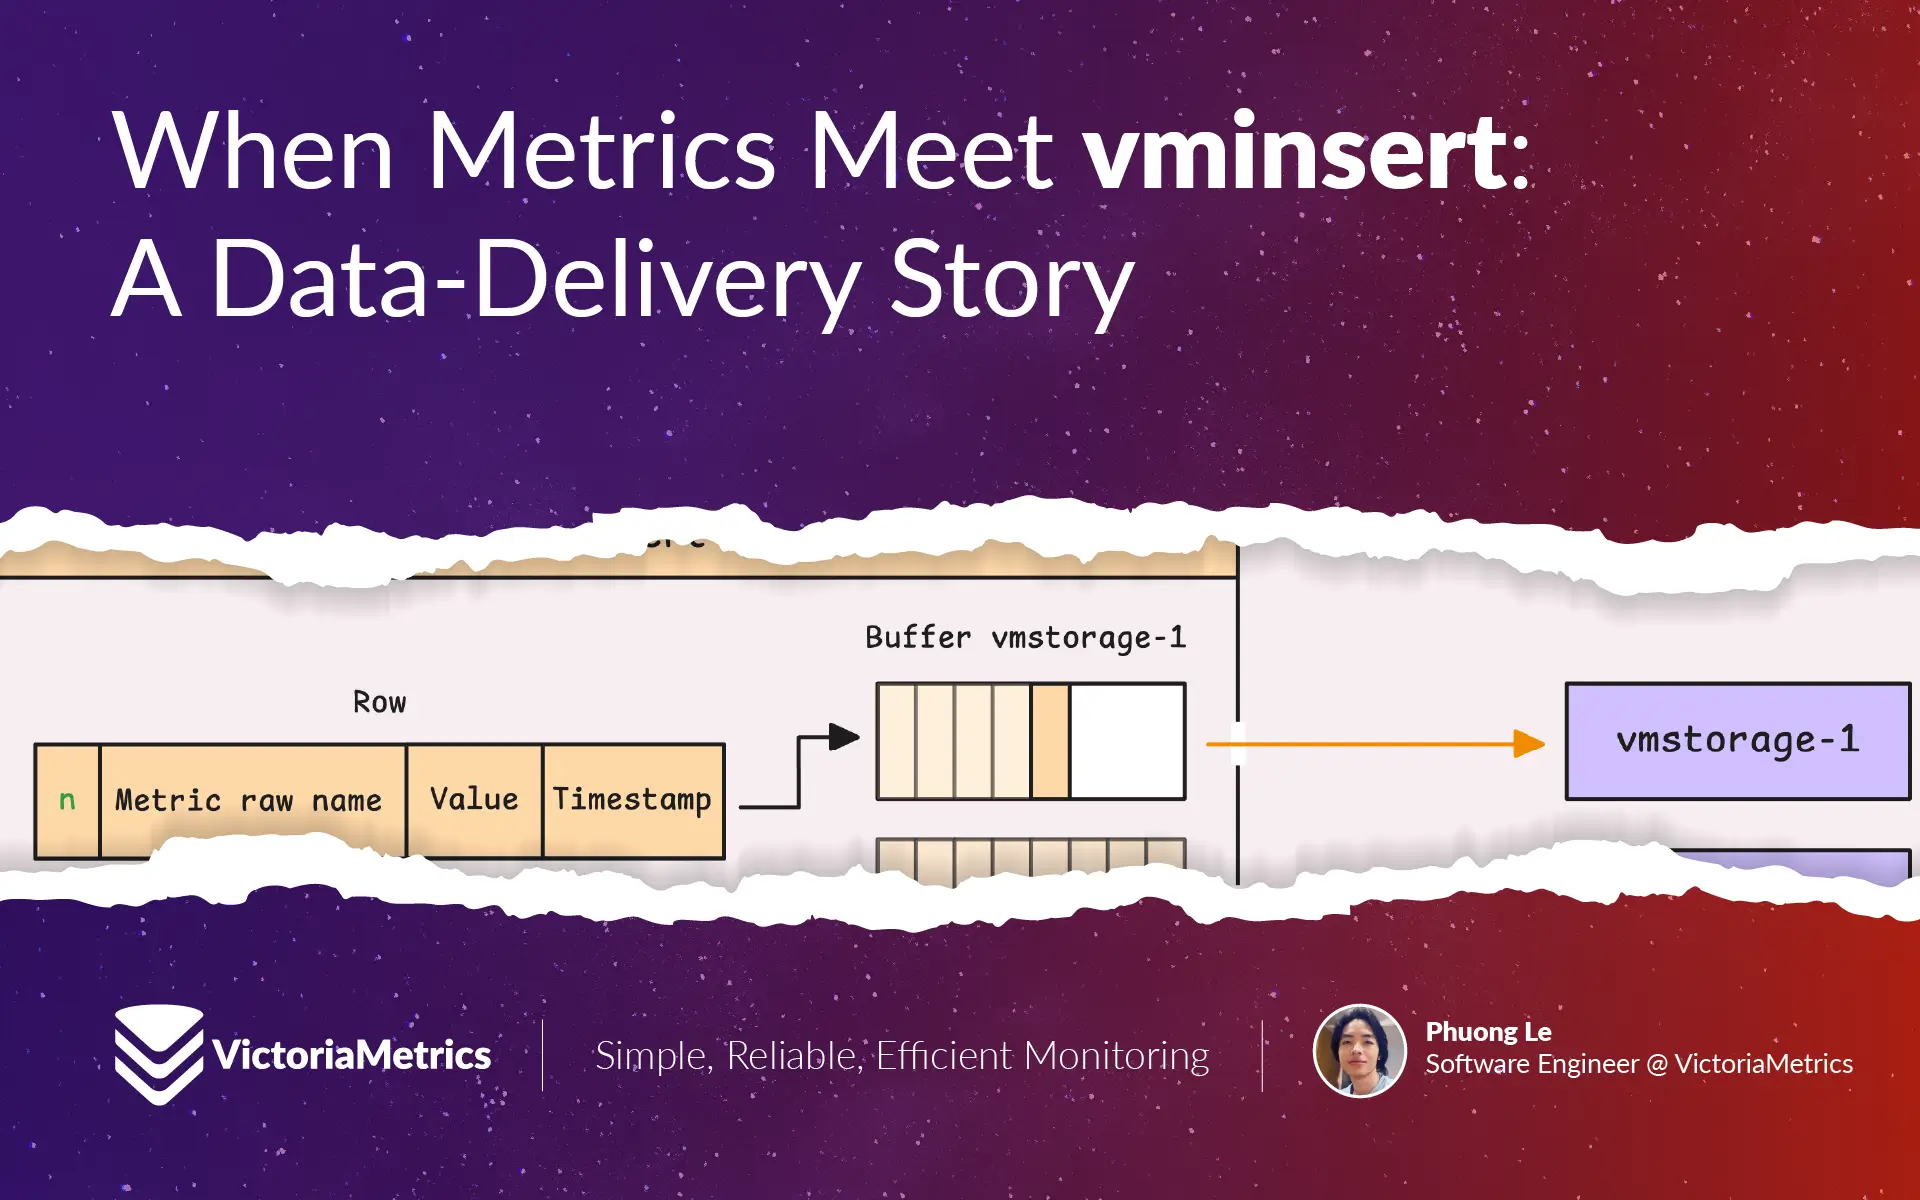
When Metrics Meet vminsert: A Data-Delivery Story
This piece is part of our ongoing VictoriaMetrics series where we break down how different components of the system do their thing:
- How VictoriaMetrics Agent (vmagent) Works
- How vmstorage Handles Data Ingestion
- How vmstorage Processes Data: Retention, Merging, Deduplication,…
- When Metrics Meet vminsert: A Data-Delivery Story (We’re here)
- How vmstorage’s IndexDB Works
- How vmstorage Handles Query Requests From vmselect
- Inside vmselect: The Query Processing Engine of VictoriaMetrics
Note: a few things to keep in mind
- Flags we mention will begin with a dash (
-), e.g.-remoteWrite.url. - Numbers we reference are the default values (these work well for most setups), but you can modify them using flags.
- If you’re using a Helm chart, some defaults might differ due to the chart’s configuration tweaks.
- Internal things are not intended to be relied on; they could be changed at any time.
If you have a topic in mind that you’d like us to cover, you can drop a DM to X (@func25) or connect with us on VictoriaMetrics’ Slack. We’re always looking for ideas and will focus on the most-requested ones. Thanks for sharing your suggestions!
0. Accepting connections
#
vminsert is pretty flexible when it comes to handling data. It supports multiple ingestion protocols and formats.
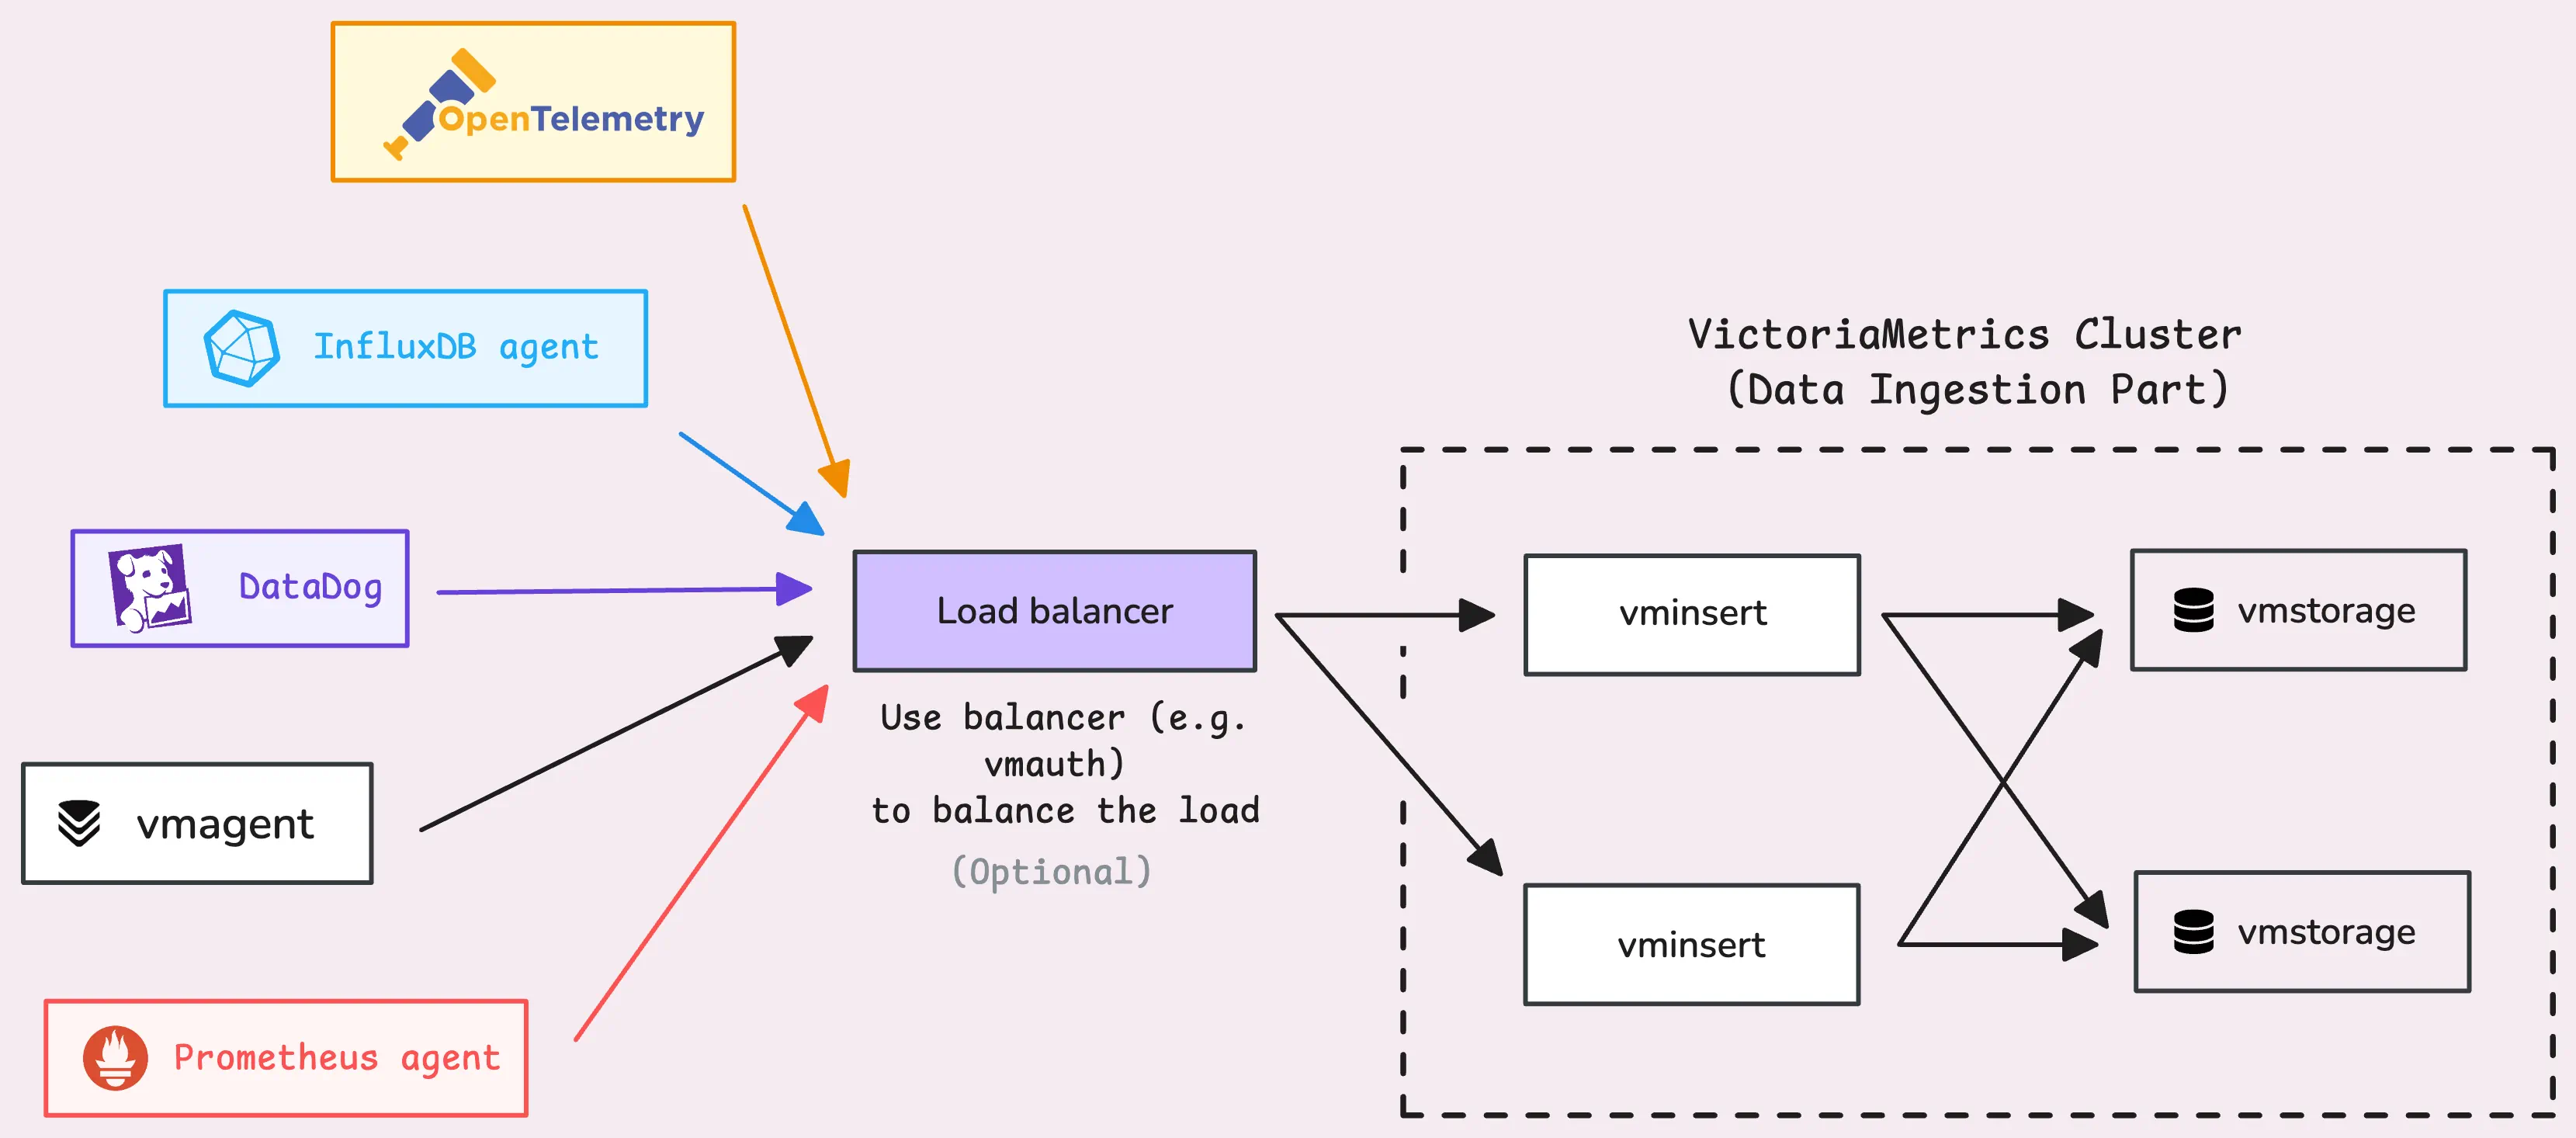
The general pattern looks something like this: http://<vminsert>:8480/insert/<accountID>/<suffix>. If you’re not using multi-tenancy, <accountID> defaults to 0. Here are some examples of the <suffix> endpoints for HTTP-based ingestion protocols:
- Prometheus remote write:
prometheus,prometheus/api/v1/write,prometheus/api/v1/push. - Prometheus import:
prometheus/api/v1/import,prometheus/api/v1/import/prometheus,prometheus/api/v1/import/prometheus - InfluxDB:
influx/write,influx/api/v2/write. - OpenTelemetry:
opentelemetry/api/v1/push,/api/v1/otlp/v1/metrics - Datadog:
datadog/api/v1/series,datadog/api/v2/series - And more…
Even though each protocol has its own unique way of talking to vminsert, under the hood they all follow the same flow. The raw data shows up at the protocol-specific endpoint, then a parser steps in to transform it into an internal format. After that, the data runs through a shared processing pipeline before finally heading off to the storage nodes.
Here’s the simplified process: Raw data -> Protocol-specific parser -> Converted to internal format -> Common pipeline -> Storage nodes.
Now, let’s get into how that processing pipeline works inside vminsert.
1. Handshake
#
Before anything else, vminsert needs to know where the vmstorage nodes are, this is set up using the -storageNodes flag. If you’re using the cluster Helm chart, good news — it takes care of that for you.
Once vminsert figures out where the storage nodes (aka vmstorage) live, it establishes a TCP connection with them.
After dials, it’s the handshake process. But it’s not just a simple “hello”. During this, vminsert asks vmstorage what compression method it prefers. They then settle on a shared compression algorithm before any data starts moving around. You can turn off compression altogether (-rpc.disableCompression). This can help lighten the CPU load on vminsert, but you’ll need more network bandwidth to handle the extra data.
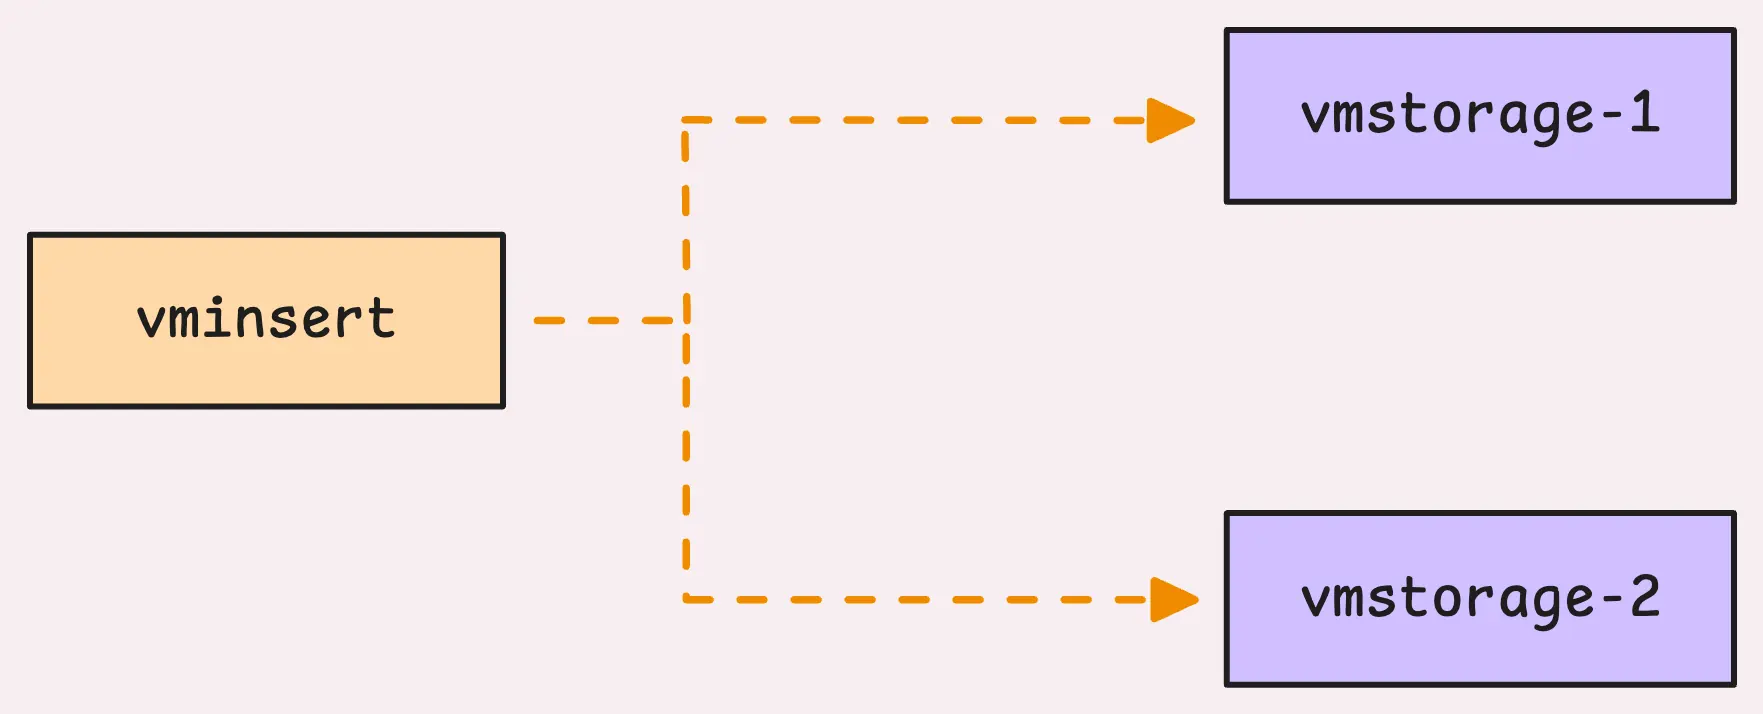
There are some metrics that can help you keep an eye on this process:
- How many connection (dial) attempts failed:
vm_rpc_dial_errors_total. - How often the handshake failed:
vm_rpc_handshake_errors_total.
The handshake process also works as a health check, you’ll probably notice these metrics pop up not just during startup but also while everything is running.
2. Parse and Relabel
#
When data reaches vminsert, the first step is to uncompress, read, and parse it. The format depends on the source, could be Datadog, Graphite, Prometheus, or remote write (which is often compressed with zstd or snappy).
2.1 Parsing
#
vminsert can only handle a certain number of requests at the same time, capped at twice the number of CPU cores (-maxConcurrentInserts). If more requests come in than it can handle, they’ll sit in a queue for up to 1 minute (-insert.maxQueueDuration). After that, they’re rejected.
Tip: Useful metrics
- How often the concurrency limit is hit is tracked by:
vm_concurrent_insert_limit_reached_total. - How many requests are timing out after waiting too long (> 1 minute) is logged under:
vm_concurrent_insert_limit_timeout_total.
This can give you insight into whether you need to adjust the concurrency settings or allocate more resources to vminsert.
2.2 Relabeling
#
Once the raw bytes are parsed into a more structured format (such as rows with metric names, labels, timestamps, and values), the next step is relabeling. This is done according to the configuration specified using the -relabelConfig flag, which can point to either a local file or a remote URL.
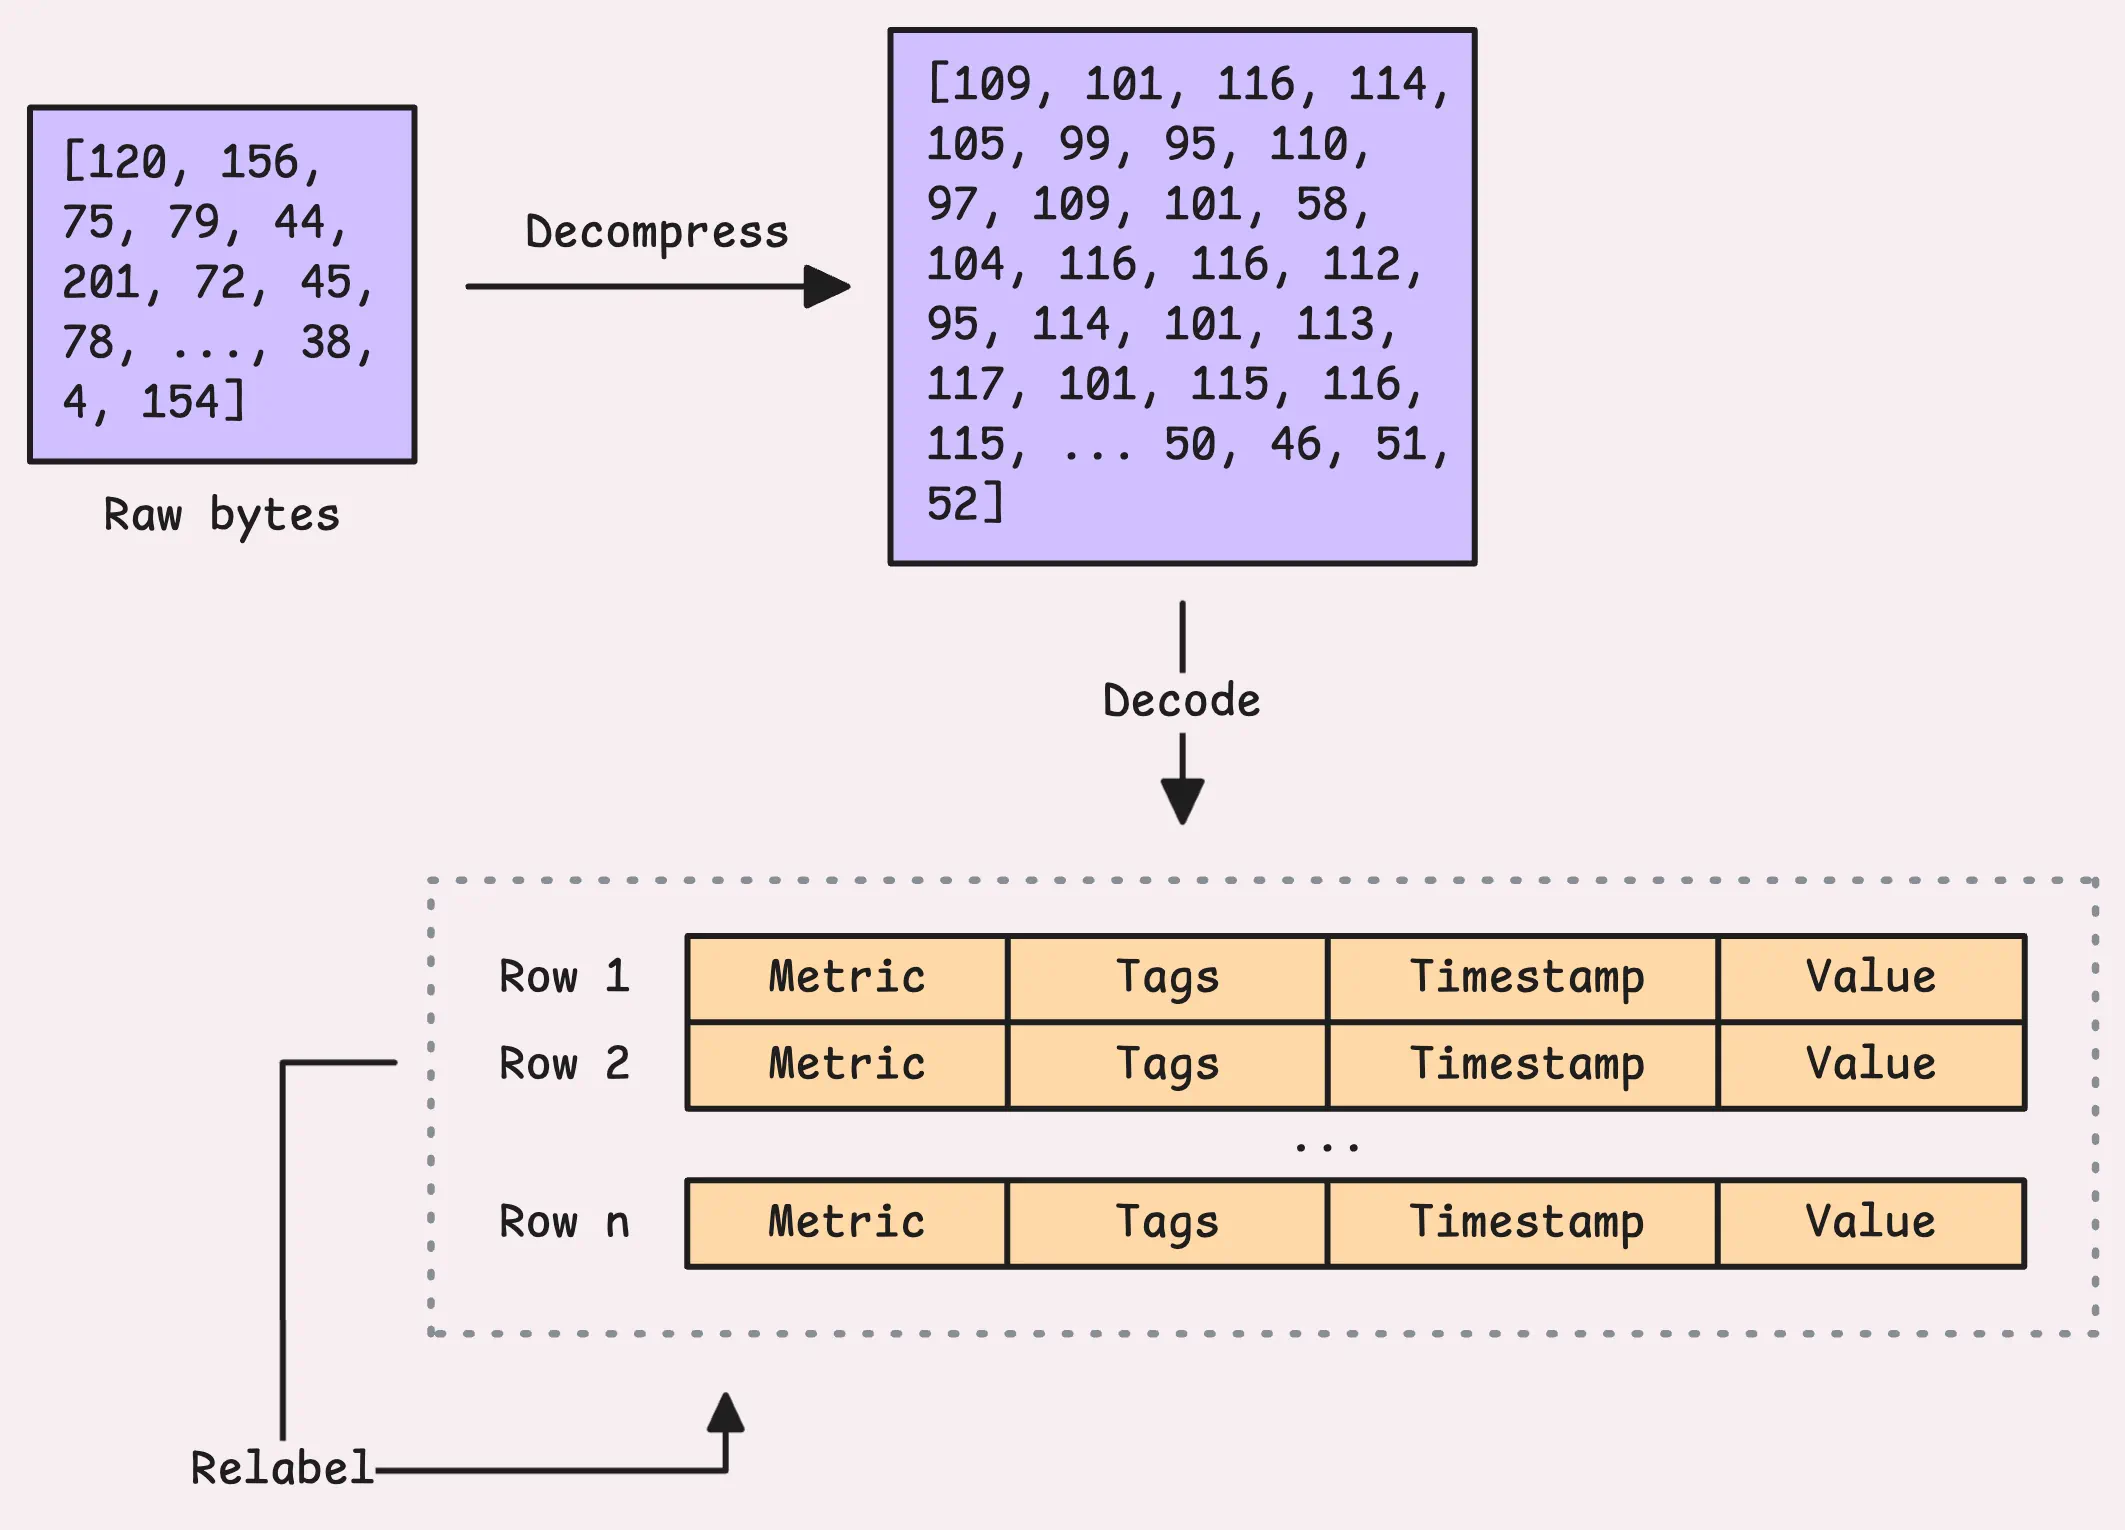
Relabeling can also drop some time series during the process, so the number of rows coming in from the request and the number sent to vmstorage might not match.
Here are the metrics that help you track this step:
- The total rows read from the raw data is logged as:
vm_protoparser_rows_read_total. - How many metrics were dropped (discarded) during the relabeling process:
vm_relabel_metrics_dropped_total. - The total rows left after relabeling are recorded under:
vm_rows_inserted_total.
2.3 Marshaling
#
After relabeling, the rows are prepared in a format that vmstorage can process. This is called marshaling.
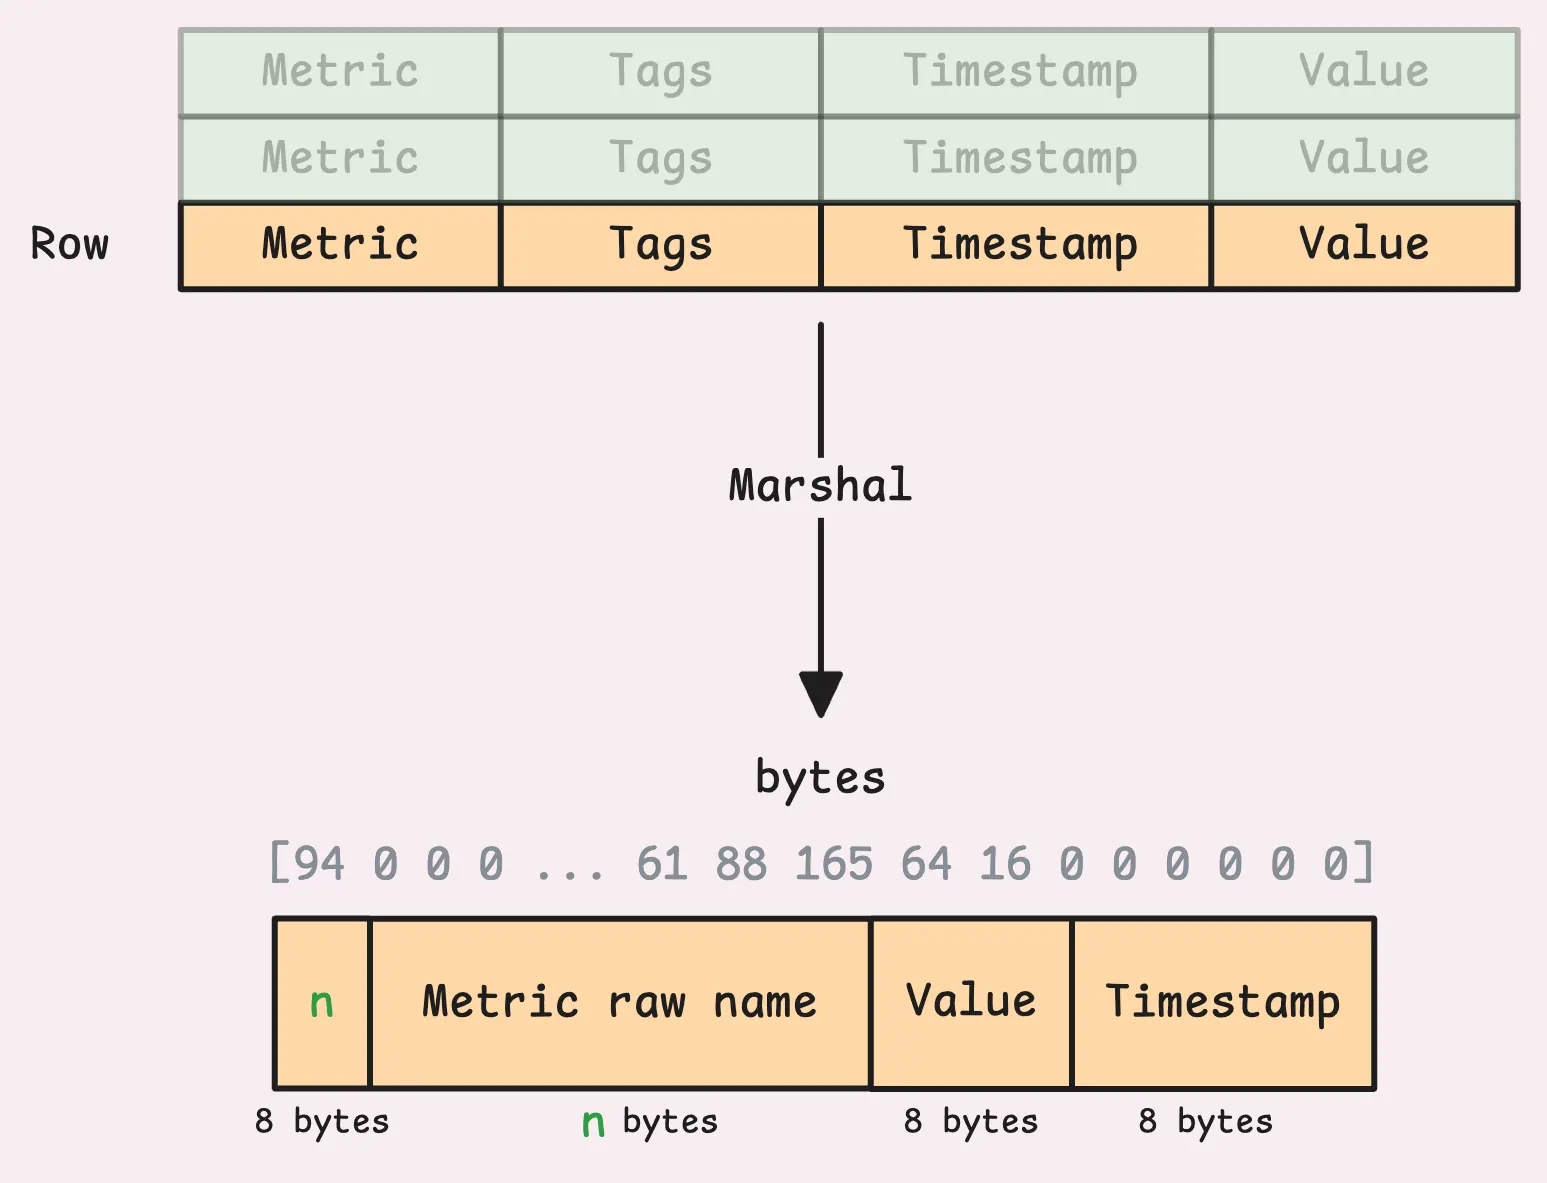
The marshaled data includes things like the raw metric name (include the metric name and labels), and account/project IDs (if multi-tenancy is not enabled, they will be 0). At this stage, there are some limits on labels to watch out for: -maxLabelsPerTimeseries (default 40), maxLabelNameLen (default 256 bytes), -maxLabelValueLen (default 4 KB).
If any restriction gets violated, the metric gets dropped. You’ll probably see this in the logs, something like ignoring series with... showing up. Another way to catch it is by keeping an eye on the vm_rows_ignored_total metric. The most noticeable issue is the first one, metrics with 40 or more labels getting dropped. That’s the one you’re most likely to run into.
Before v1.108.0, this restriction behaved differently. You can check out the CHANGELOG for more details.
3. Sharding and Buffering
#
Once the data gets processed, vminsert figures out which storage node should handle each row of data. That said, vminsert is set up to handle sharding (plus replication, which we’ll talk about in Section 4) and splits the data across multiple vmstorage nodes.
Each node takes on its share of the metrics. So, if you’ve got more than one vmstorage node set up (-storageNode), sharding just kicks in automatically, no extra work on your end.
“Okay, but how is the data sharded? What happens when a node goes down?”
Internally, vminsert uses Rendezvous hashing with the metric name and labels (and if you’ve enabled multi-tenancy, it includes the account and project IDs too). The main advantage is that the addition or removal of a node from the cluster doesn’t lead to a full re-shuffling of placements for all the input keys among the cluster nodes.
Let me give you some examples. Assume the letters a, b, c, d, e are node names:
a,b,c -> a,e,c: When a new nodeeis added, it takes over a portion of the keys from the existing nodesa,b, andc. But the data previously assigned toawill now only choose betweenaande.a,b,c -> a,b,c,d: Adding a new nodedredistributes the keys from all the existing nodes (a,b, andc) evenly. Each node, including the new one, will handle about 1/N of the keys.a,b,c -> a,c: Removing a node, such asb, redistributes its keys to the remaining nodes,aandc. However, data that originally went toawill still go toa, and the same applies toc. Only the data that was specifically assigned tobwill change.
If you specify storage nodes in a different order, like -storageNode=a,b,c, -storageNode=b,c,a, or -storageNode=a,c,b, it doesn’t affect how the hashing works for sharding.
Now, after deciding on the right node, the data is placed into that node’s buffer, where it waits to be sent over the network.

vminsert allocates a chunk of its memory, probably 12.5% for these buffers. If you’ve got 8 storage nodes, each one gets an equal share, meaning 12.5% divided by 8. But there’s a hard upper cap of 30 MB per buffer to control how much data gets sent to vmstorage at once. For now, let’s assume each buffer is at the 30 MB limit.
If the storage node is ready and there’s space in the buffer, the data is added successfully, and that’s the end of it. Simple.
But what if the buffer is full? Or worse, what if the node is down or unreachable? To prevent losing data, vminsert has a rerouting mechanism. This means it redirects the data to other healthy storage nodes, making sure everything keeps moving even when issues pop up.
3.1 Rerouting
#
From vminsert’s perspective, a storage node can be in one of several states:
- Ready: The node is healthy, ready to take in data, and its buffer has enough room for new data.
- Overloaded: There’s too much incoming data. A node is considered overloaded when it’s handling over 30 KB of unsent data in its buffer.
- Broken: The node is temporarily unhealthy. This could be due to network issues, concurrency limits on the vmstorage side, or any error that causes it to reject data.
- Readonly: The node is in readonly mode, often due to low disk space. It won’t accept new data but will acknowledge vminsert with a readonly response.
To handle these situations, vminsert has two kinds of rerouting: one for overloaded nodes and another for nodes that are broken or readonly.
Overloaded Rerouting
#
Overloaded rerouting is turned off by default (-disableRerouting=true). The reason? While spreading the load might seem like a good idea, it can actually backfire and cause a chain reaction.
Instead, by default, vminsert blocks incoming requests until there’s enough space in the buffer. Alternatively, you can configure it to drop samples instead (-dropSamplesOnOverload).
“Why not just spread the load to other nodes? That sounds better.”
It’s a valid question, and in fact, spreading the load to other nodes used to be the default behavior in earlier versions.
However, this strategy can lead to new challenges, especially when dealing with entirely new timeseries. As I mentioned earlier, “the same timeseries will always go to the same storage node”. But with rerouting, each node ends up needing to register these new timeseries. This process is quite resource-intensive and can strain the system significantly (you can check out more details in vmstorage discussion).
This can lead to unhealthy nodes or even OOM (Out of Memory) crashes. When one node crashes, it again puts extra pressure on the remaining ones, potentially triggering a domino effect.
However, if you’re confident your storage nodes can handle the burst, you can enable overloaded rerouting by setting -disableRerouting=false.
Unavailable rerouting
#
Unavailable rerouting works a bit differently. It’s enabled by default (-disableReroutingOnUnavailable=false) and steps in when a node is broken or readonly.
When rerouting is active and a node fails, vminsert redirects its data to the remaining healthy nodes. The data is divided evenly, so if there are n healthy nodes, each one gets 1/n of the failed node’s load. If you decide to turn it off, vminsert will block incoming requests and wait for the node to recover.
Tip: Useful metrics
- Rows successfully added to the buffer:
vm_rpc_rows_pushed_total. - Rows rerouted away from a specific node X:
vm_rpc_rows_rerouted_from_here_total. - Rows received as rerouted data from another node Y (X -> Y):
vm_rpc_rows_rerouted_to_here_total. - Rows dropped due to overload:
vm_rpc_rows_dropped_on_overload_total, only worth monitoring if you enable-dropSamplesOnOverloadflag.
These metrics can give you a good sense of whether rerouting is working as expected or not.
4. Replication and Sending Data to vmstorage
#
For each storage node, vminsert runs a dedicated worker to keep an eye on its buffer. The worker grabs all the data in the buffer and sends it off to the storage node. If you’ve set a replication factor (-replicationFactor), the same data copy gets sent to multiple nodes, with each copy going to the next node in sequence (node A -> node B -> node C).
If some storage nodes aren’t working, the process skips them and tries the others:
- After checking all nodes, if at least one copy of the data is successfully sent, partial replication is accepted. You can keep track of how many rows ended up partially replicated by checking the vm_rpc_rows_incompletely_replicated_total metric.
- If all nodes are down, vminsert waits 200ms and retries until at least one node is available.
Before the actual data is sent, vminsert sends a small 8-byte header indicating the size of the data. This tells vmstorage how many bytes it should expect, so it can decide whether to reject it or allocate enough memory to handle it. After that, the actual data buffer is sent.
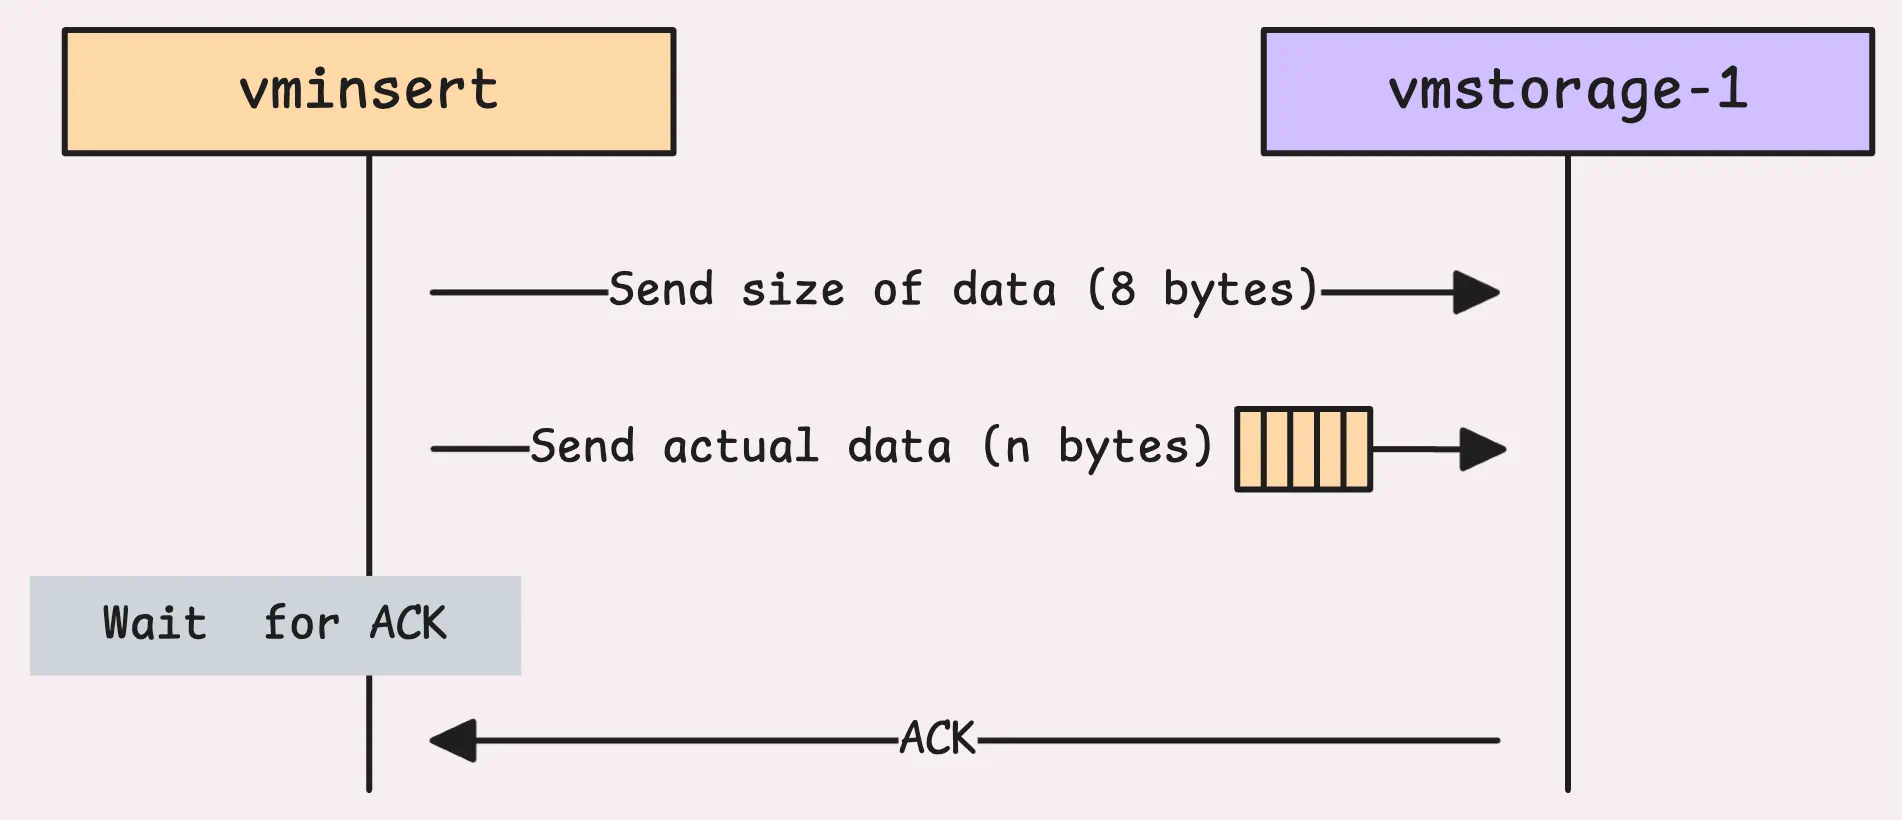
Once the data is sent, vminsert waits for a response (or acknowledgment) from vmstorage, a single byte that confirms what happened:
- A response value of 1 means the data was successfully received and processed.
- A response value of 2 means the storage node is in read-only mode and couldn’t accept new data.
- Any other value signals an error while reading the data.
The vmstorage will immediately send an ACK to indicate it has received the data successfully, even if it’s failed to process later. If you’ve already checked out How vmstorage Turns Raw Data into Organized History, this might sound familiar. And just like that, the data flows in as a stream of blocks.

And now, the story shifts to vmstorage’s side of things, what it would do with the data after it receives it.
Read next: How vmstorage’s IndexDB Works
Who We Are
#
Need to monitor your services to see how everything performs and to troubleshoot issues? VictoriaMetrics is a fast, open-source, and cost-efficient way to stay on top of your infrastructure’s performance.
If you come across anything outdated or have questions, feel free to send me a DM on X (@func25).
Leave a comment below or Contact Us if you have any questions!
comments powered by Disqus