- Blog /
- Announcing vmestimator: Real-time Cardinality Estimations for VictoriaMetrics and Prometheus

Announcing vmestimator: Real-time Cardinality Estimations for VictoriaMetrics and Prometheus
Share:


Cardinality problems usually begin with a small change that looks harmless: you add a label, and suddenly one metric turns into thousands of unique series. Cardinality explosions are often caught only after performance degrades. And at that point, your observability stack may be degraded and painful to troubleshoot.
vmestimator is a new project specifically designed to follow cardinality trends in real time and send you alerts before they turn into a real problem.
When Cardinality Becomes a Problem
#
Metric cardinality is the number of unique time series your monitoring system stores across all combinations of metric names and labels. For example, http_requests_total{path="/login"} and http_requests_total{path="/checkout"} are two distinct series because the path label differs.
You can see how highly variable labels such as user_id or pod_name can drastically increase the cardinality of your time-series database. When labels are unbounded or change frequently, your system has to ingest and index more series, increasing pressure on the monitoring stack.
Announcing vmestimator
#
vmestimator is a new open-source tool (Apache-2.0) from VictoriaMetrics that continuously tracks cardinality. When coupled with vmalert, it can send you alerts identifying offending jobs within minutes of a spike in cardinality.
Getting alerts is the main use case, but it can also be useful to:
- Track global cardinality across all active series.
- Measure cardinality per metric name to see which metrics create the most series.
- Drill down into cardinality per job to identify the services behind cardinality growth.
- Measure per-tenant cardinality for usage analysis in multi-tenant setups.
- Estimate churn rate to find workloads that continuously create and replace series.
- Follow long-term cardinality trends over time.
- Support capacity planning by showing how cardinality evolves across jobs, metrics, or tenants.
How vmestimator Works
#
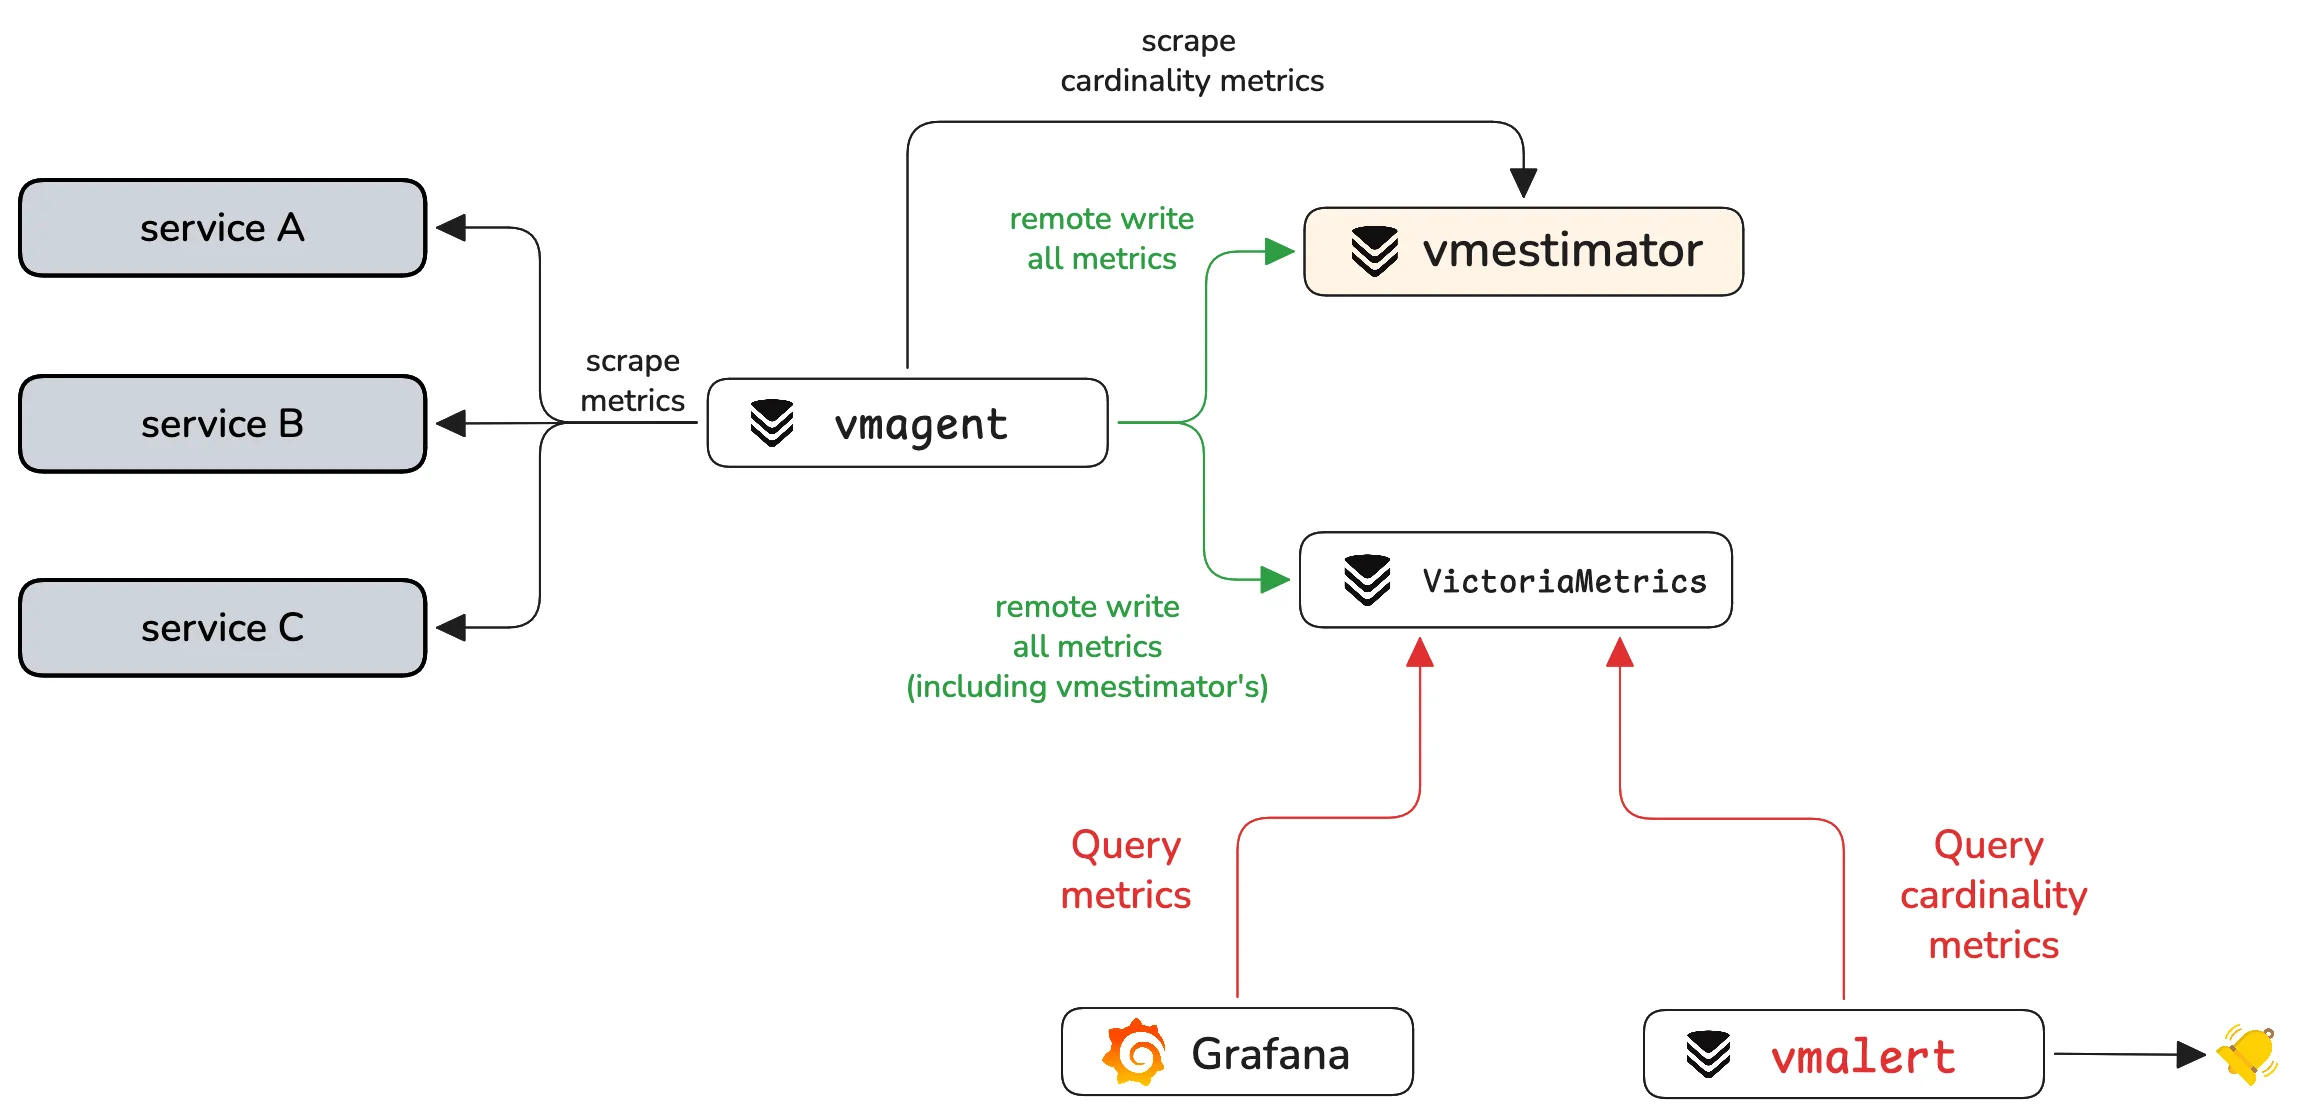
vmestimator runs at the collection point, deriving cardinality estimates from the incoming stream and exposing them as Prometheus‑compatible metrics for scraping and alerting. It’s usually deployed alongside vmagent and observes ingested data without interfering with the ingestion path.
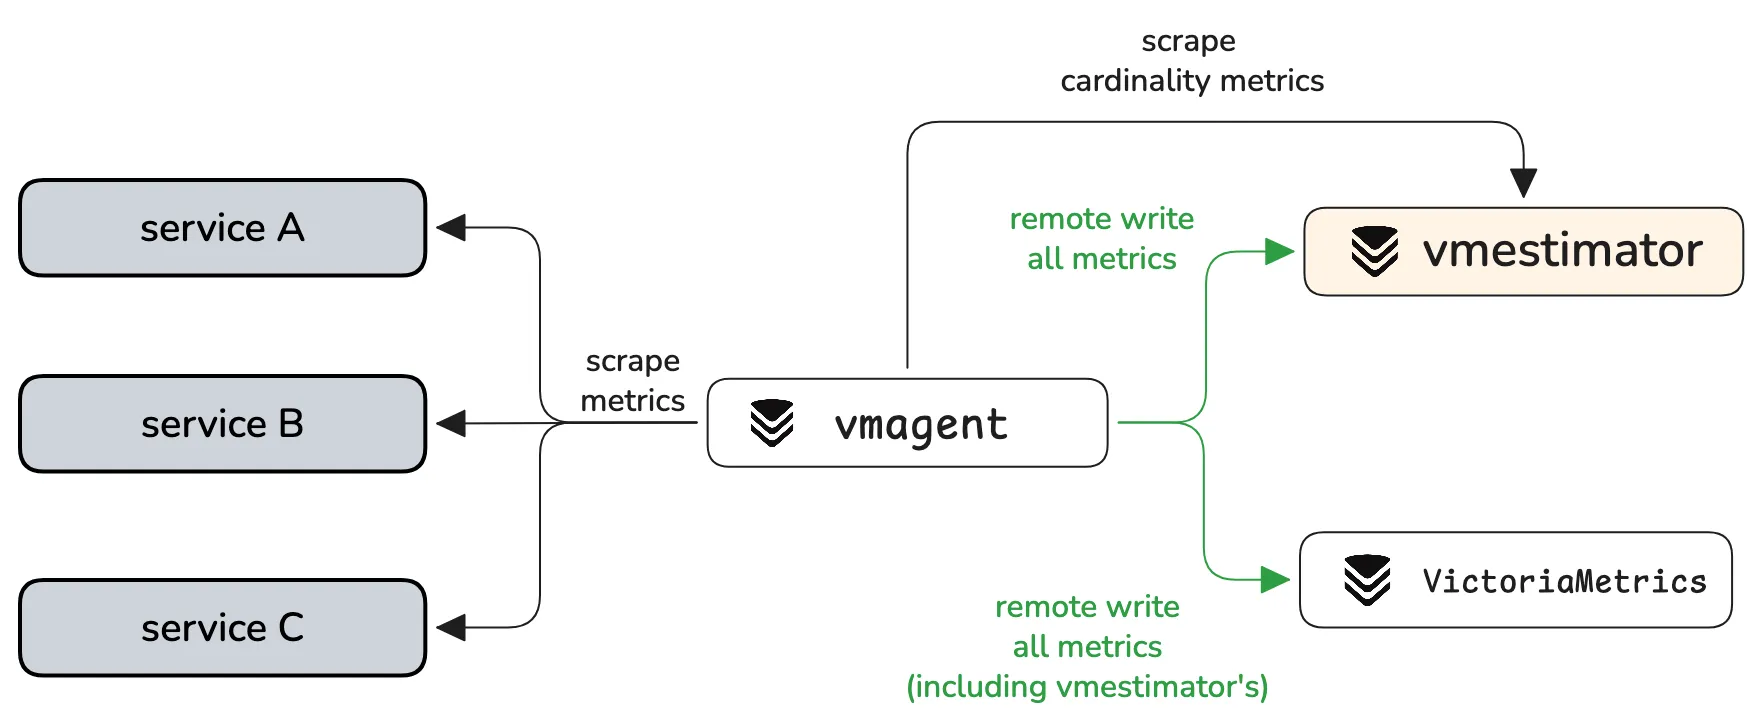
vmestimator output fits naturally into any Prometheus-compatible observability system. You can store the results in VictoriaMetrics, query them with the API, trigger alerts with vmalert, and visualize cardinality estimates in Grafana to spot trends.
Get Started with vmestimator
#
To get started with vmestimator, grab the example config and save it as streams.yaml. Then download the binary for your architecture or run it as a Docker image:
docker run --rm \
  -p 8490:8490 \
  -v /path/to/streams.yaml:/streams.yaml \
  docker.io/victoriametrics/vmestimator:latest \
  -config=/streams.yaml
Behavior is controlled in streams.yaml, where you define parameters such as the estimation interval and arbitrary label dimensions. For instance, to estimate cardinality globally with a 15-minute interval:
# streams.yaml
- interval: '15m'
If you want to group cardinality per label name, add group_by. For example:
# streams.yaml
- interval: '15m'
  group_by: ['__name__']
To view all options, see the configuration reference.
Once configured, vmestimator exposes its estimates and operational metrics at /metrics so that vmagent or Prometheus can scrape them like any other target.
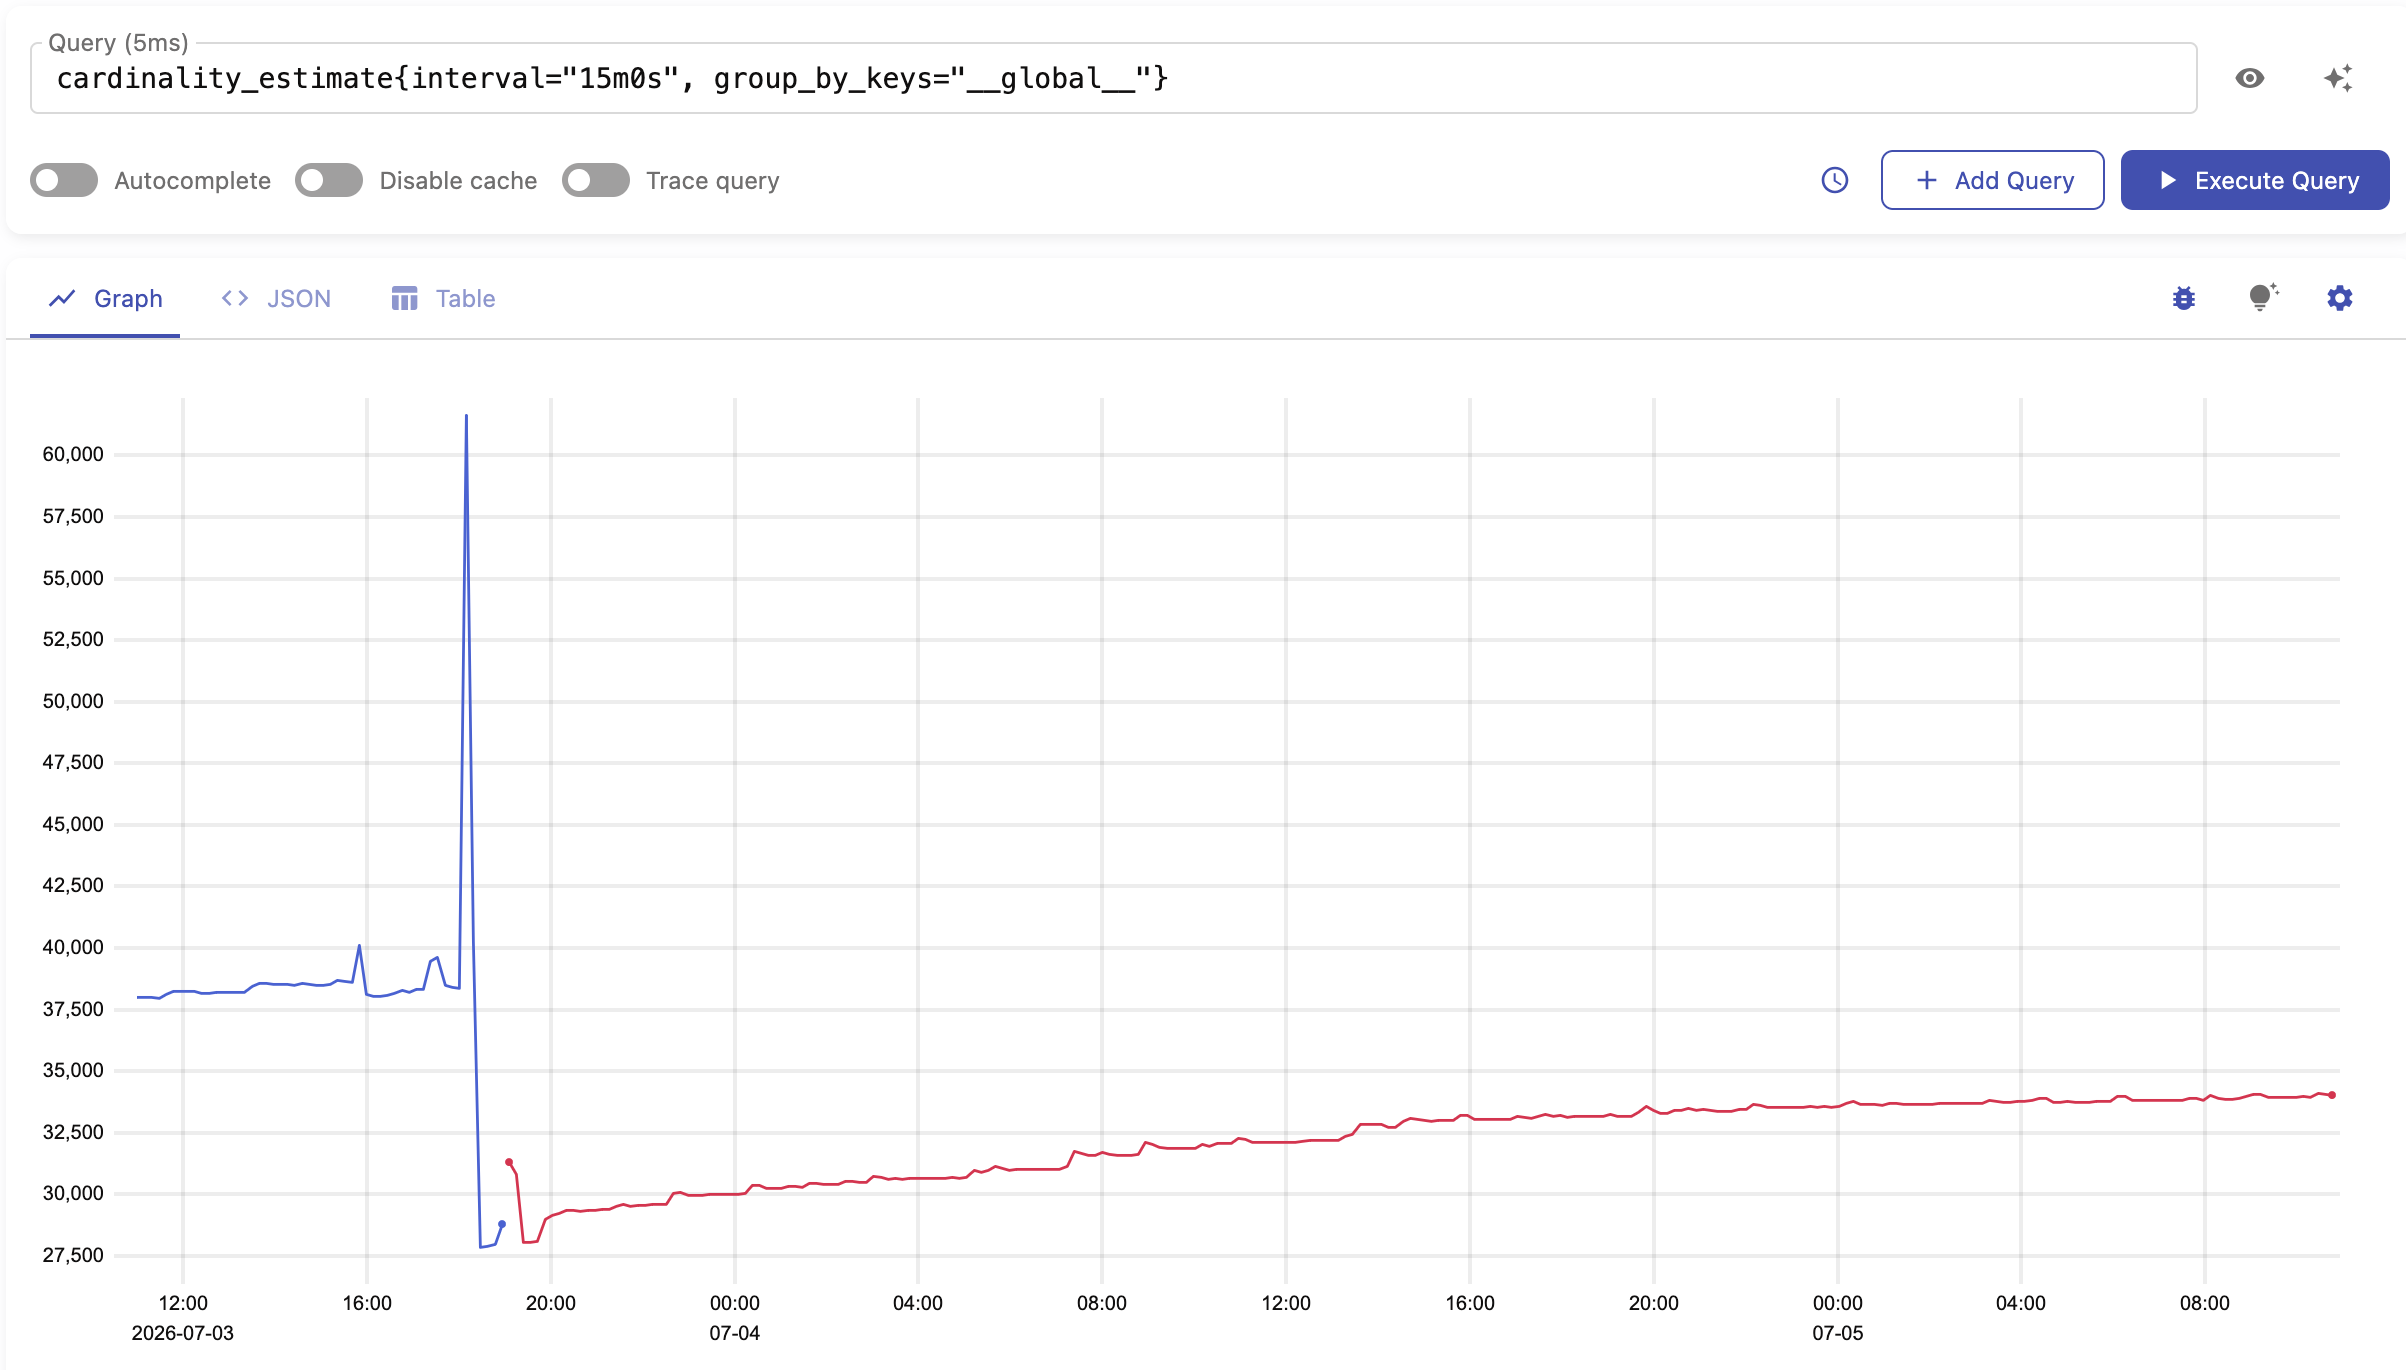
The key metric is called cardinality_estimate, which shows the current estimate over a given interval. For example, the following query shows the global estimate over a 15-minute interval (you can try it directly in the VictoriaMetrics Playground).
cardinality_estimate{interval="15m0s",group_by_keys="__global__"}
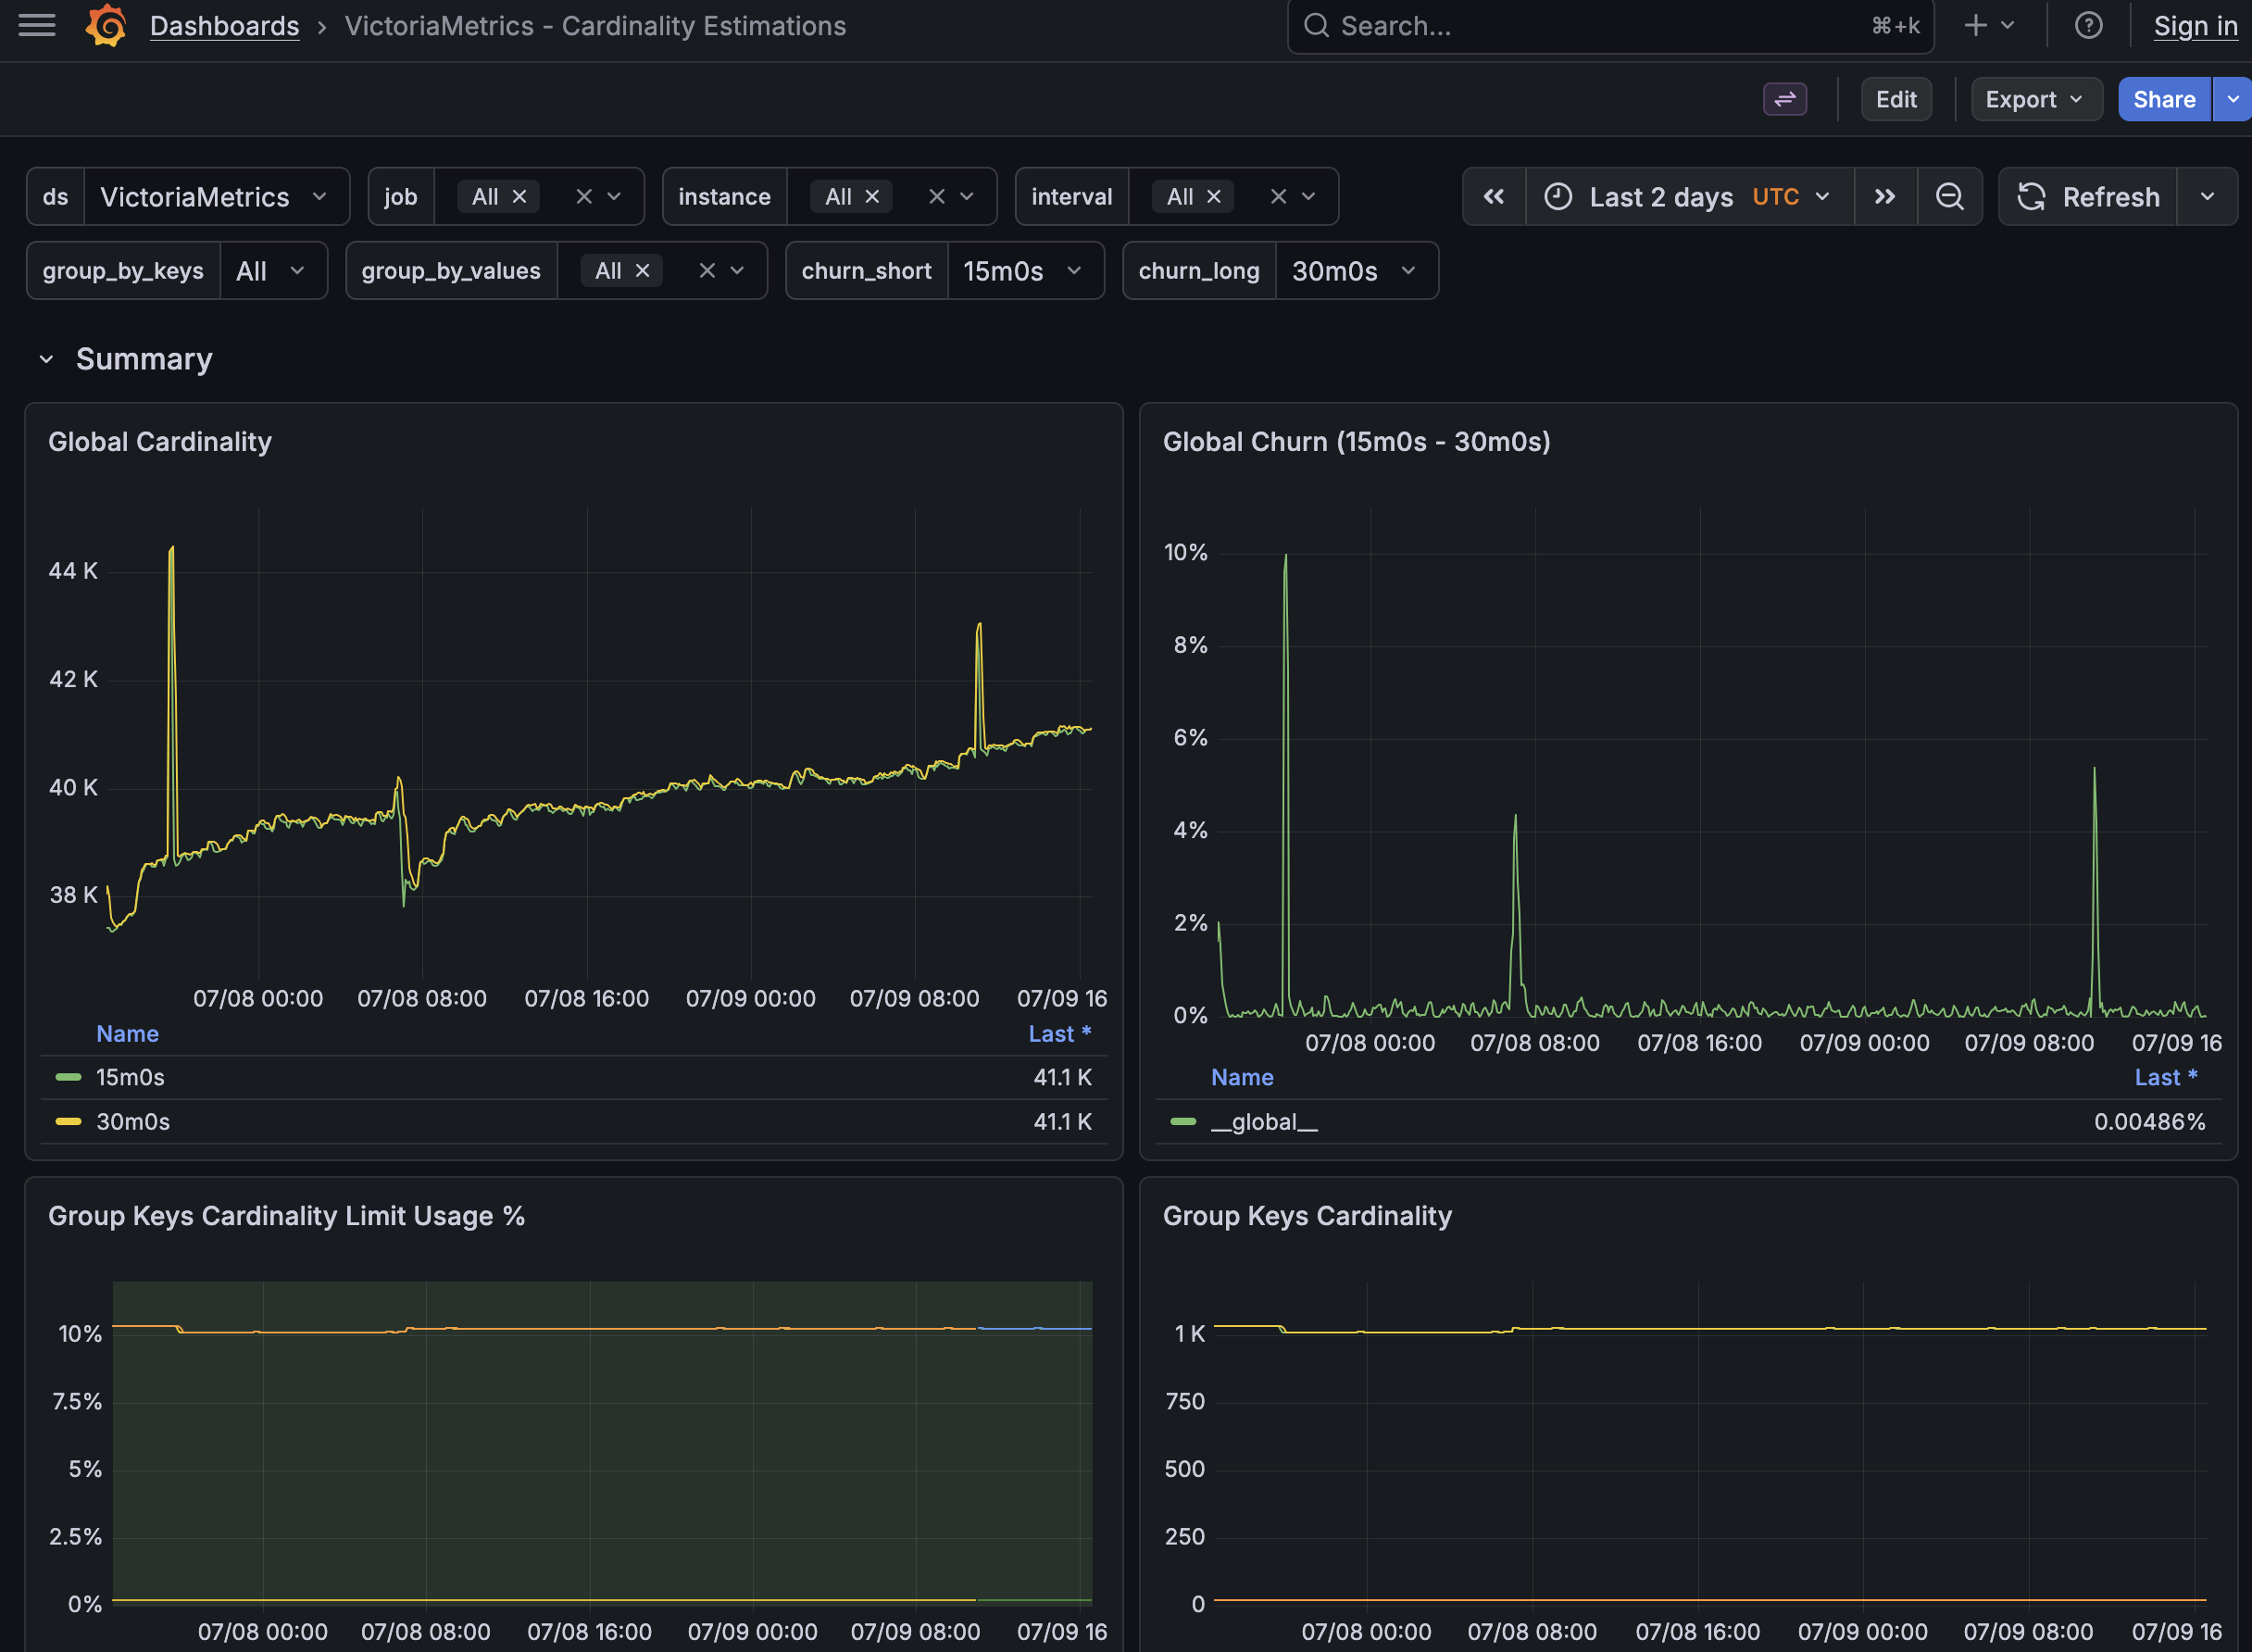
vmestimator ships with two Grafana dashboards:
- vmestimator metrics: shows metrics for the vmestimator application itself. Includes CPU, memory, ingestion rates, concurrent inserts, and group key saturation.
- Cardinality Estimations: shows global cardinality, churn rate, and top 10 metrics and jobs.
Alerts with vmalert
#
By plugging in vmalert, you can get alerted when cardinality exceeds a predefined threshold.
Get started with the examples provided in the vmestimator repository. For example, the first alert fires when the per-job cardinality exceeds 20,000 over a 30-minute interval:
groups:
  - name: 'cardinality'
    rules:
      - alert: 'JobTooHighCardinality'
        expr: 'max (cardinality_estimate{group_by_keys="job",interval="30m0s"}) without(instance) > 20000'
        for: '15m'
        labels:
          severity: 'warning'
        annotations:
          dashboard: "{{ $externalURL }}/d/mktd5g9?var-group_by_keys=job&var-interval={{ $labels.interval }}"
          summary: "High cardinality for job {{ $labels.group_by_values }}"
          description: "Job {{ $labels.group_by_values }} has {{ $value }} estimated series over the last {{ $labels.interval }}, exceeding the 20000 series threshold."

...
The second alert compares two streams at different intervals and triggers when the churn rate is too high. A value of 1 means a 100% churn in active series:
...
      - alert: 'JobTooHighChurnRate'
        expr: |
          (
              max(cardinality_estimate{group_by_keys="job",interval="30m0s"}) without (instance)
              -
              max(cardinality_estimate{group_by_keys="job",interval="15m0s"}) without (instance)
          )
          /
          max(cardinality_estimate{group_by_keys="job",interval="30m0s"}) without (instance) * 100 > 10
        for: '15m'
        labels:
          severity: 'warning'
        annotations:
          dashboard: "{{ $externalURL }}/d/mktd5g9?var-group_by_keys=job&var-churn_short=15m0s&var-churn_long=30m0s"
          summary: "High churn rate for job {{ $labels.group_by_values }}"
          description: 'Job {{ $labels.group_by_values }} has {{ printf "%.0f%%" $value }} of series churned between the 15m and 30m cardinality windows, exceeding the 10% threshold.'

...
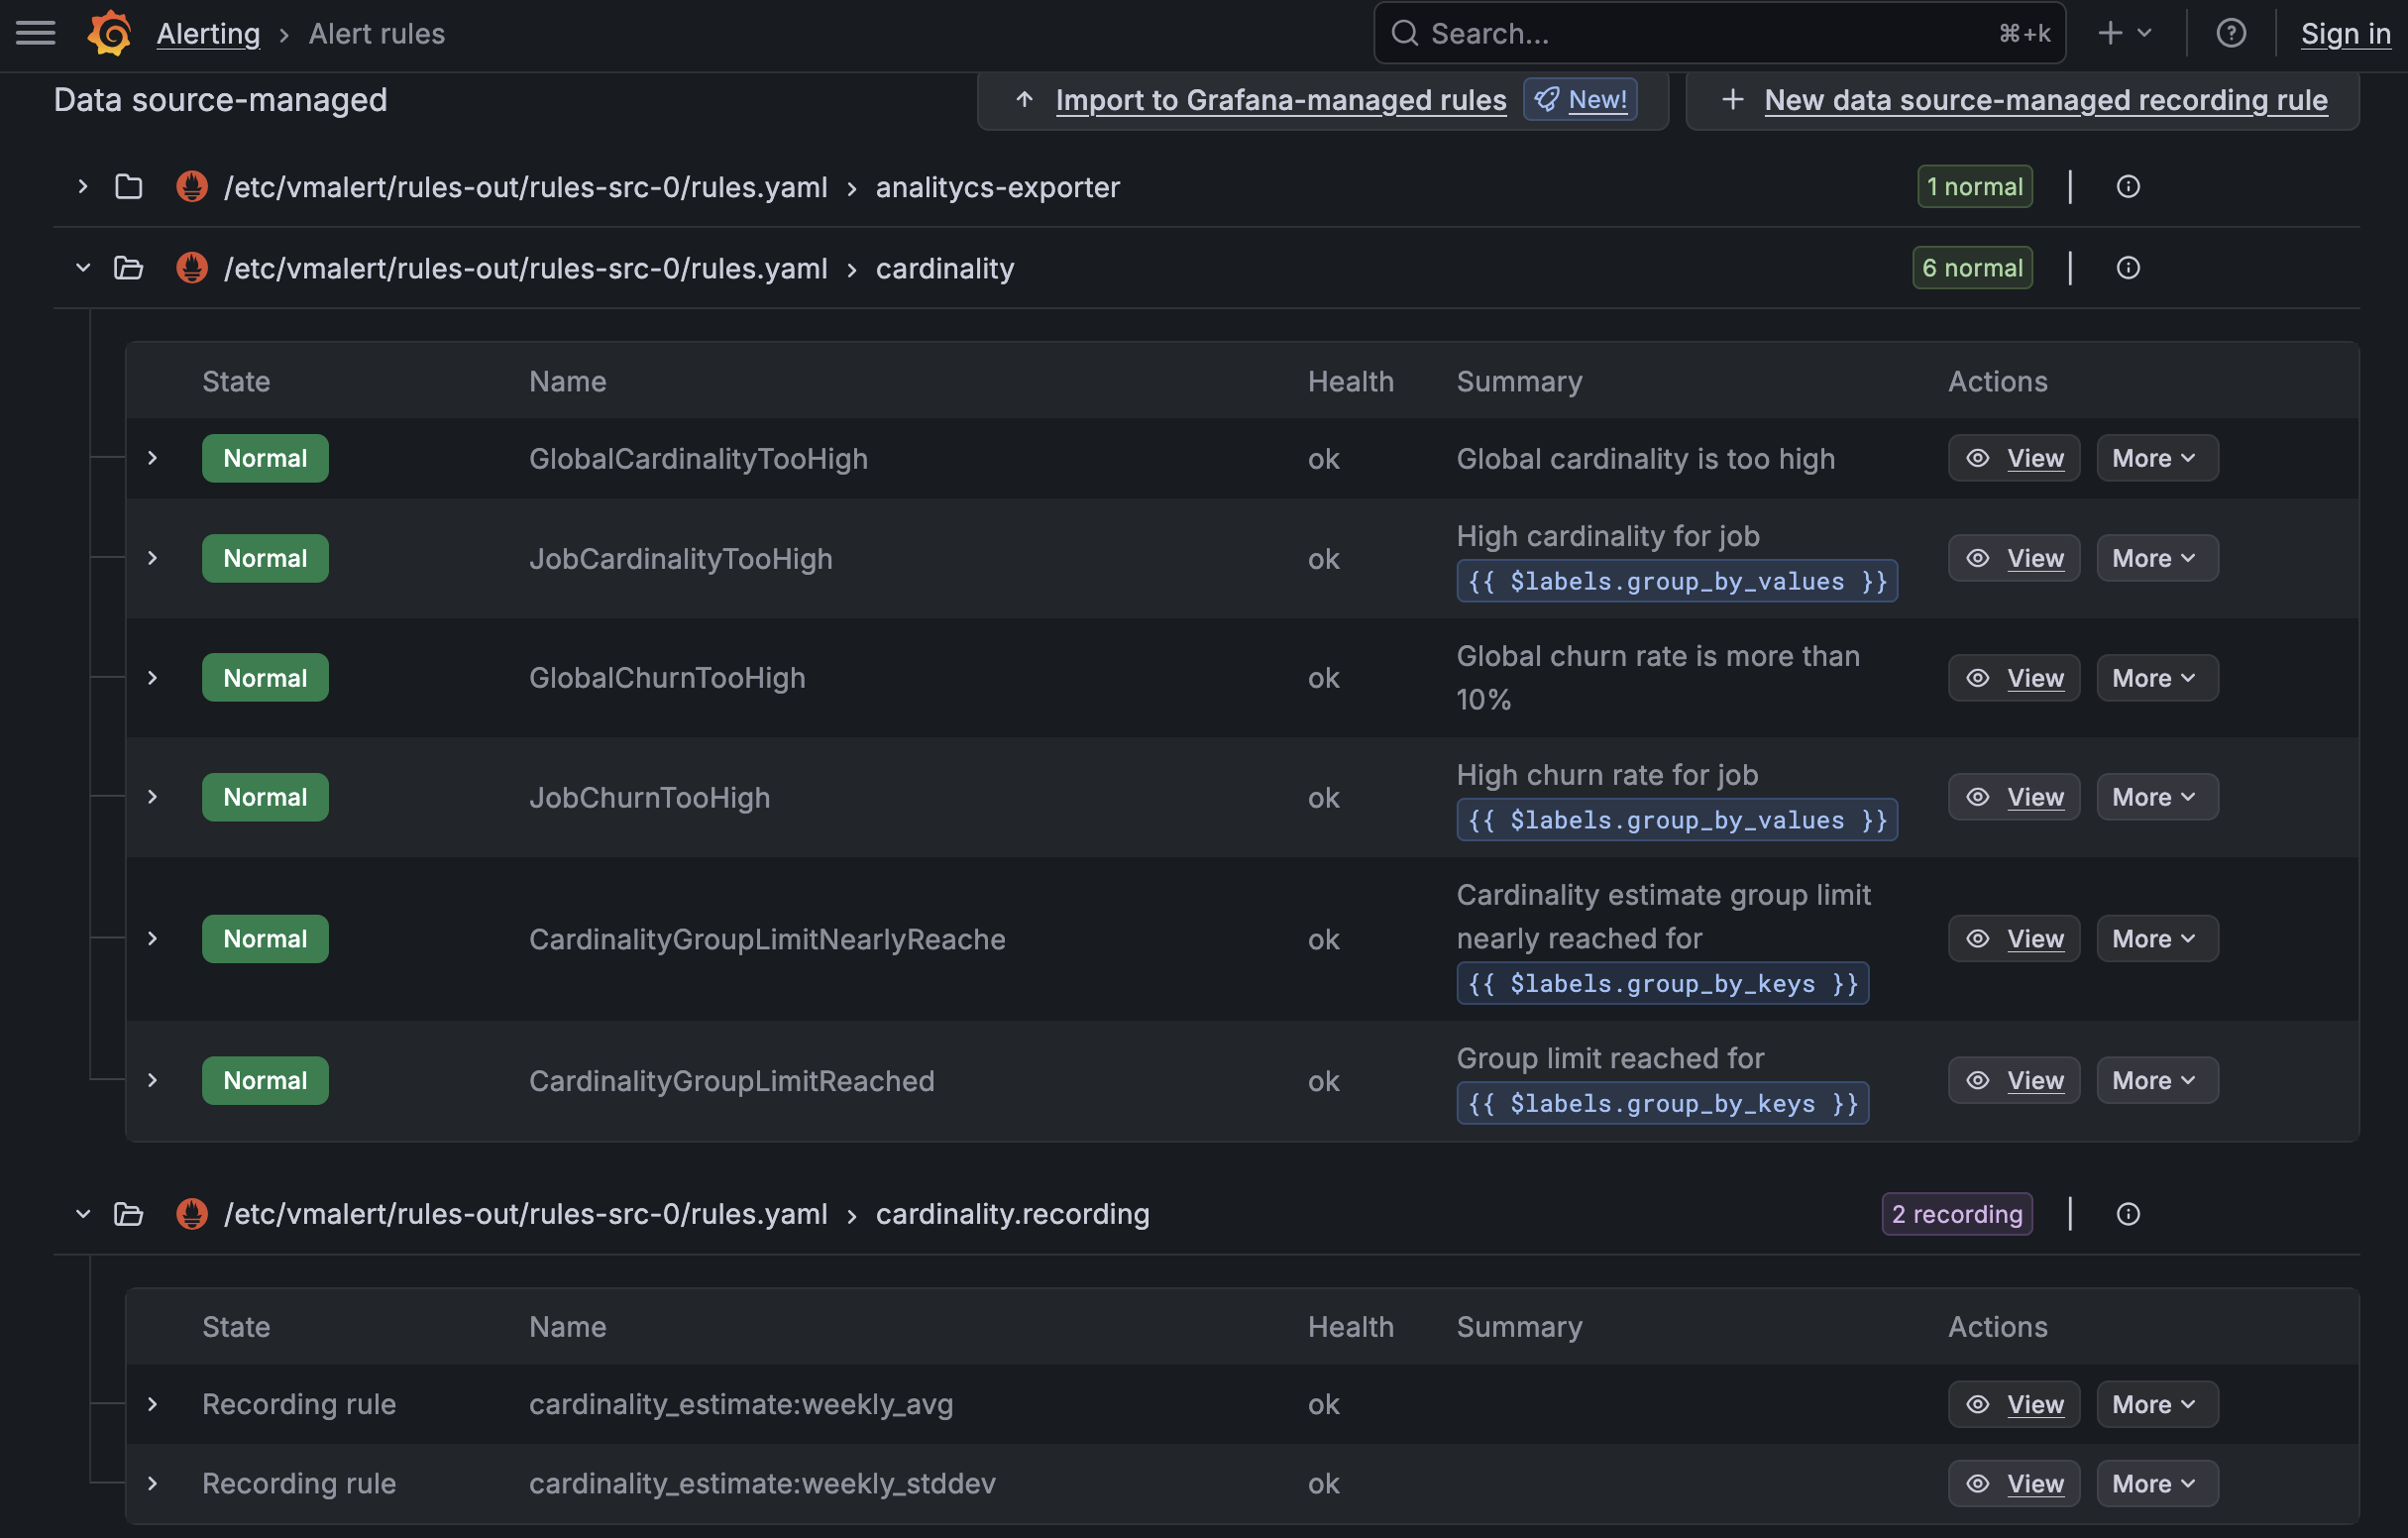
You can view cardinality alerts online in our VictoriaMetrics Grafana Playground. Look inside the “cardinality” and “cardinality.recording” sections.
Conclusion
#
If you already use a Prometheus-compatible pipeline, vmestimator slots into that workflow with minimal extra moving parts. It gives you an early warning on runway cardinality and helps with long-term capacity planning.
Frequently Asked Questions
#
Is vmestimator compatible with Prometheus?
#
Yes. vmestimator exports Prometheus-compatible metrics and is compatible with any client that can send data in Prometheus remote write v1 format. So, you can scrape it like any other target and use the results in PromQL-based dashboards and alerts.
Do I need vmalert and VictoriaMetrics to use vmestimator?
#
No. vmestimator can run on its own and export metrics over HTTP, but vmalert and VictoriaMetrics make it much more useful by letting you store, query, visualize, and alert on cardinality estimates.
What problem does vmestimator solve?
#
It helps you detect cardinality growth early by estimating it in real time at the source, across arbitrary label dimensions. This makes it useful for tracking trends and triggering alerts on sudden changes.
What can I monitor with vmestimator?
#
You can track cardinality across arbitrary label dimensions, including globally, per metric name, per job, per tenant, and over time through churn estimates.
How do I run vmestimator?
#
You can download the binary from GitHub, build it from source, or run it as a Docker container. vmestimator runs from a streams.yaml file, where you choose the estimation interval, grouping labels, and related options. You can run it with the example config, scrape the exported cardinality_estimate metrics, and pair it with Grafana and vmalert to visualize trends and alert on spikes.
What’s the difference between vmestimator and the Cardinality Explorer in VMUI?
#
A cardinality explorer view is included with VMUI; vmestimator is meant to supplement rather than replace it.
vmestimator estimates cardinality only for predefined label groups, but it does so efficiently and in real time, making it suitable for monitoring and alerting. Cardinality Explorer, on the other hand, can analyze cardinality across arbitrary label combinations, but those queries are more expensive and don’t provide historical trends. That makes it better suited for ad-hoc investigations and in-depth analysis.
They measure cardinality at different points in the pipeline. vmestimator estimates it at the source, before ingestion, while Cardinality Explorer reflects the cardinality of data already stored in a database. Source-side cardinality can be aggregated, whereas cardinality across cluster storage nodes cannot.
Leave a comment below or Contact Us if you have any questions!
comments powered by Disqus
You might also like:

How Airbnb Built a High-Volume Metrics Pipeline with OpenTelemetry and vmagent
Learn how Airbnb rebuilt its observability pipeline with OpenTelemetry and vmagent to handle over 100 million samples per second, reduce cost by 10x, and simplify high-scale metrics aggregation.

Multi-tiered Observability: A Practical Way to Handle Diverse Workloads
Discover multi-tier observability architecture with VictoriaMetrics OSS. Learn how to isolate default, high-cardinality, and business-critical workloads into separate tiers with optimized retention periods, ingestion resolution, cardinality limits, alerting policies, and cost controls.

OpenTelemetry, Prometheus, and More: Which Is Better for Metrics Collection and Propagation?
OpenTelemetry, Prometheus 2.x, Prometheus 3.x, and vmagent are put together for comparison in scraping and pushing data to remote storage.