- Blog /
- vmagent: Key Features Explained in Under 15 Minutes
vmagent: Key Features Explained in Under 15 Minutes
Share:


This discussion is a part of the Basic Series serving as the starting point to quickly get you started with VictoriaMetrics.
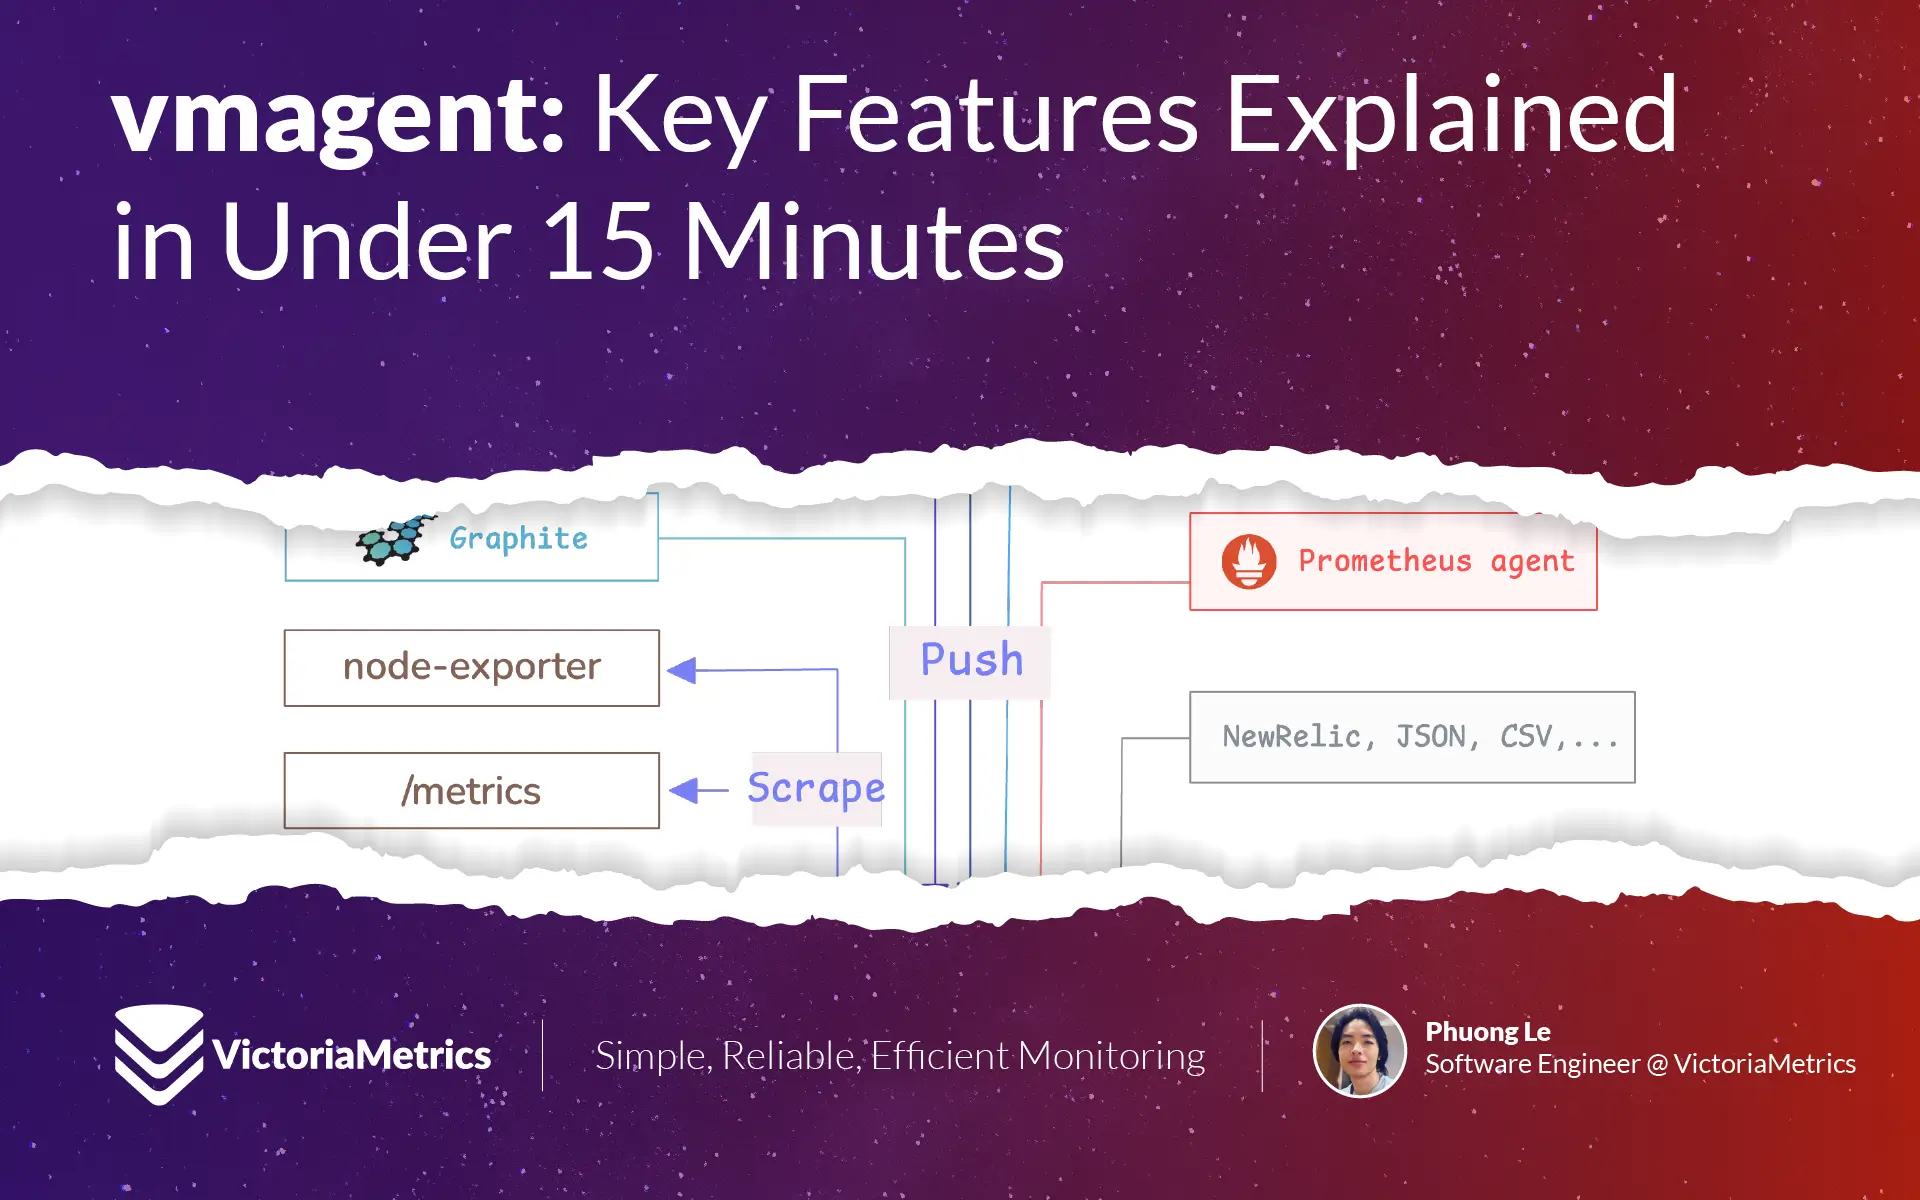
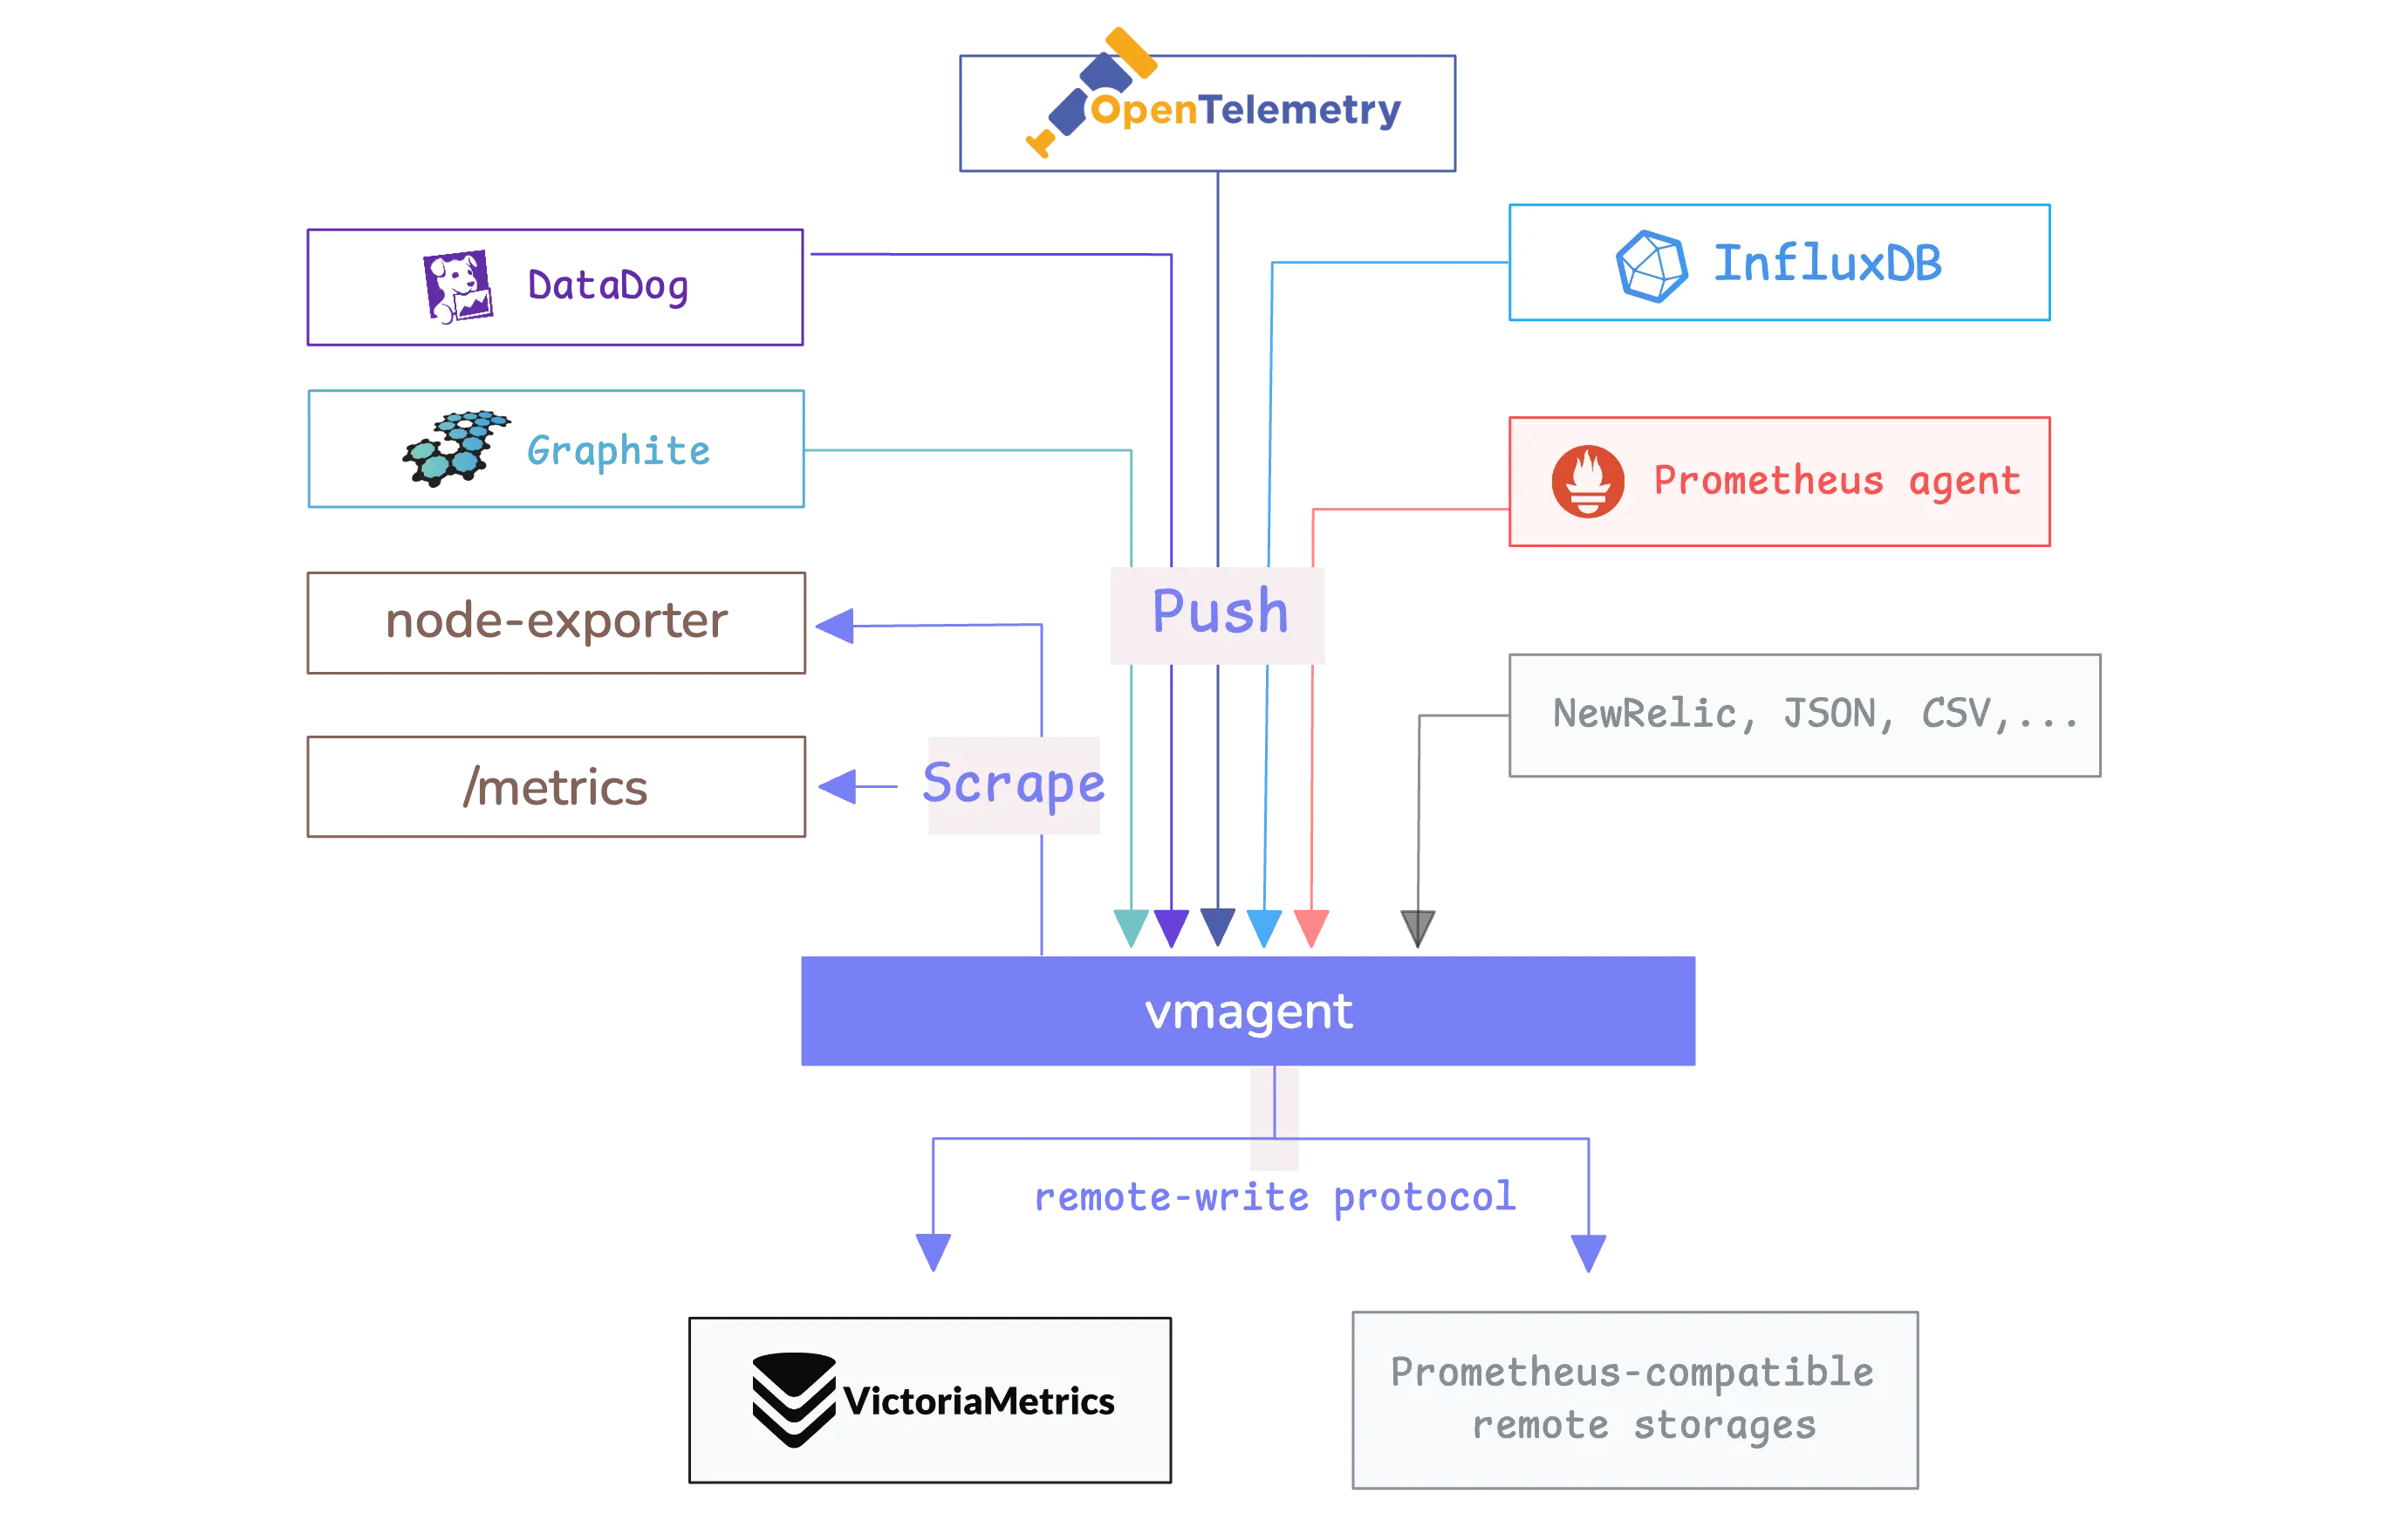
vmagent is a lightweight metrics collection agent that acts as a bridge between your applications and monitoring storage systems like VictoriaMetrics.
It works in two main ways:
- It can actively collect metrics by scraping endpoints from applications (like Prometheus does).
- It can passively receive metrics that applications push to it using popular protocols like InfluxDB, Graphite, OpenTSDB, DataDog, and others.
Once vmagent collects these metrics, it can process them by filtering unwanted data, changing labels, or combining multiple metrics together, and then forwards the processed data to one or more remote storage systems using the remote write protocol.
Minimal Configuration
#
Getting vmagent to work requires just one setting: telling it where to send the metrics it collects.
This destination is called a remote write endpoint. The remote write protocol is a standard that works with many different monitoring systems, not just VictoriaMetrics.
When you have a single VictoriaMetrics server running, you need to point vmagent to your VictoriaMetrics instance using this command:
$ ./vmagent \
  -remoteWrite.url=https://single-node-victoriametrics:8428/api/v1/write
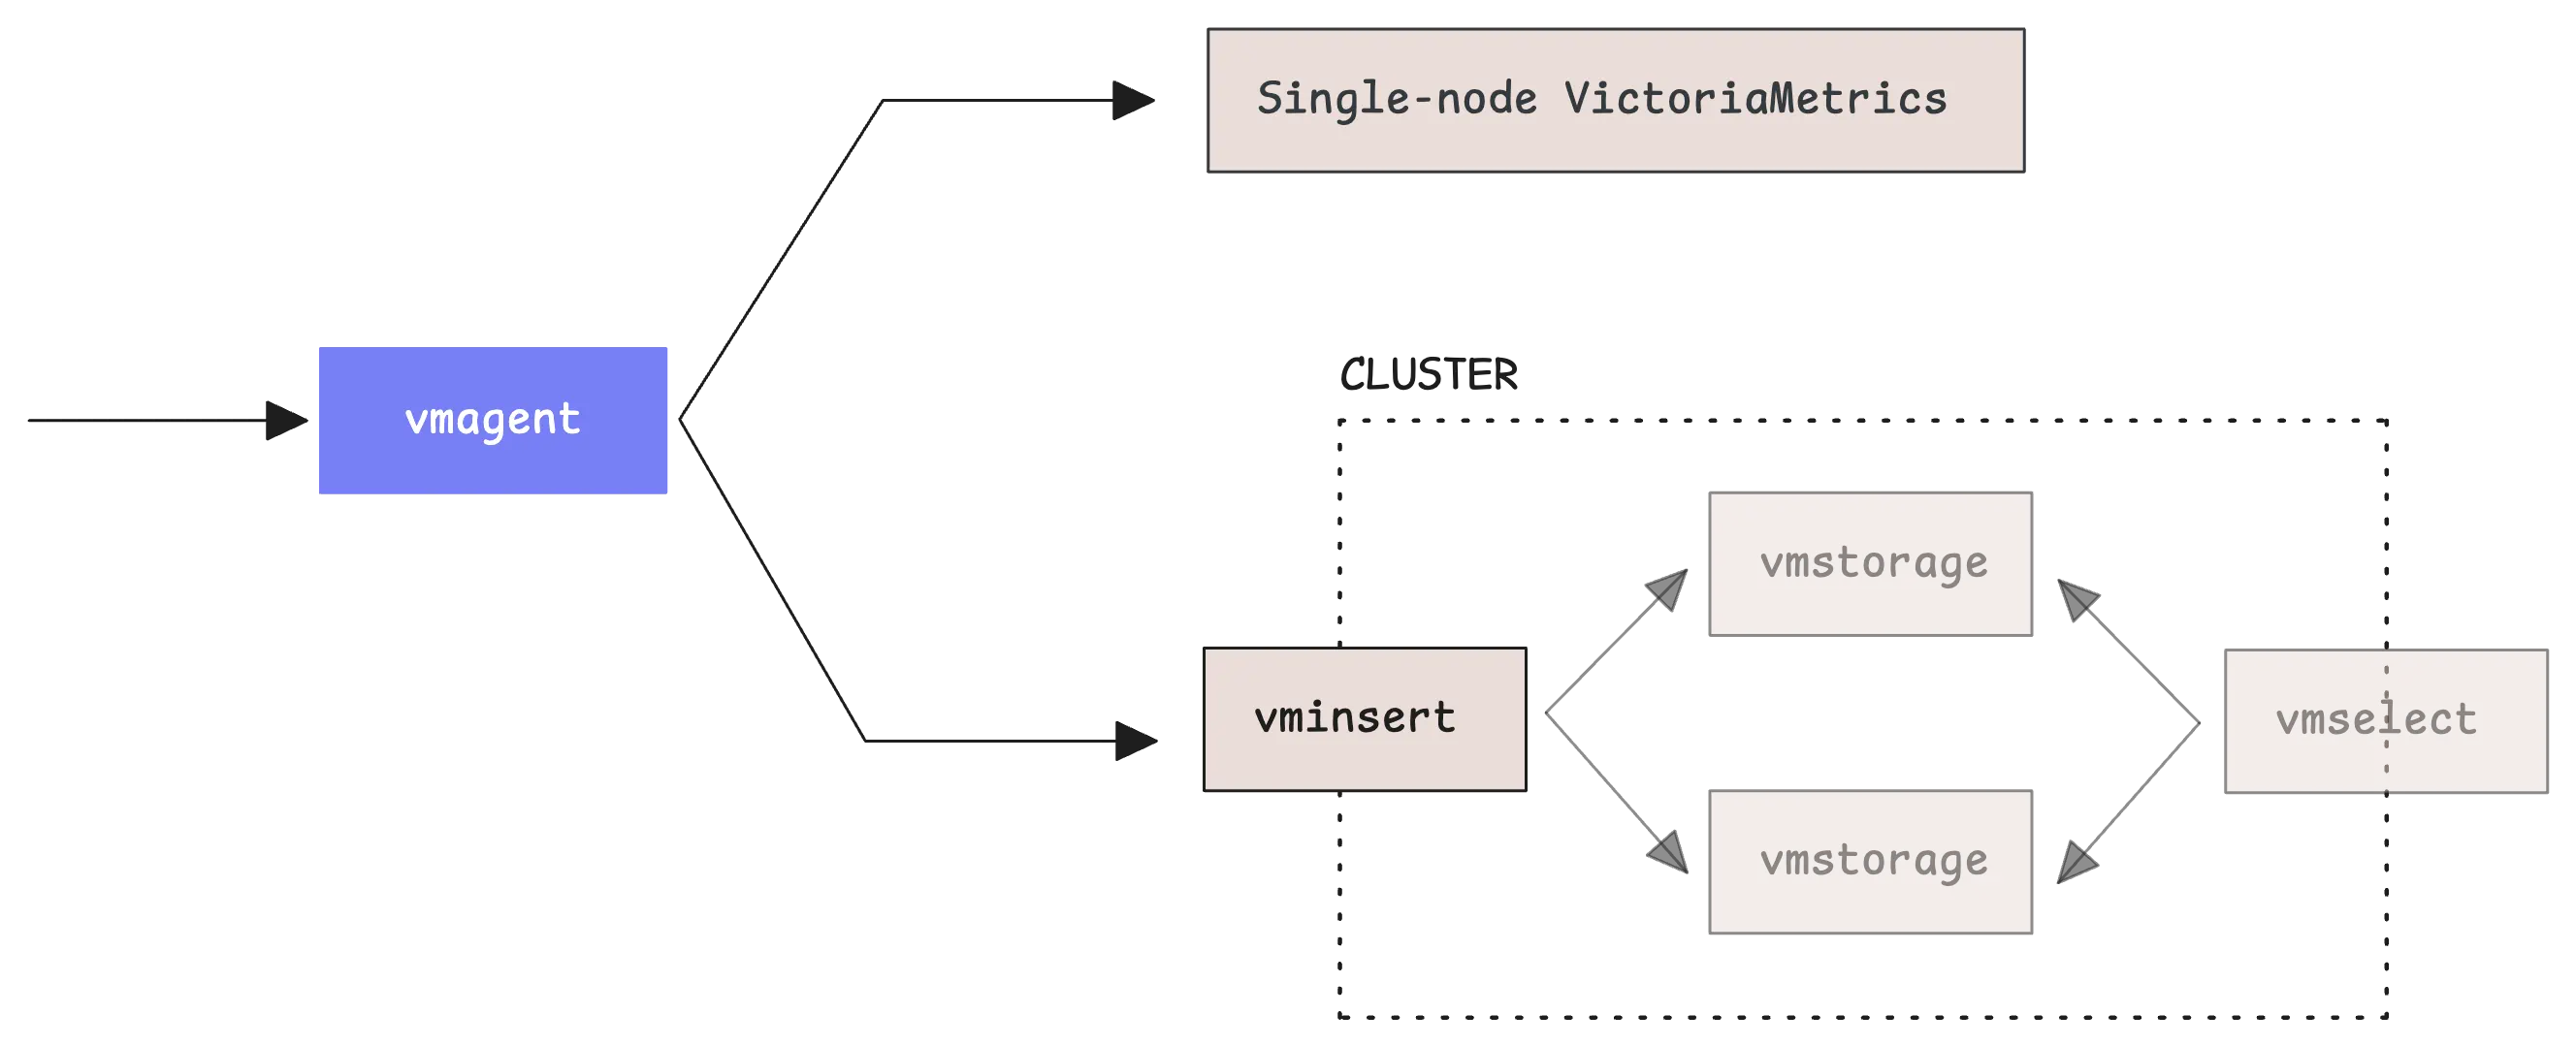
If you’re using VictoriaMetrics in cluster mode, the setup is slightly different.
In cluster mode, you send data to vminsert instead of directly to the database. You also need to specify an accountID, which is simply a number that identifies which tenant the data belongs to. Think of it as a way to organize data from different sources or customers.
When you’re just getting started using 0 for the accountID is perfectly fine:
$ ./vmagent \
  -remoteWrite.url=http://vminsert:8480/insert/<accountID>/prometheus/api/v1/write

$ ./vmagent \
  -remoteWrite.url=http://vminsert:8480/insert/0/prometheus/api/v1/write
Now, vmagent can send the same metrics to multiple destinations at once. You do this by adding more -remoteWrite.url flags to your command.
This creates copies of all your metrics in different storage systems:
$ ./vmagent \
  -remoteWrite.url=http://vminsert-cluster1:8480/insert/0/prometheus/api/v1/write \
  -remoteWrite.url=http://vminsert-cluster2:8480/insert/0/prometheus/api/v1/write \
  -remoteWrite.url=http://vminsert-cluster3:8480/insert/0/prometheus/api/v1/write
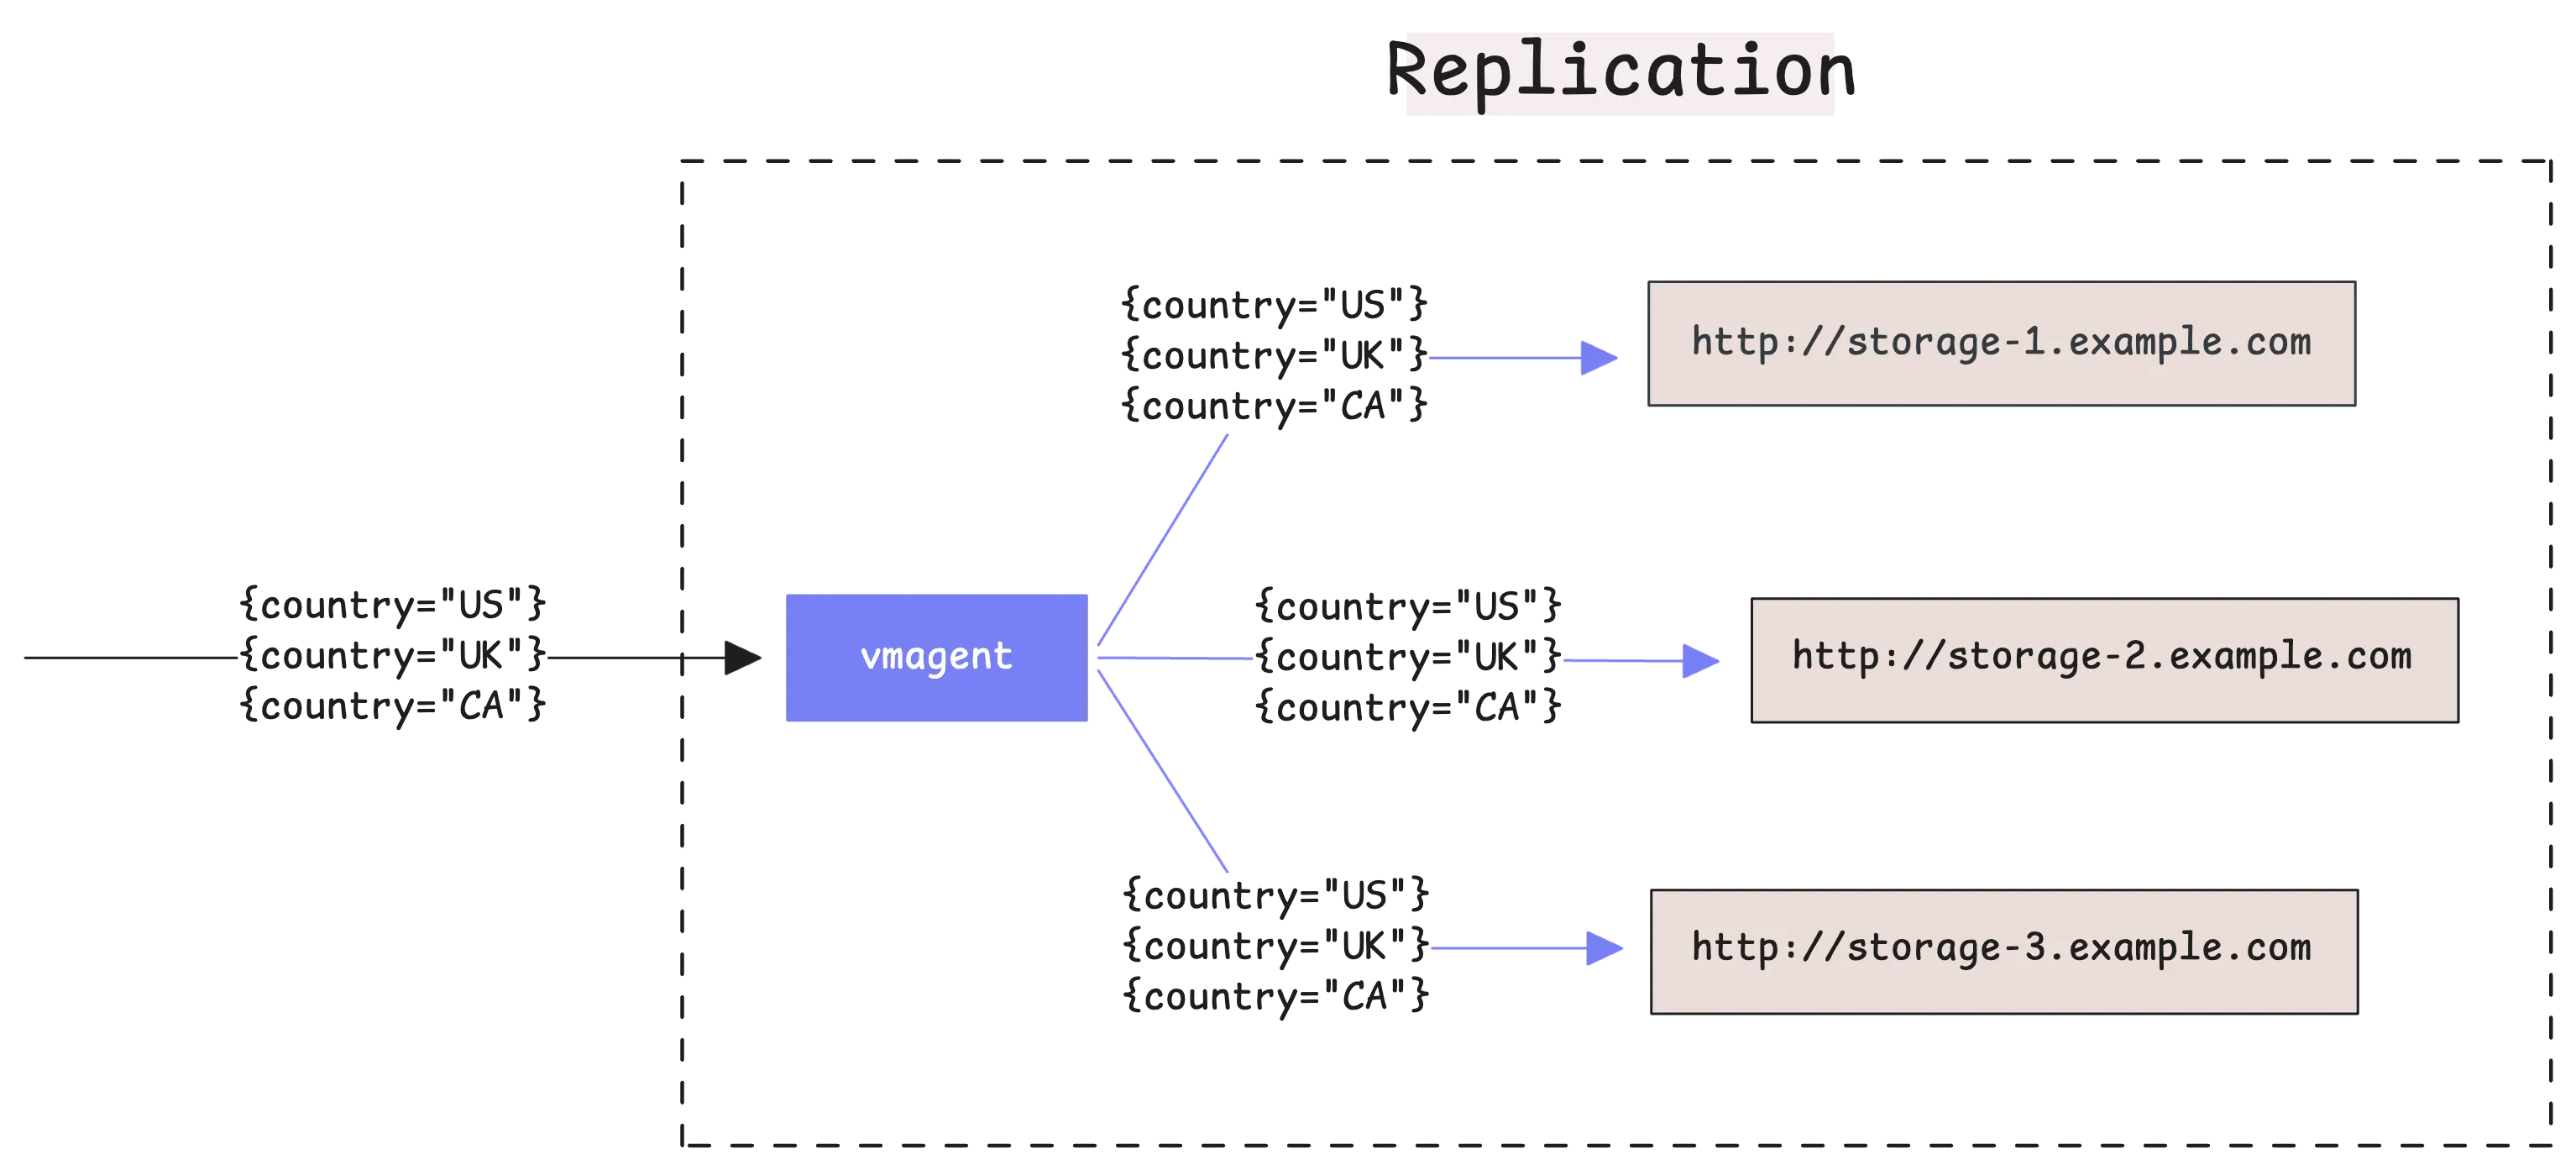
This redundancy means that if one storage system goes down, your other systems keep working and you don’t lose any recent data. vmagent is smart enough to handle failures automatically and will keep trying to send data to any system that becomes unavailable.
vmagent supports two methods for collecting metrics:
- Pull model: vmagent connects to specified targets, such as node_exporter or other Prometheus-compatible exporters. It scrapes metrics from these targets at regular intervals.
- Push model: Applications or services collect metrics and push them to vmagent using specific endpoints, depending on the data format.
By default, vmagent does not scrape any metrics. You must provide a configuration file using the -promscrape.config flag to define which targets should be scraped.
Helm chart
When using the official VictoriaMetrics Helm chart (or certain Docker-based setups), vmagent usually starts with a default scrape configuration included by the VictoriaMetrics team.
For example, if vmagent is deployed via Helm, it discovers pods and checks for an annotation such as prometheus.io/scrape:true. To determine the port to scrape, it uses the prometheus.io/port annotation:
annotations:
  prometheus.io/scrape: "true"
  prometheus.io/port: "9100"
Sharding
#
vmagent can split your time series data across multiple storage destinations instead of sending everything to every destination. This feature is called sharding and you enable it with the -remoteWrite.shardByURL flag.
When you use multiple -remoteWrite.url destinations without sharding, vmagent sends a complete copy of all your metrics to each destination. This is called replication. With sharding enabled, vmagent divides your time series among the destinations so each destination gets only part of your data.
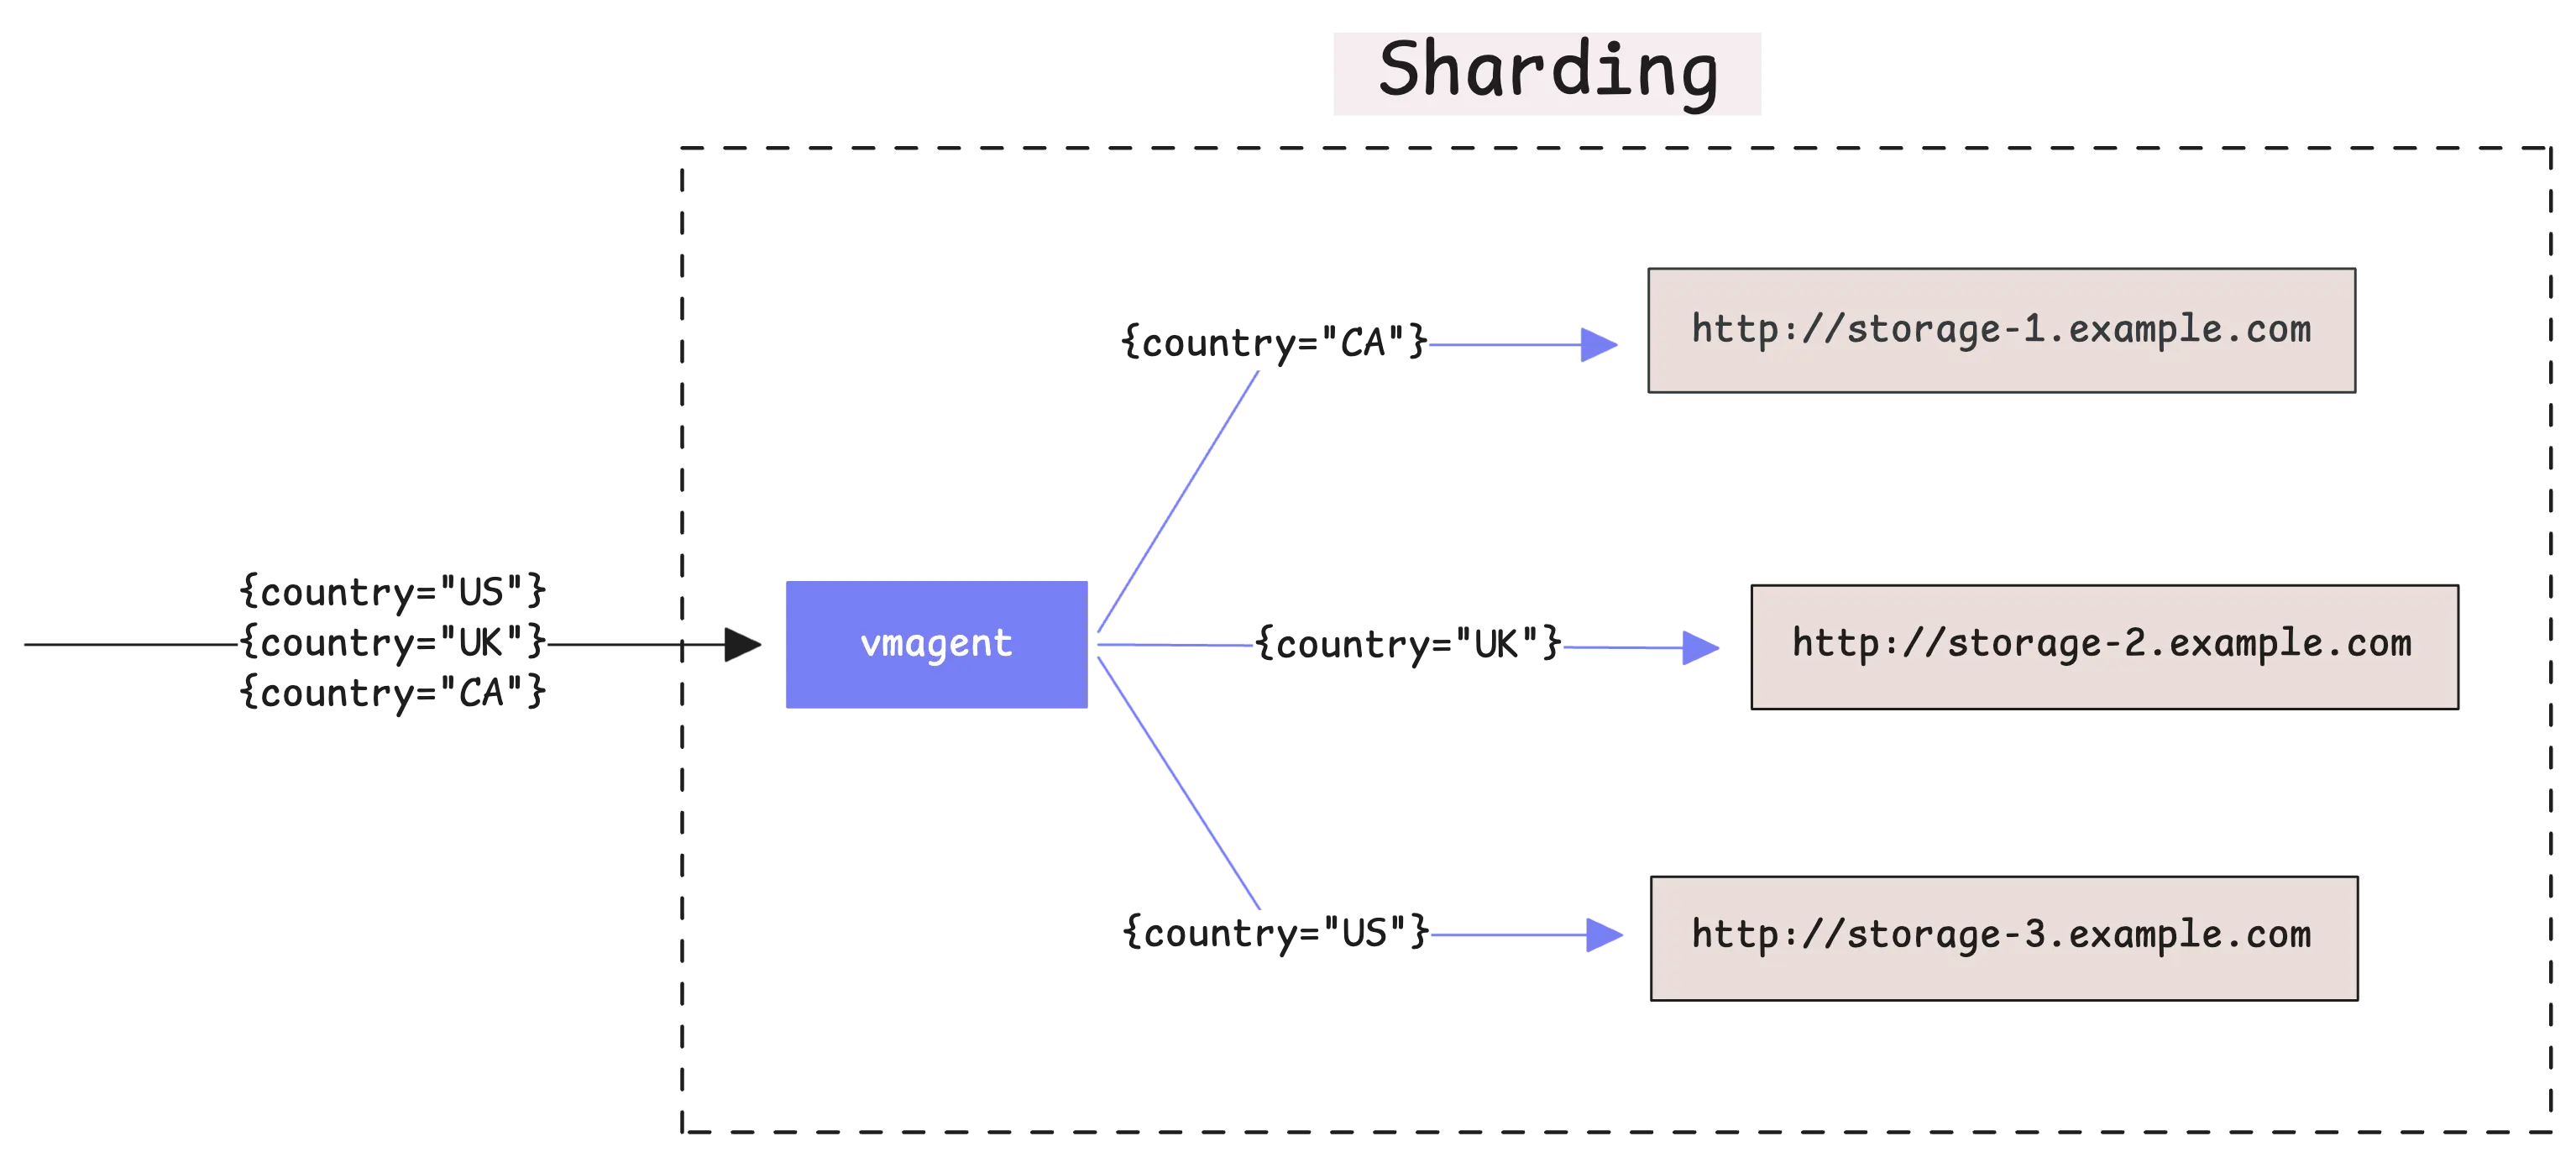
The important thing to understand is that vmagent always sends all data points from the same time series to the same destination.
This means if you have a metric called cpu_usage{instance="server1"}, all the data points for that specific metric will always go to the same storage destination.
You can combine sharding with replication by using both -remoteWrite.shardByURL and -remoteWrite.shardByURLReplicas=N flags together. When you do this, each time series gets distributed across your storage destinations and also gets copied to N different storage systems:
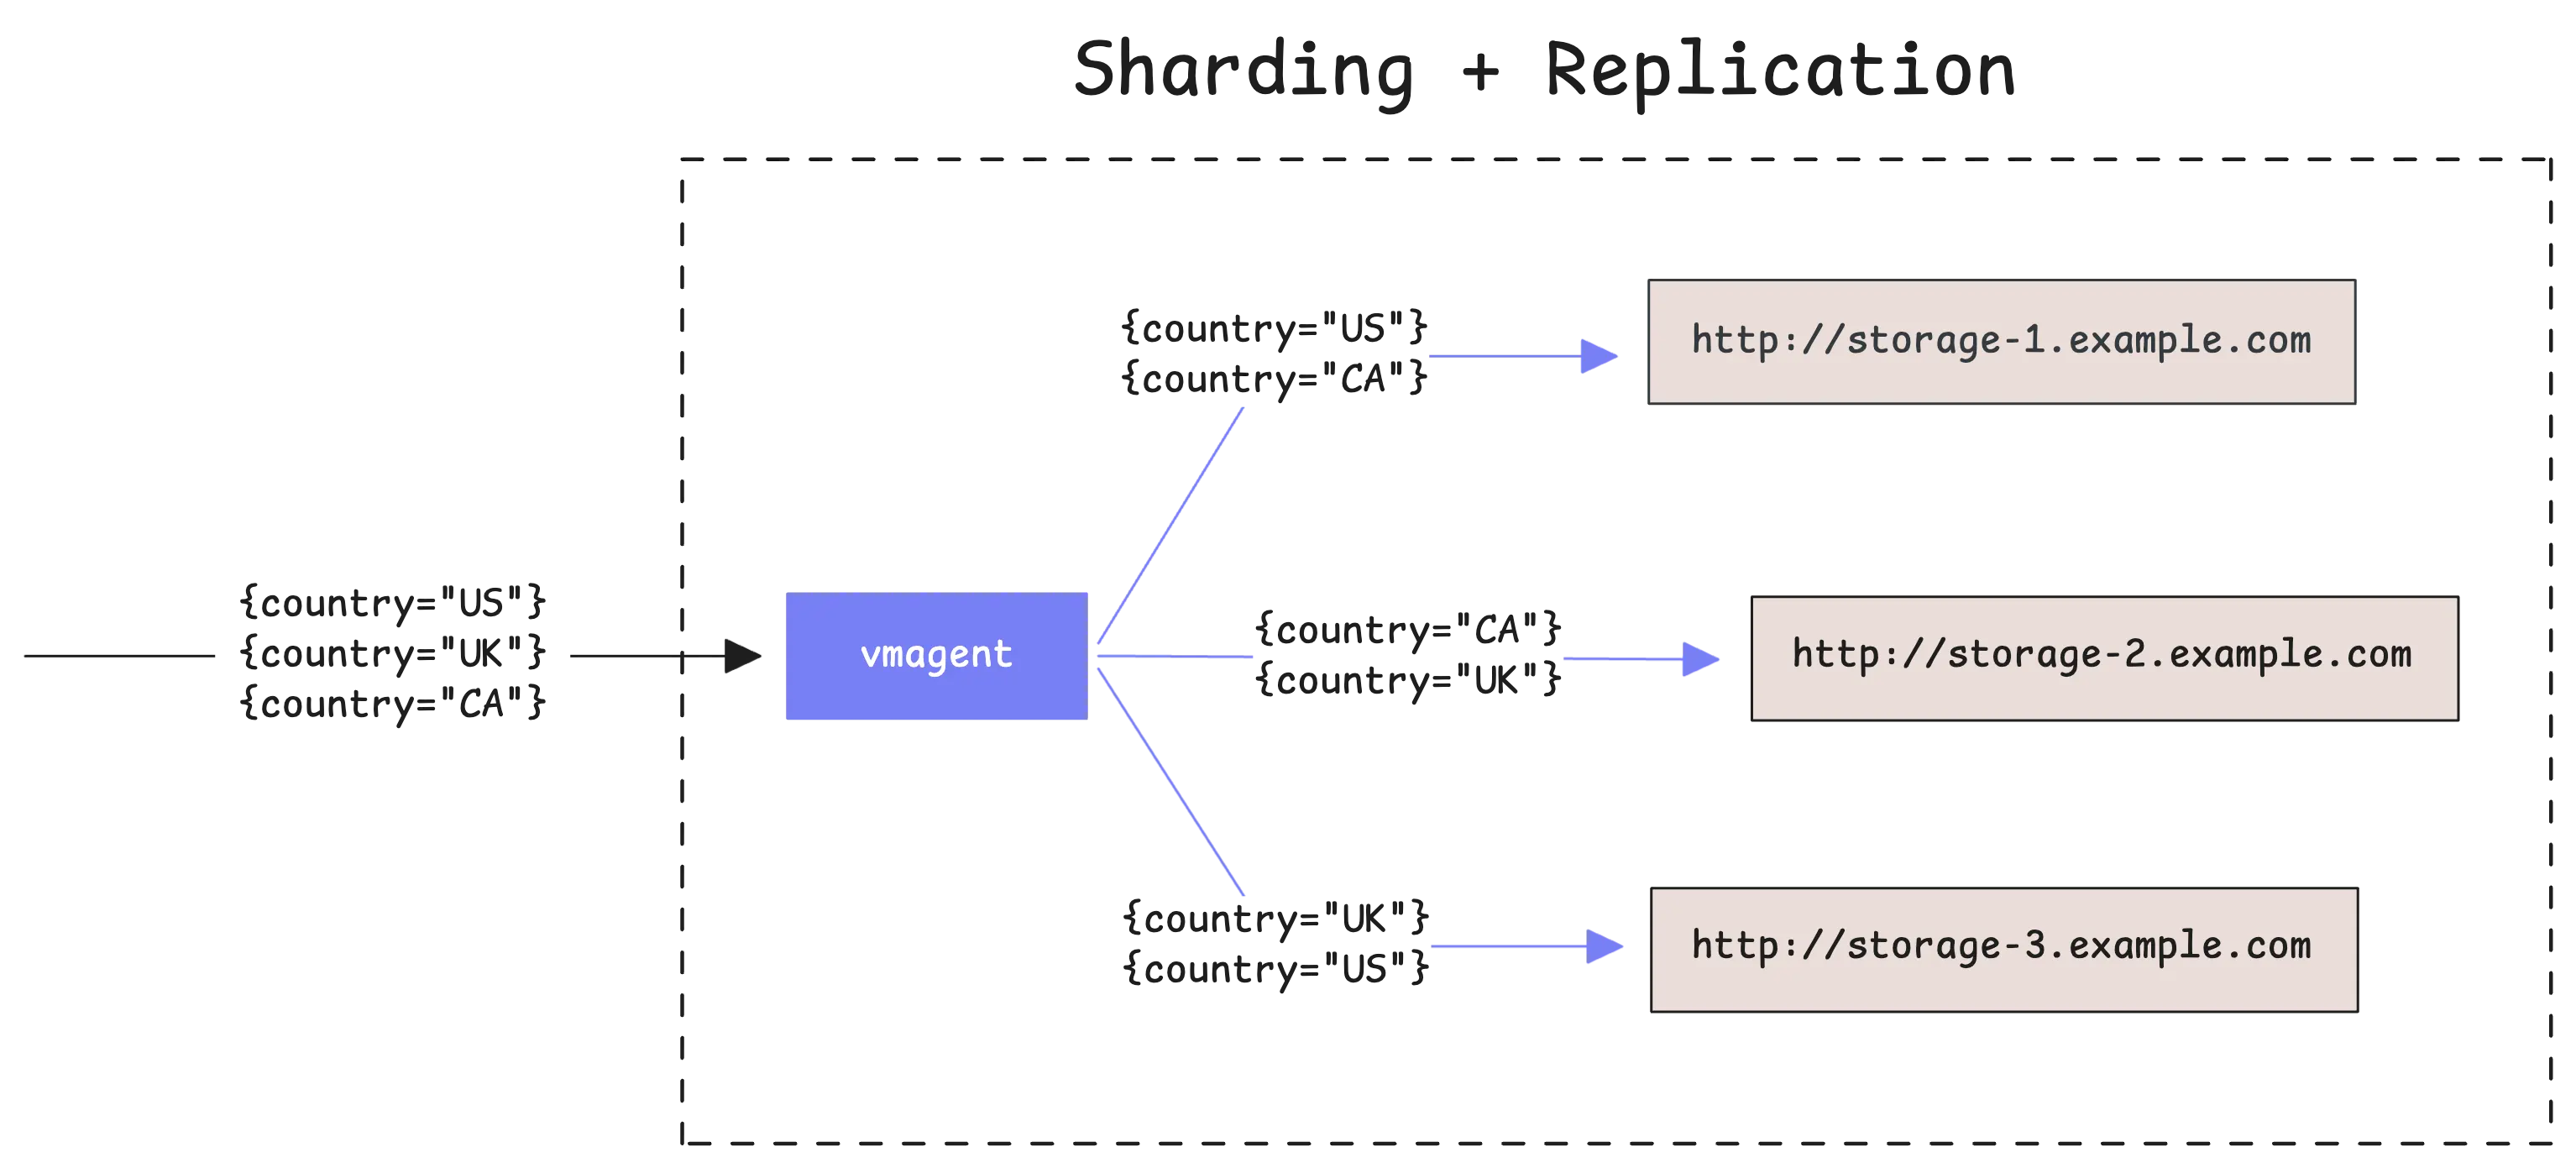
This gives you both the performance benefits of sharding and the safety benefits of having multiple copies of your data.
Tip
For more control over how the sharding works, you can tell vmagent which labels to use when deciding where to send data.
The -remoteWrite.shardByURL.labels flag lets you specify exactly which labels should be considered for sharding. For example, if you set -remoteWrite.shardByURL.labels=instance,__name__, then metrics with the same instance and metric name will go to the same destination.
The -remoteWrite.shardByURL.ignoreLabels flag does the opposite - it tells vmagent to ignore certain labels when making sharding decisions.
Relabeling
#
Relabeling lets you change or remove labels from your metrics as they move through vmagent. Specifically, you can control which targets vmagent scrapes, what labels to keep or drop, and how to rename those labels.
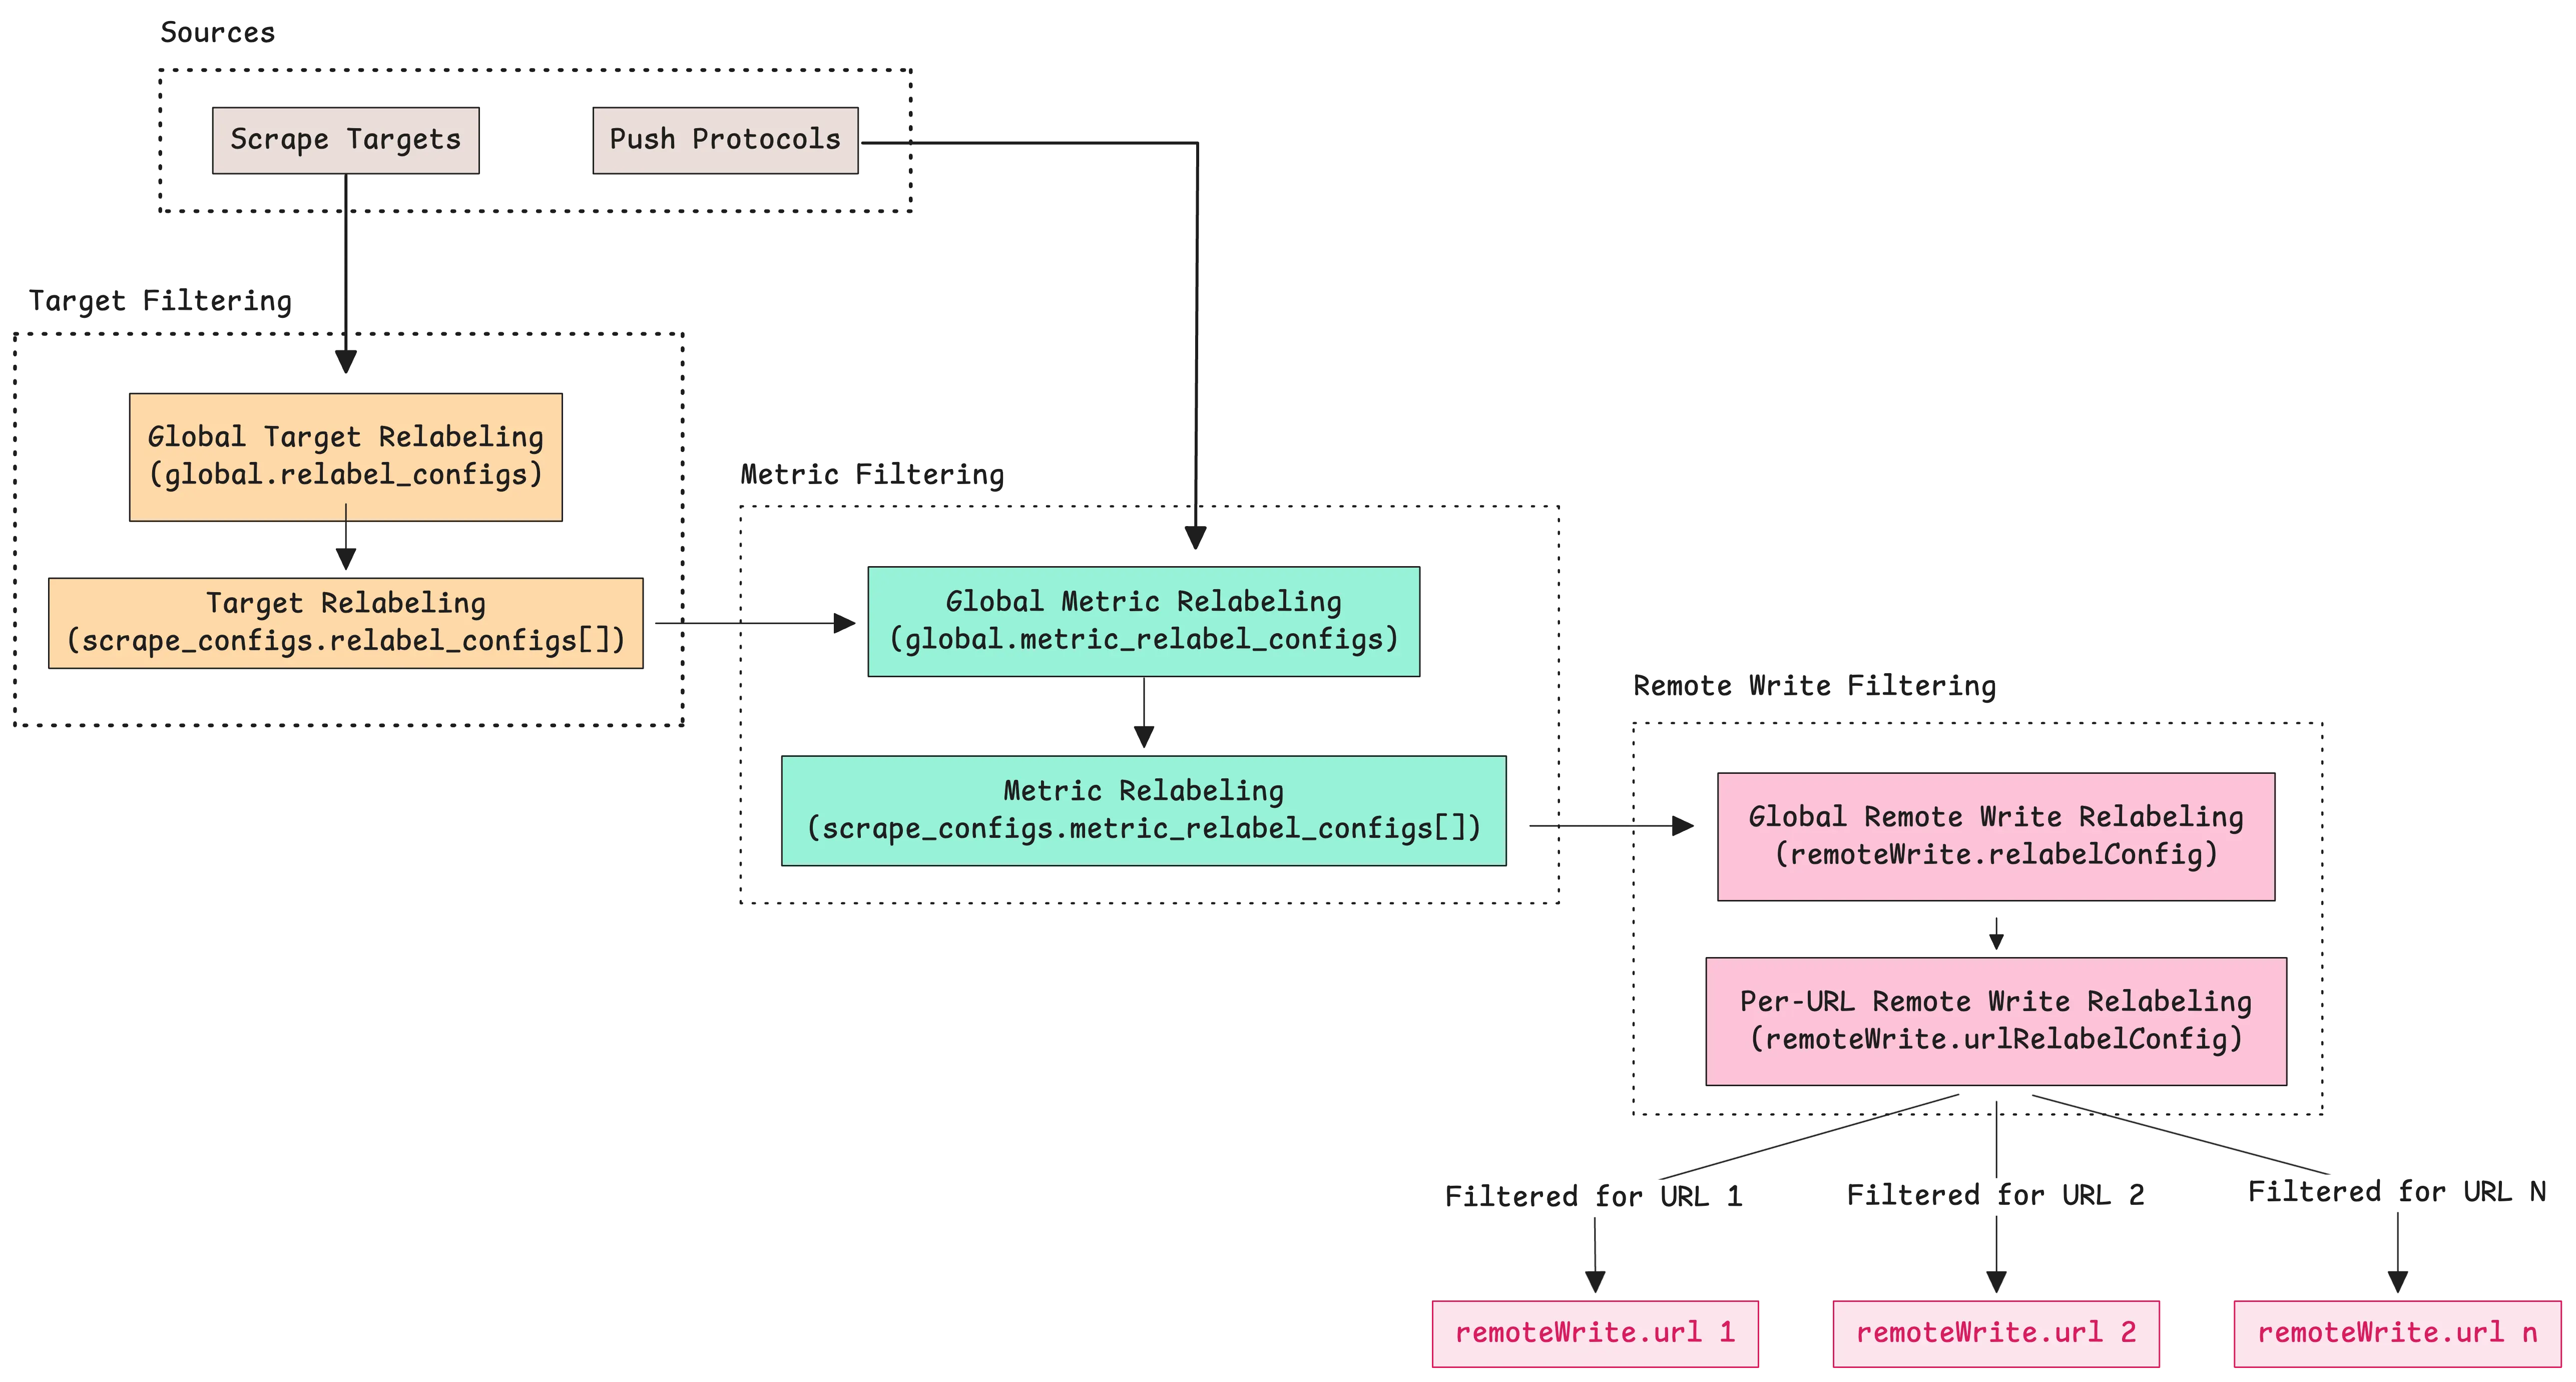
vmagent processes your metrics through three different stages where relabeling can happen:
- Service discovery relabeling: This happens first, before
vmagentscrapes any metrics. At this point,vmagenthas found possible targets using service discovery methods like Kubernetes, Consul, or static configurations. The relabeling rules at this stage decide which targetsvmagentshould actually scrape and what labels those targets should have. - Scraping relabeling: After
vmagentcollects metrics from a target, this stage lets you apply more relabeling rules. These rules work on the actual metrics that were just scraped, not on the targets themselves. - Remote write relabeling: This final stage happens right before
vmagentsends data to remote storage. You can set up different relabeling rules for each remote destination you configured.
The first two stages use a configuration file that you specify with the -promscrape.config flag when starting vmagent:
$ vmagent -promscrape.config=prometheus.yml
Here is a simple example that adds a label to all targets in a scrape job:
scrape_configs:
  - job_name: "prometheus-server"
    static_configs:
      - targets: ["localhost:9090"]
    relabel_configs:
      - target_label: "environment"
        replacement: "dev"
Try the above configuration in our playground.
This configuration tells vmagent to:
- scrape metrics from a Prometheus server at localhost:9090
- add a label called
environmentwith the valuedevto all discovered targets. - Every metric collected from
localhost:9090/metricswill include the labelenvironment="dev".
For the third stage, you have two options. Global remote write relabeling applies to all metrics before they go to any remote storage destination. You configure this with the -remoteWrite.relabelConfig flag:
vmagent -remoteWrite.relabelConfig=/path/to/global-relabel.yml
Per-destination remote write relabeling applies to metrics before they go to a specific remote storage destination. This uses the -remoteWrite.urlRelabelConfig flag, and you can have different relabeling rules for each destination:
vmagent \
  -remoteWrite.url=http://prod-vm:8428/api/v1/write \
  -remoteWrite.urlRelabelConfig=/path/to/prod-relabel.yml \
  -remoteWrite.url=http://dev-vm:8428/api/v1/write \
  -remoteWrite.urlRelabelConfig=/path/to/dev-relabel.yml
For more details, check out our Relabeling Cookbook. It includes a playground with many practical examples.
Stream Aggregation
#
Stream aggregation processes incoming metrics in real-time and calculates summary statistics before storing them.
When metric samples arrive, stream aggregation combines them into summary results over fixed time windows. For example, if you receive 100 CPU usage samples per second, over 5 minutes that amounts to 30,000 samples.
Stream aggregation can calculate the average usage over each 5-minute window and store only that average instead of all 30,000 individual samples.
Here is a simple configuration example:
- interval: 1m
  outputs: [avg]
  match: 'your_metric_name'
This configuration calculates the average of all incoming samples during each 1-minute window. At the end of each minute, stream aggregation creates a single data point with the average value. The output appears exactly on the minute boundary because the flush timing aligns with the interval.
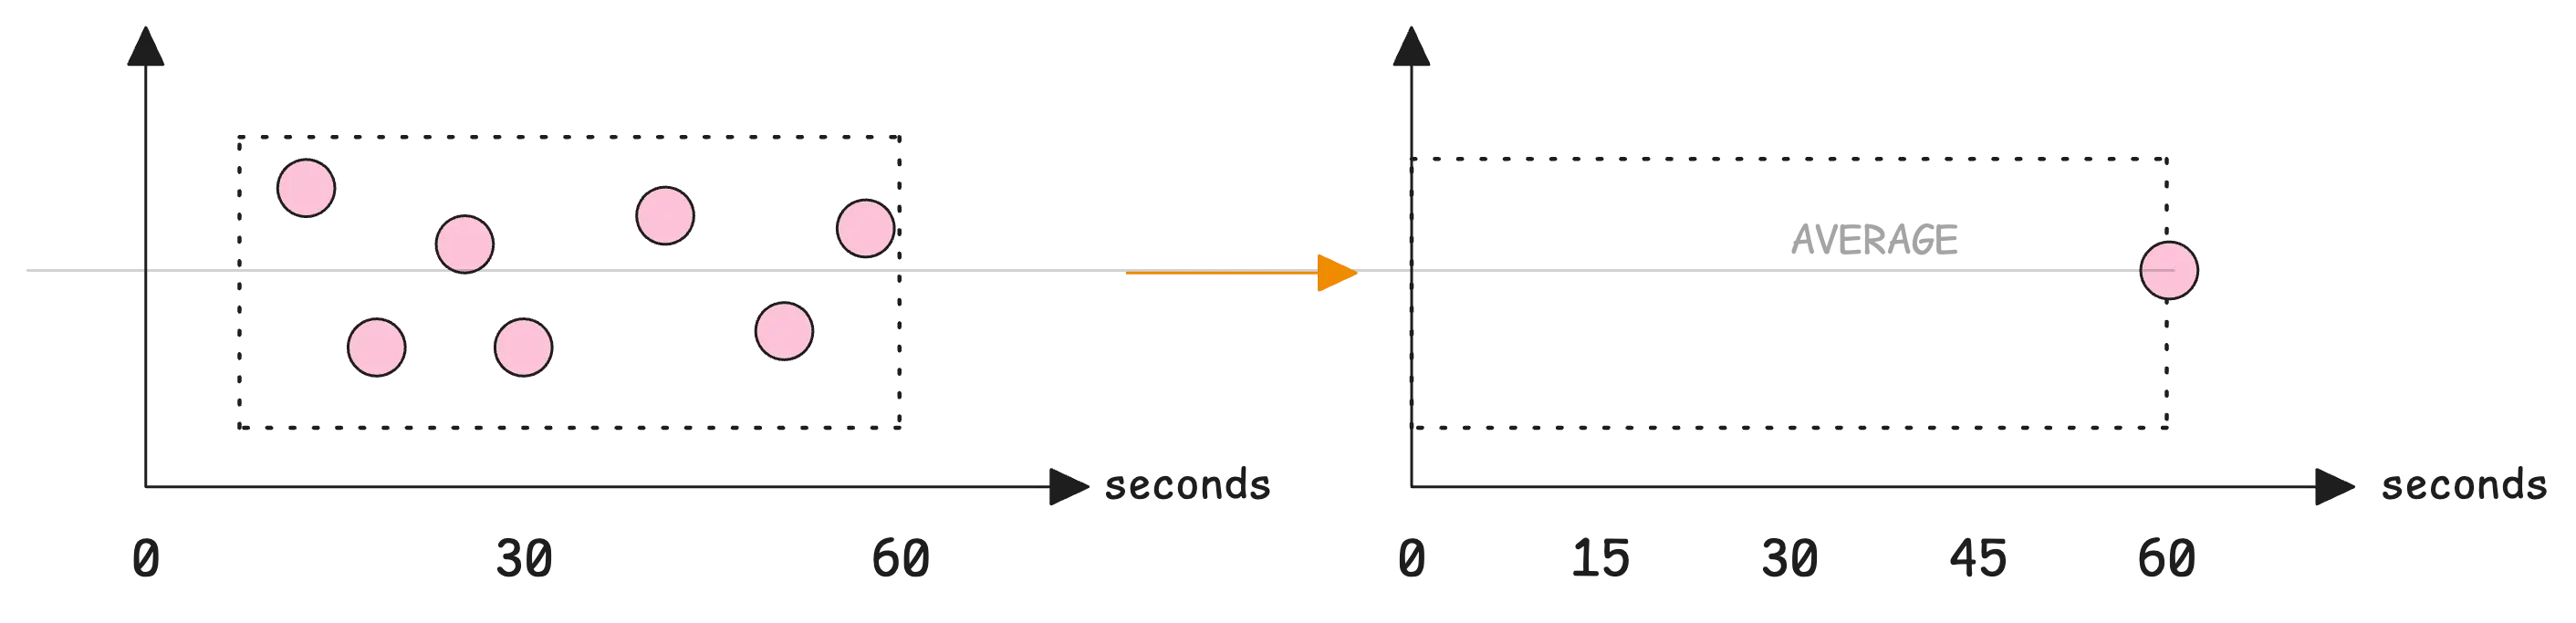
This means your charts will show one data point at the 60-second mark, which contains the average value for that full minute.
Why use stream aggregation?
Stream aggregation provides several important benefits:
- It saves storage space by storing only the calculated results instead of all raw samples.
- It makes queries run faster because they work with fewer data points. Instead of calculating averages during query time, you query the pre-calculated values.
- It reduces network usage when using vmagent because less data gets sent to remote storage.
Let’s take another example: You’re collecting CPU metrics from a server using Node Exporter with a scrape interval of 15 seconds. On a 16-core system, you receive data like this:
node_cpu_seconds_total{cpu="0", mode="user"} 1234.5
node_cpu_seconds_total{cpu="1", mode="user"} 1567.8
node_cpu_seconds_total{cpu="2", mode="user"} 1456.2
...
node_cpu_seconds_total{cpu="15", mode="user"} 1678.9
This results in 16 data points every 15 seconds. Over one minute, that totals 64 samples (16 * 4). Over an hour, it adds up to 3,840 samples—just for the ‘user’ CPU mode.
If per-core granularity isn’t required, stream aggregation can significantly reduce this volume by combining values across all cores:
- match: 'node_cpu_seconds_total{mode="user"}'
  interval: 1m
  without: [cpu]
  outputs: [total]
This configuration works as follows:
- Matches all
node_cpu_seconds_totalmetrics withmode="user". - Removes the cpu label to group all CPU cores together.
- Calculates the total value across all cores once per minute.
- Stores just one value per minute instead of 240.
Then, run vmagent using the configuration file:
$ ./vmagent \
  -remoteWrite.url=http://victoriametrics:8428/api/v1/write \
  -streamAggr.config=stream-aggr.yaml
This creates an aggregated output like:
node_cpu_seconds_total:1m_without_cpu_total{mode="user"} 1456
With this setup, you still track total CPU usage efficiently and get better storage savings and faster queries, without needing to store or analyze per-core details.
Note
Stream aggregation adds a small delay in sending metrics to remote storage. This happens because vmagent holds the incoming samples in memory, performs the aggregation calculations like sum or average, and sends the result after the time window completes. You can still choose to forward the original raw samples if needed. For more info, see Stream Aggregation.
Deduplication
#
vmagent can remove duplicate data by keeping only the most recent sample for each time series within a set time window. For example, if you set -streamAggr.dedupInterval=60s, vmagent will keep only one sample per time series for every 60-second period.
This deduplication happens before the data gets sent to remote storage. This is different from VictoriaMetrics storage-level deduplication, which happens after the data is already stored. When you deduplicate at the agent level, you reduce network usage and put less load on your storage system.
When vmagent finds duplicate samples within the deduplication window, it keeps the last sample that arrived:
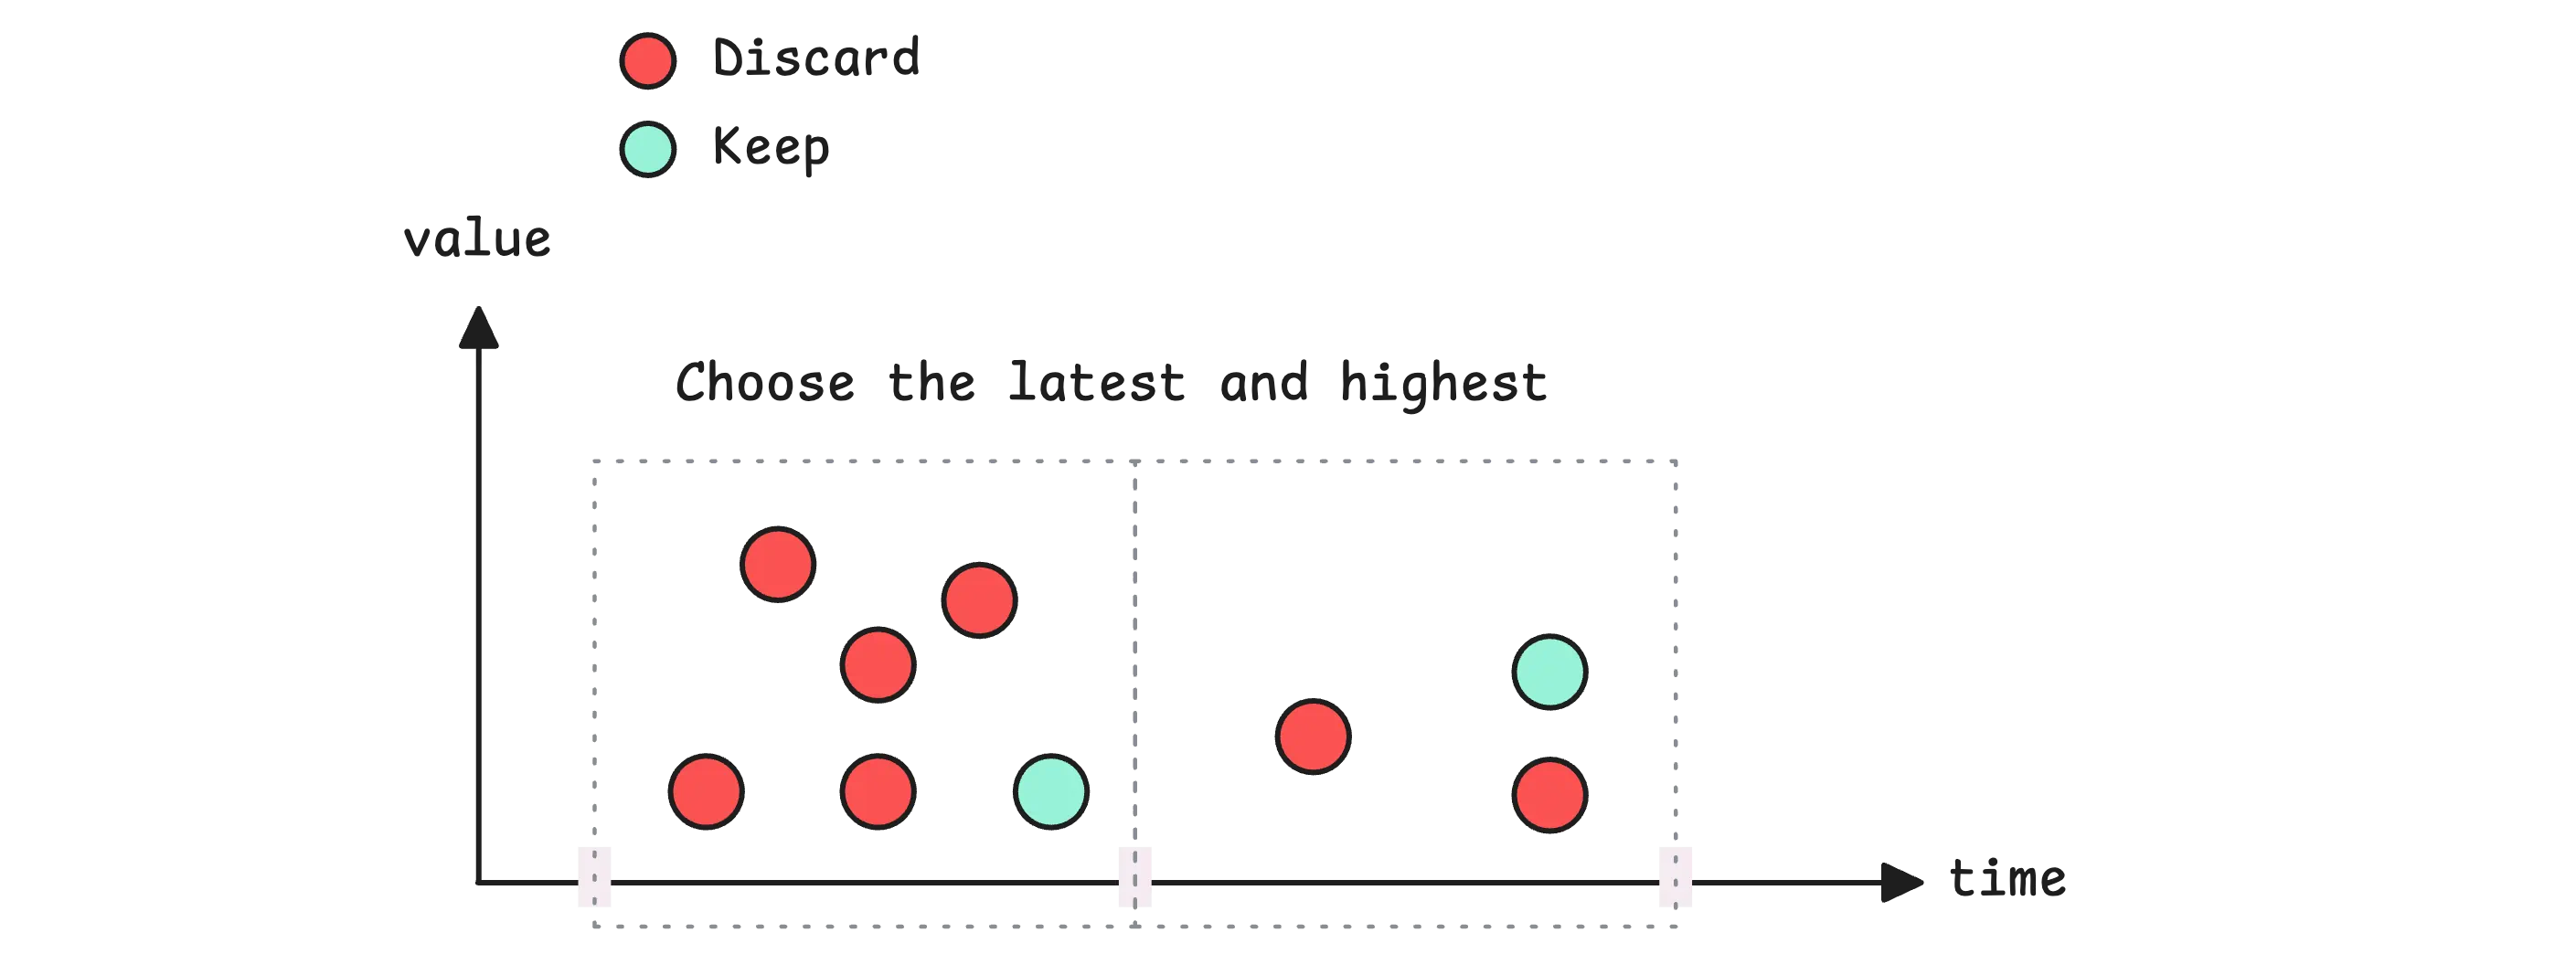
If multiple samples have exactly the same timestamp, vmagent will keep the one with the highest value. However, if one of those samples is a stale marker (a special NaN value that Prometheus uses), vmagent will always prefer the stale marker over any other value.
At this point, things might feel a bit overwhelming because we’ve covered many features. To help, here is the typical sequence in which vmagent processes data:
- Global relabeling (
-remoteWrite.relabelConfig) - Applied to all incoming data first. - Global deduplication (
-streamAggr.dedupInterval) - Applied after relabeling. - Global stream aggregation (
-streamAggr.config) - Applied after deduplication. - Data replication - The processed data is sent to each configured
-remoteWrite.url. - Per-destination relabeling (
-remoteWrite.urlRelabelConfig) - Applied for each destination separately. - Per-destination deduplication (
-remoteWrite.streamAggr.dedupInterval) - Applied per destination. - Per-destination aggregation (
-remoteWrite.streamAggr.config) - Applied per destination.
This processing order ensures that global settings apply first, then per-destination configurations take effect. For instance, you can apply global deduplication to reduce overall network traffic, then apply additional per-destination deduplication if specific storage systems need different deduplication intervals.
Persistent Disk for Remote Write
#
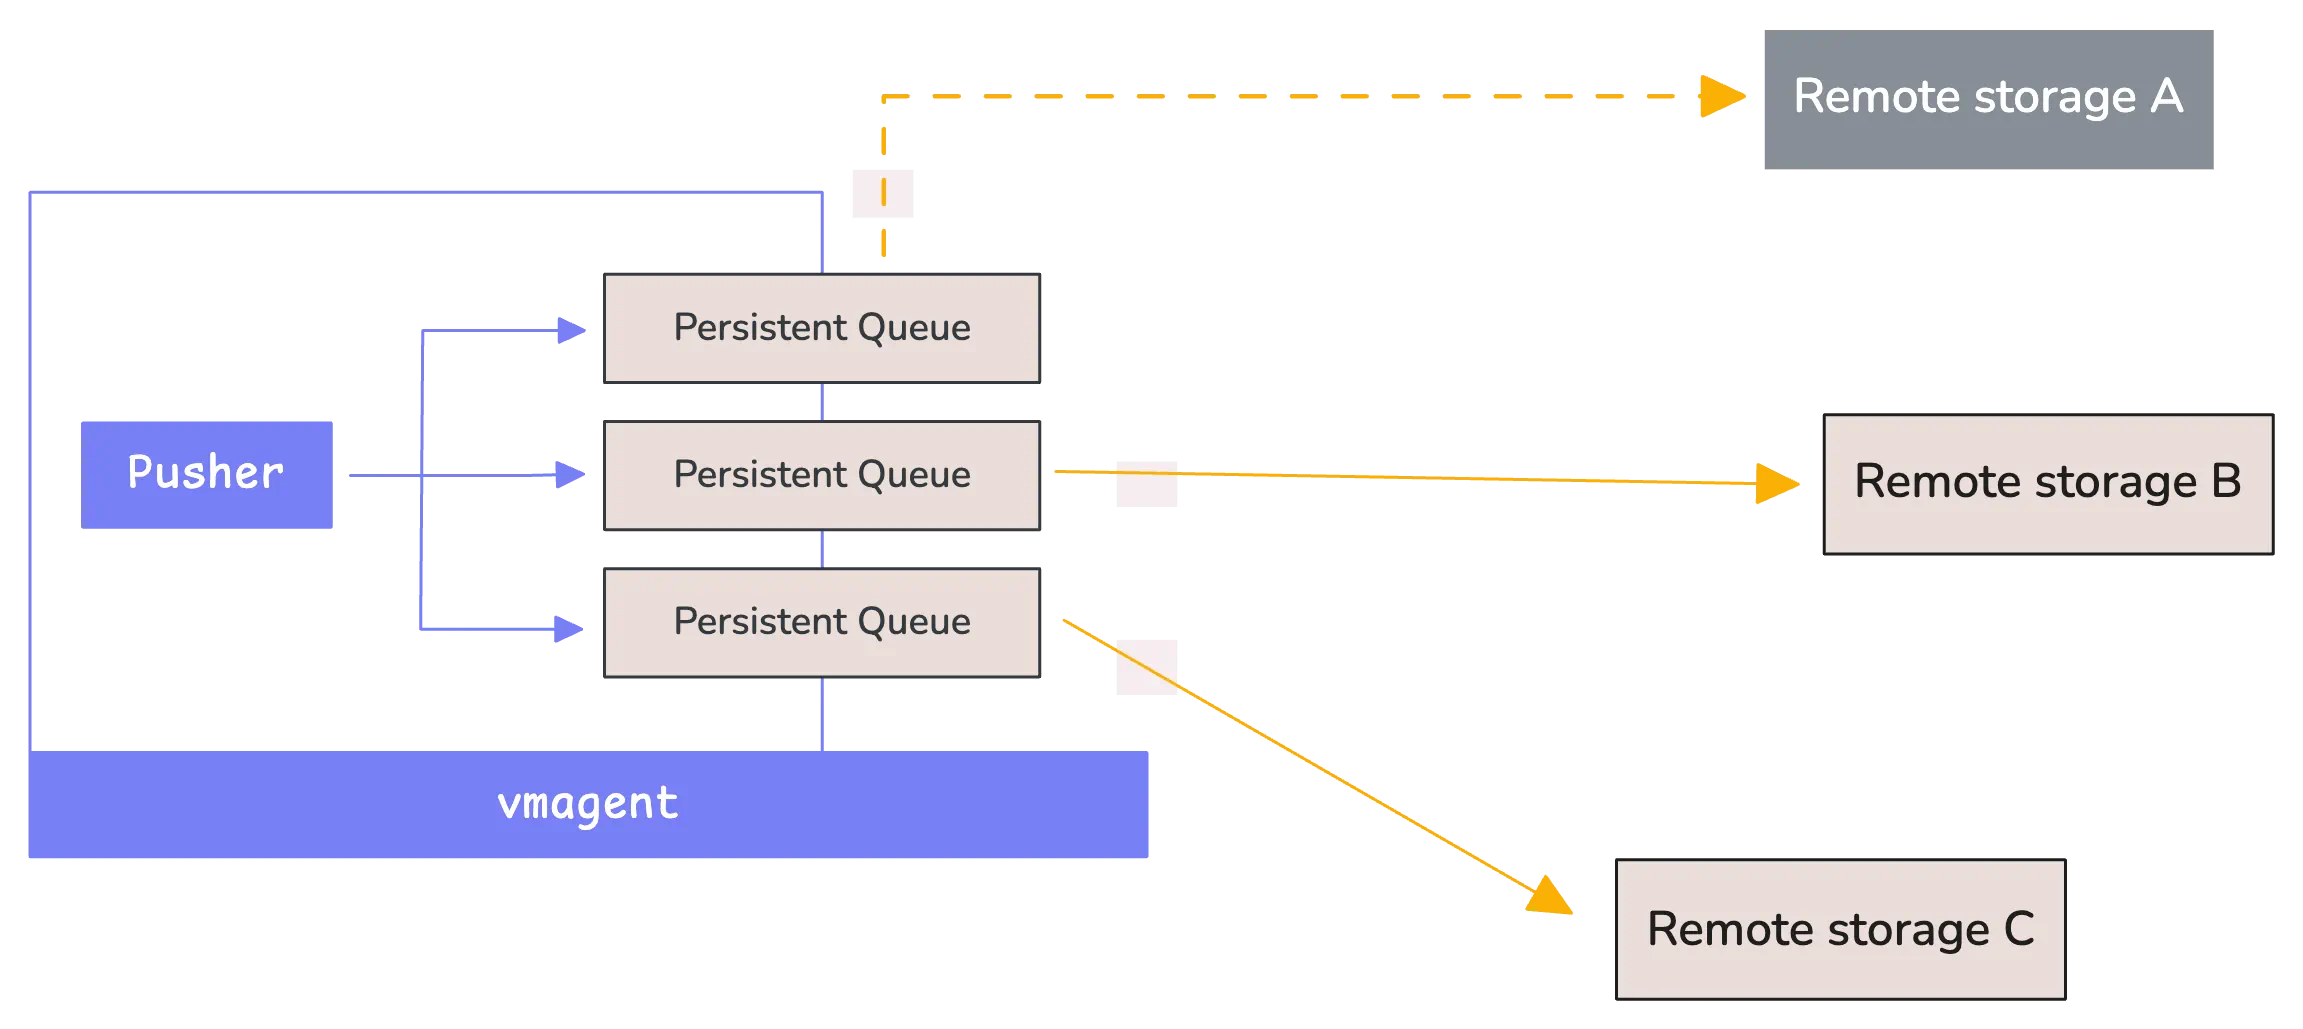
Once vmagent collects metrics, it needs to send them to remote storage systems like VictoriaMetrics. However, these storage systems can sometimes become temporarily unavailable.
When remote storage is unavailable, vmagent faces a choice:
- Without disk persistence, it would simply drop the incoming data, which creates gaps in your monitoring data. These gaps mean you lose important information about what happened during the outage period.
- With disk persistence enabled,
vmagentsaves the data locally on disk until the remote storage becomes available again.
This local storage acts as a safety buffer. vmagent continues collecting metrics and stores them in a local folder while waiting for the connection to be restored. Once the remote storage comes back online, vmagent automatically starts sending all the buffered data:
By default, vmagent creates a folder called vmagent-remotewrite-data to store this buffered data. If you are using a Helm chart deployment, the default path might be something like /tmpData instead.
You can change where this data gets stored by using the -remoteWrite.tmpDataPath flag when starting vmagent:
$ ./vmagent \
  -remoteWrite.url=http://victoria-metrics:8428/api/v1/write \
  -remoteWrite.tmpDataPath=/custom/path/buffer
vmagent organizes the buffered data efficiently. Each remote write destination gets its own separate folder inside the main buffer directory. The folder names follow a specific pattern that combines two pieces of information:
- The order number of the
-remoteWrite.urlflag, starting from 1. - A hash value calculated from the URL itself, but ignoring any query parameters or fragments.
/path/to/buffer/
└── persistent-queue/
    ├── 1_B9EB7BE220B91E9D/    # First remote write URL
    ├── 2_A8C7D6E5F4B3A291/    # Second remote write URL
    └── 3_F2E1D9C8B7A65430/    # Third remote write URL
You can control how much disk space vmagent uses for buffering data. The -remoteWrite.maxDiskUsagePerURL flag sets a limit for each remote write destination separately.
This prevents any single destination from using up all your disk space:
$ ./vmagent \
  -remoteWrite.url=http://storage1:8428/api/v1/write \
  -remoteWrite.url=http://storage2:8428/api/v1/write \
  -remoteWrite.maxDiskUsagePerURL=10GB
When the disk space limit is reached, vmagent automatically manages the buffer by deleting the oldest data first. This makes room for new incoming data while keeping the most recent information. The system stores data in chunks of approximately 500MB each, so it works best when you set the limit to multiples of 500MB.
Scaling vmagent
#
When you need high availability for your monitoring setup, you can run multiple vmagent instances that work together. High availability means your monitoring continues working even if one vmagent instance fails or goes down for maintenance.
To set up multiple vmagent instances, you need to configure them identically. This means:
- Each
vmagentinstance must scrape the same targets - Send data to the same remote storage systems.
In other words, they must have the same scrape configuration file, the same remote write destinations, and the same external labels in their configuration.
The reason for identical configuration is that both instances will collect the same metrics from the same targets. This creates duplicate data, but that’s intentional. If one instance fails, the other continues collecting and sending data, so you don’t lose any monitoring information.
However, since you now have duplicate data being sent to your storage system, you need to enable deduplication on the remote storage side (not vmagent side).
You should also use the -promscrape.cluster.name flag with different values for each instance. For example, you might use -promscrape.cluster.name=vmagent-1 for the first instance and -promscrape.cluster.name=vmagent-2 for the second instance.
This cluster name setting serves an important purpose: It creates small timing differences between when each vmagent instance scrapes the same targets:
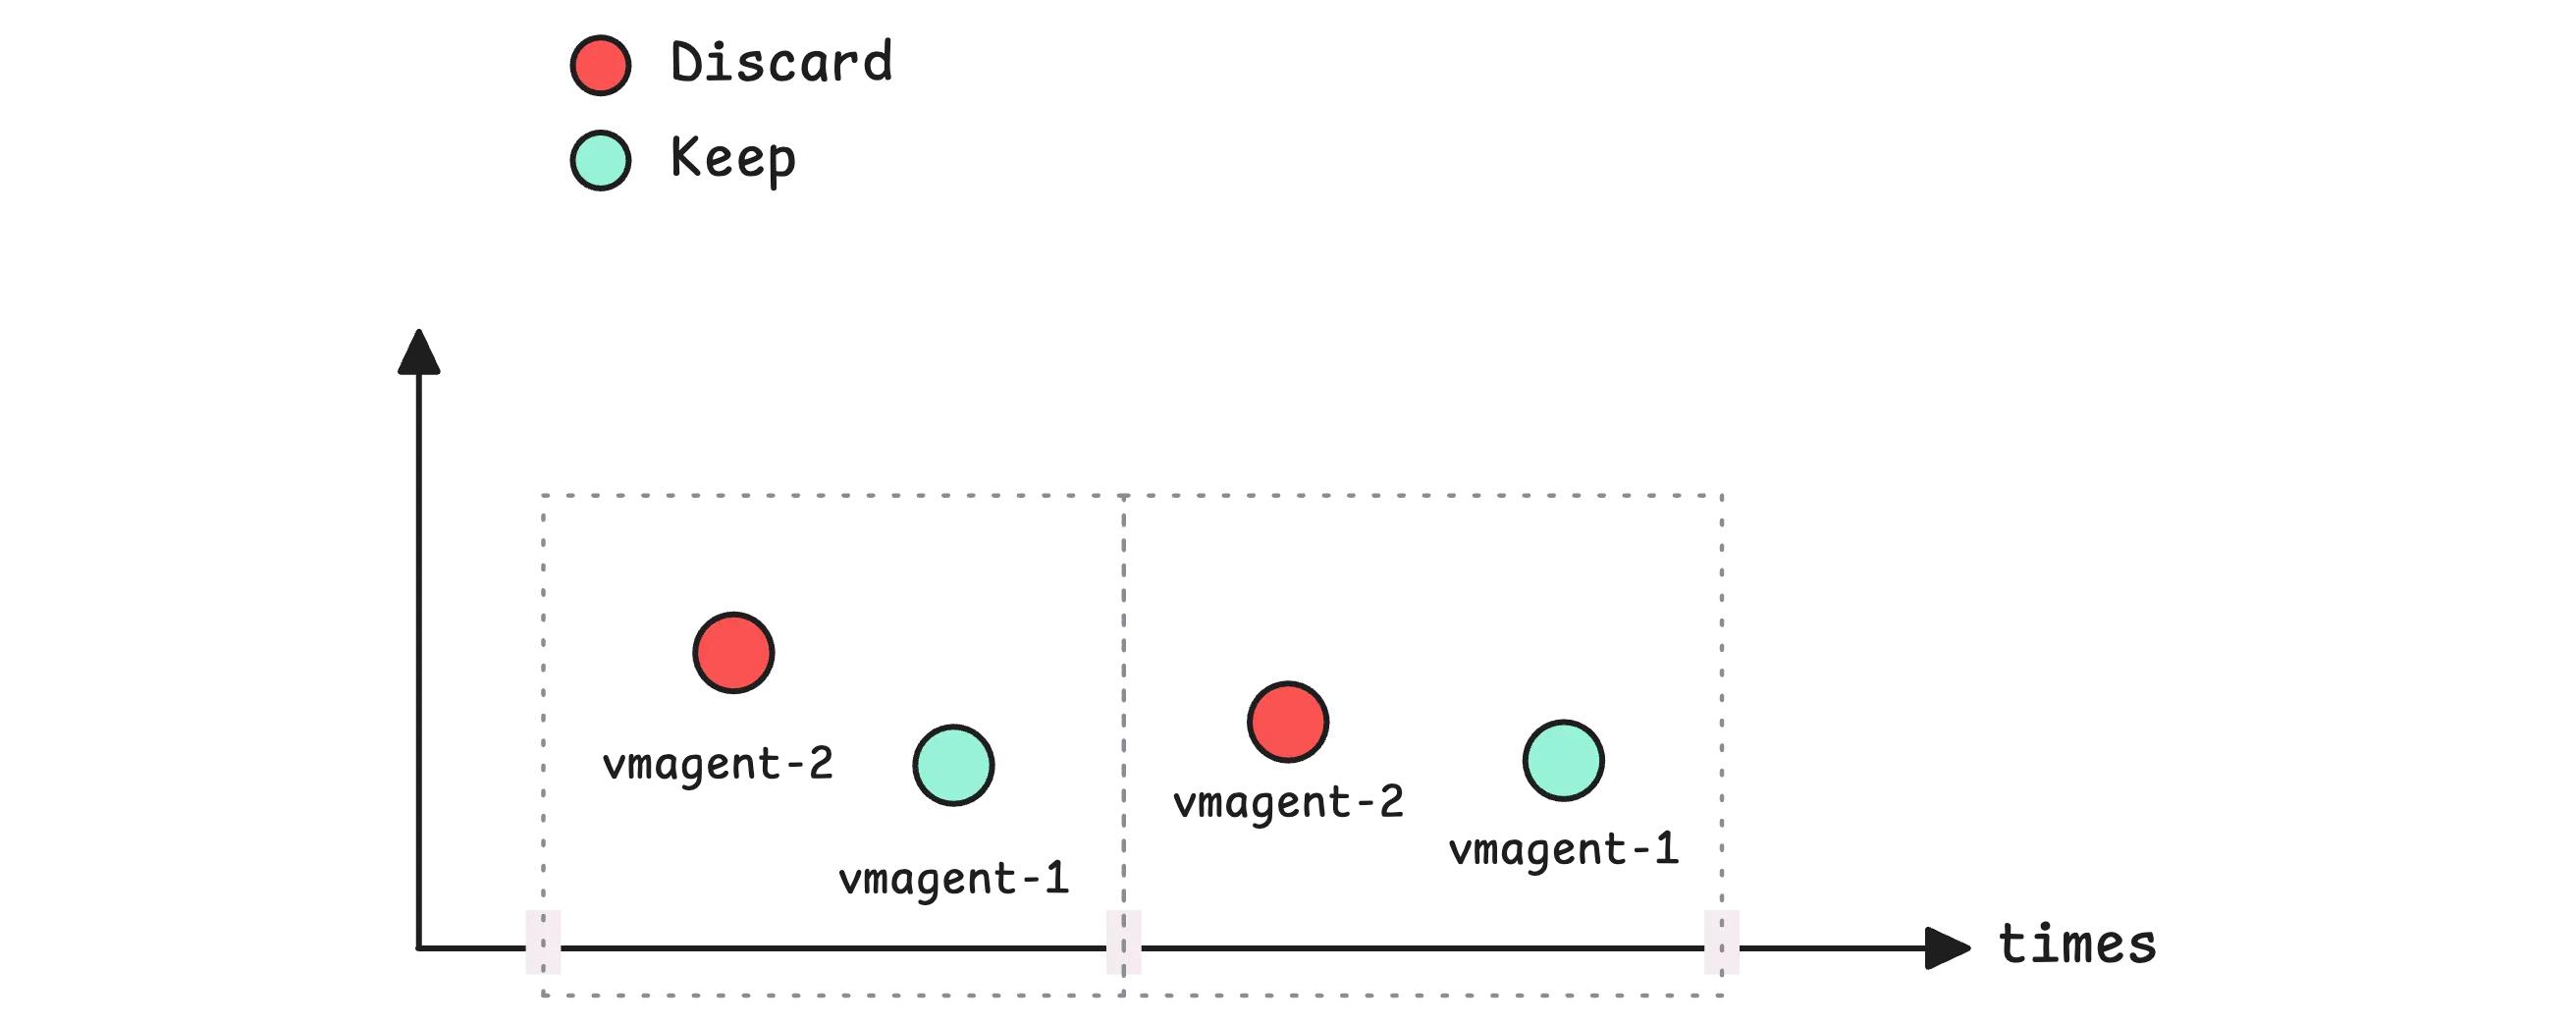
For example, if you have vmagent-1 and vmagent-2, and the deduplication window is 15 seconds, VictoriaMetrics will typically prefer samples from vmagent-1 and drop the duplicates from vmagent-2, as long as vmagent-1 is healthy and sending data.
This behavior makes your data ingestion predictable and reliable. You know which instance’s data will be kept, and the system automatically switches to the backup instance if the primary one fails.
Tip
The recommended setting for -dedup.minScrapeInterval should match your scrape interval setting from your Prometheus configuration. If you scrape metrics every 15 seconds, set -dedup.minScrapeInterval=15s on your VictoriaMetrics instance.
Monitoring
#
VictoriaMetrics provides a ready-to-use Grafana dashboard that helps you watch how vmagent is working. You can find this dashboard at Grafana Dashboard - VictoriaMetrics-agent.
This dashboard shows you important information about vmagent’s health and performance. It tracks how well vmagent is collecting metrics from your targets, how much CPU and memory it uses, and whether any errors are happening. The dashboard organizes this information into different sections that cover scraping activity, system resources, error rates, and data flow:
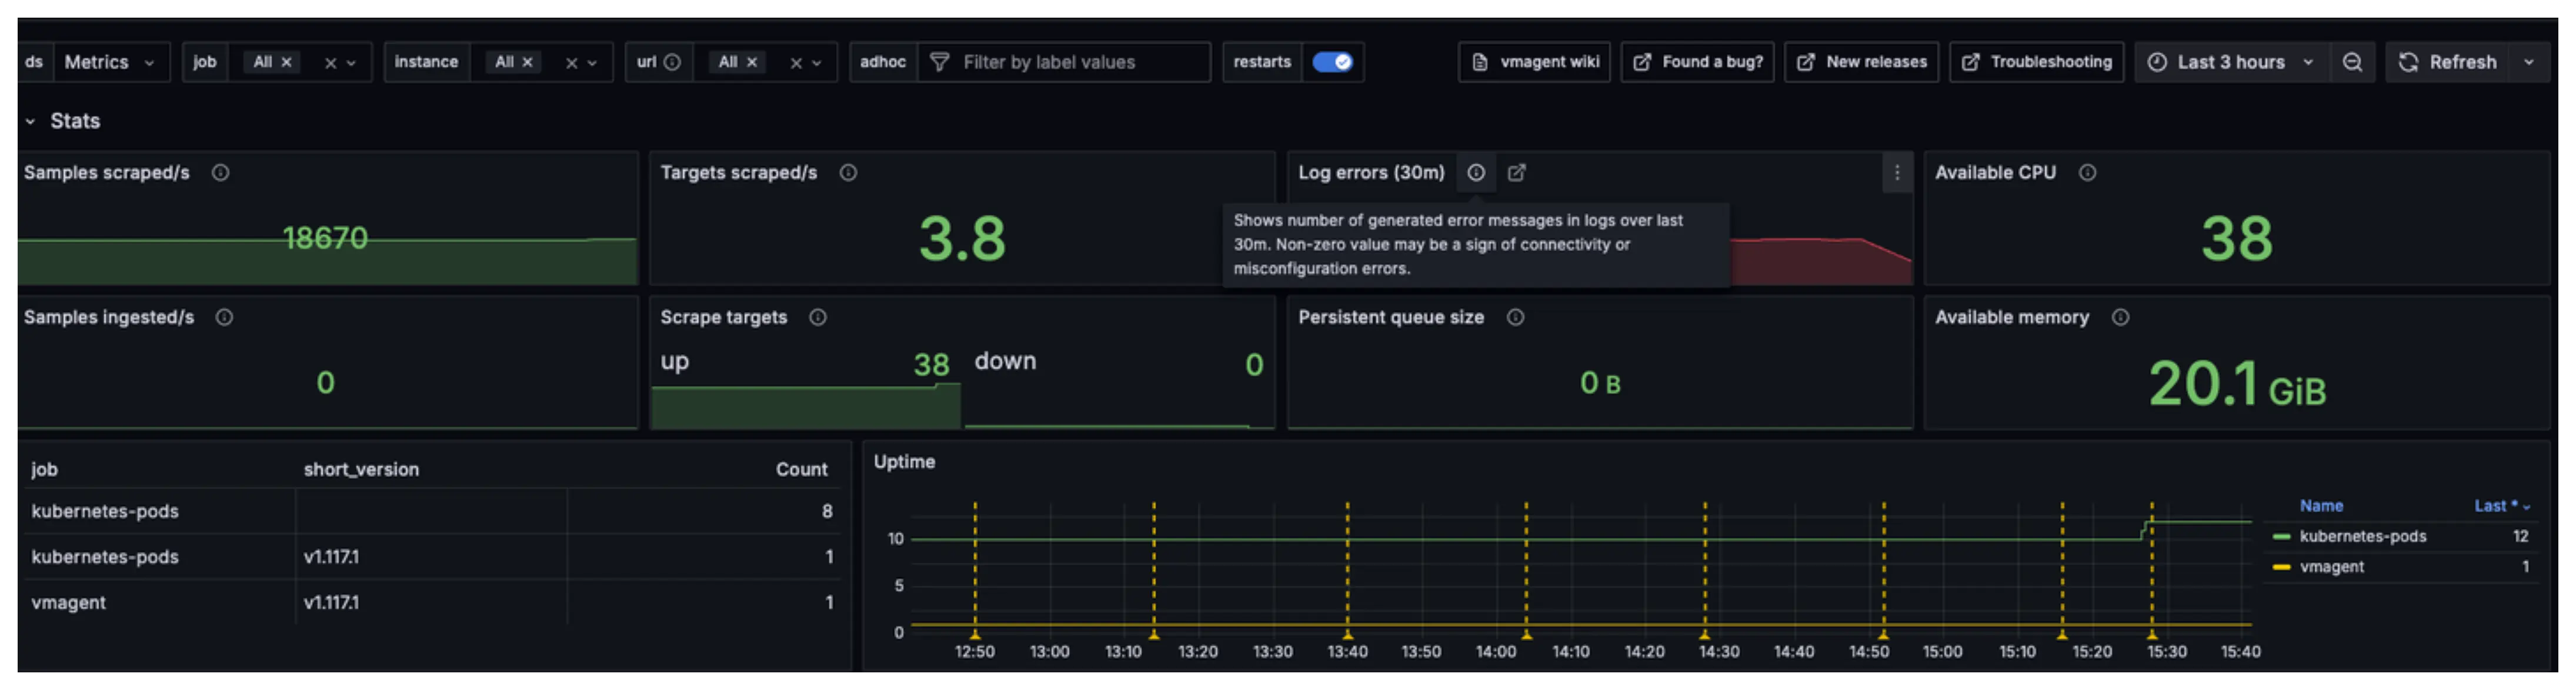
When something goes wrong, the dashboard makes it easy to spot problems. Charts turn red when values exceed safe limits, and error counters show when issues occur. For instance, if vmagent cannot reach a target, the scrape failure chart will show increased activity. If vmagent runs low on memory or CPU, the resource charts will display high usage percentages.
The dashboard also includes helpful descriptions for each chart that explain what the numbers mean and what actions you should take when problems appear. Many charts also include direct links to troubleshooting documentation that provides step-by-step solutions for common issues.
Besides the dashboard, there are several alerting rules you’ll receive when deploying through the VictoriaMetrics K8s Stack. These default rules cover the health of VictoriaMetrics components, the Kubernetes infrastructure, and common operational scenarios.
For example, here is an alert for vmagent (The full list is available here):
groups:
  - name: vmagent
    interval: 30s
    concurrency: 2
    rules:
      - alert: PersistentQueueIsDroppingData
        expr: sum(increase(vm_persistentqueue_bytes_dropped_total[5m])) without (path) > 0
        for: 10m
        labels:
          severity: critical
        annotations:
          dashboard: "http://localhost:3000/d/G7Z9GzMGz?viewPanel=49&var-instance={{ $labels.instance }}"
          summary: "Instance {{ $labels.instance }} is dropping data from persistent queue"
          description: "Vmagent dropped {{ $value | humanize1024 }} from persistent queue
              on instance {{ $labels.instance }} for the last 10m."
You can manually add these alerts to your alerting system (e.g. vmalert) if you want better visibility into VictoriaMetrics’ components performance.
Who We Are
#
Need to monitor your services to see how everything performs and to troubleshoot issues? VictoriaMetrics is a fast, open-source, and cost-efficient way to stay on top of your infrastructure’s performance.
If you come across anything outdated or have questions, feel free to send me a DM on X (@func25).
Leave a comment below or Contact Us if you have any questions!
comments powered by Disqus