- Blog /
- How vmagent Collects and Ships Metrics Fast with Aggregation, Deduplication, and More
How vmagent Collects and Ships Metrics Fast with Aggregation, Deduplication, and More
This piece is part of our ongoing VictoriaMetrics series where we break down how different components of the system do their thing:
- How VictoriaMetrics Agent (vmagent) Works (We’re here)
- How vmstorage Handles Data Ingestion
- How vmstorage Processes Data: Retention, Merging, Deduplication,…
- When Metrics Meet vminsert: A Data-Delivery Story
- How vmstorage’s IndexDB Works
- How vmstorage Handles Query Requests From vmselect
- Inside vmselect: The Query Processing Engine of VictoriaMetrics
What is vmagent?
#
VictoriaMetrics agent, or vmagent, is a lightweight tool designed to gather metrics from a number of different sources.
Once it pulls in all those metrics, vmagent lets you “design” them (through “relabeling”) or filter them down (doing things like reducing cardinality, stream aggregation, deduplication, and so on) before shipping them off to wherever you want to store them.
We’ll get into all these techniques as we go along.
Now, vmagent can send these processed metrics to a storage system like VictoriaMetrics, or really anywhere that supports the Prometheus remote write protocol. It also has support for VictoriaMetrics’ own remote write protocol, which is a more efficient way to handle high-volume data ingestion.
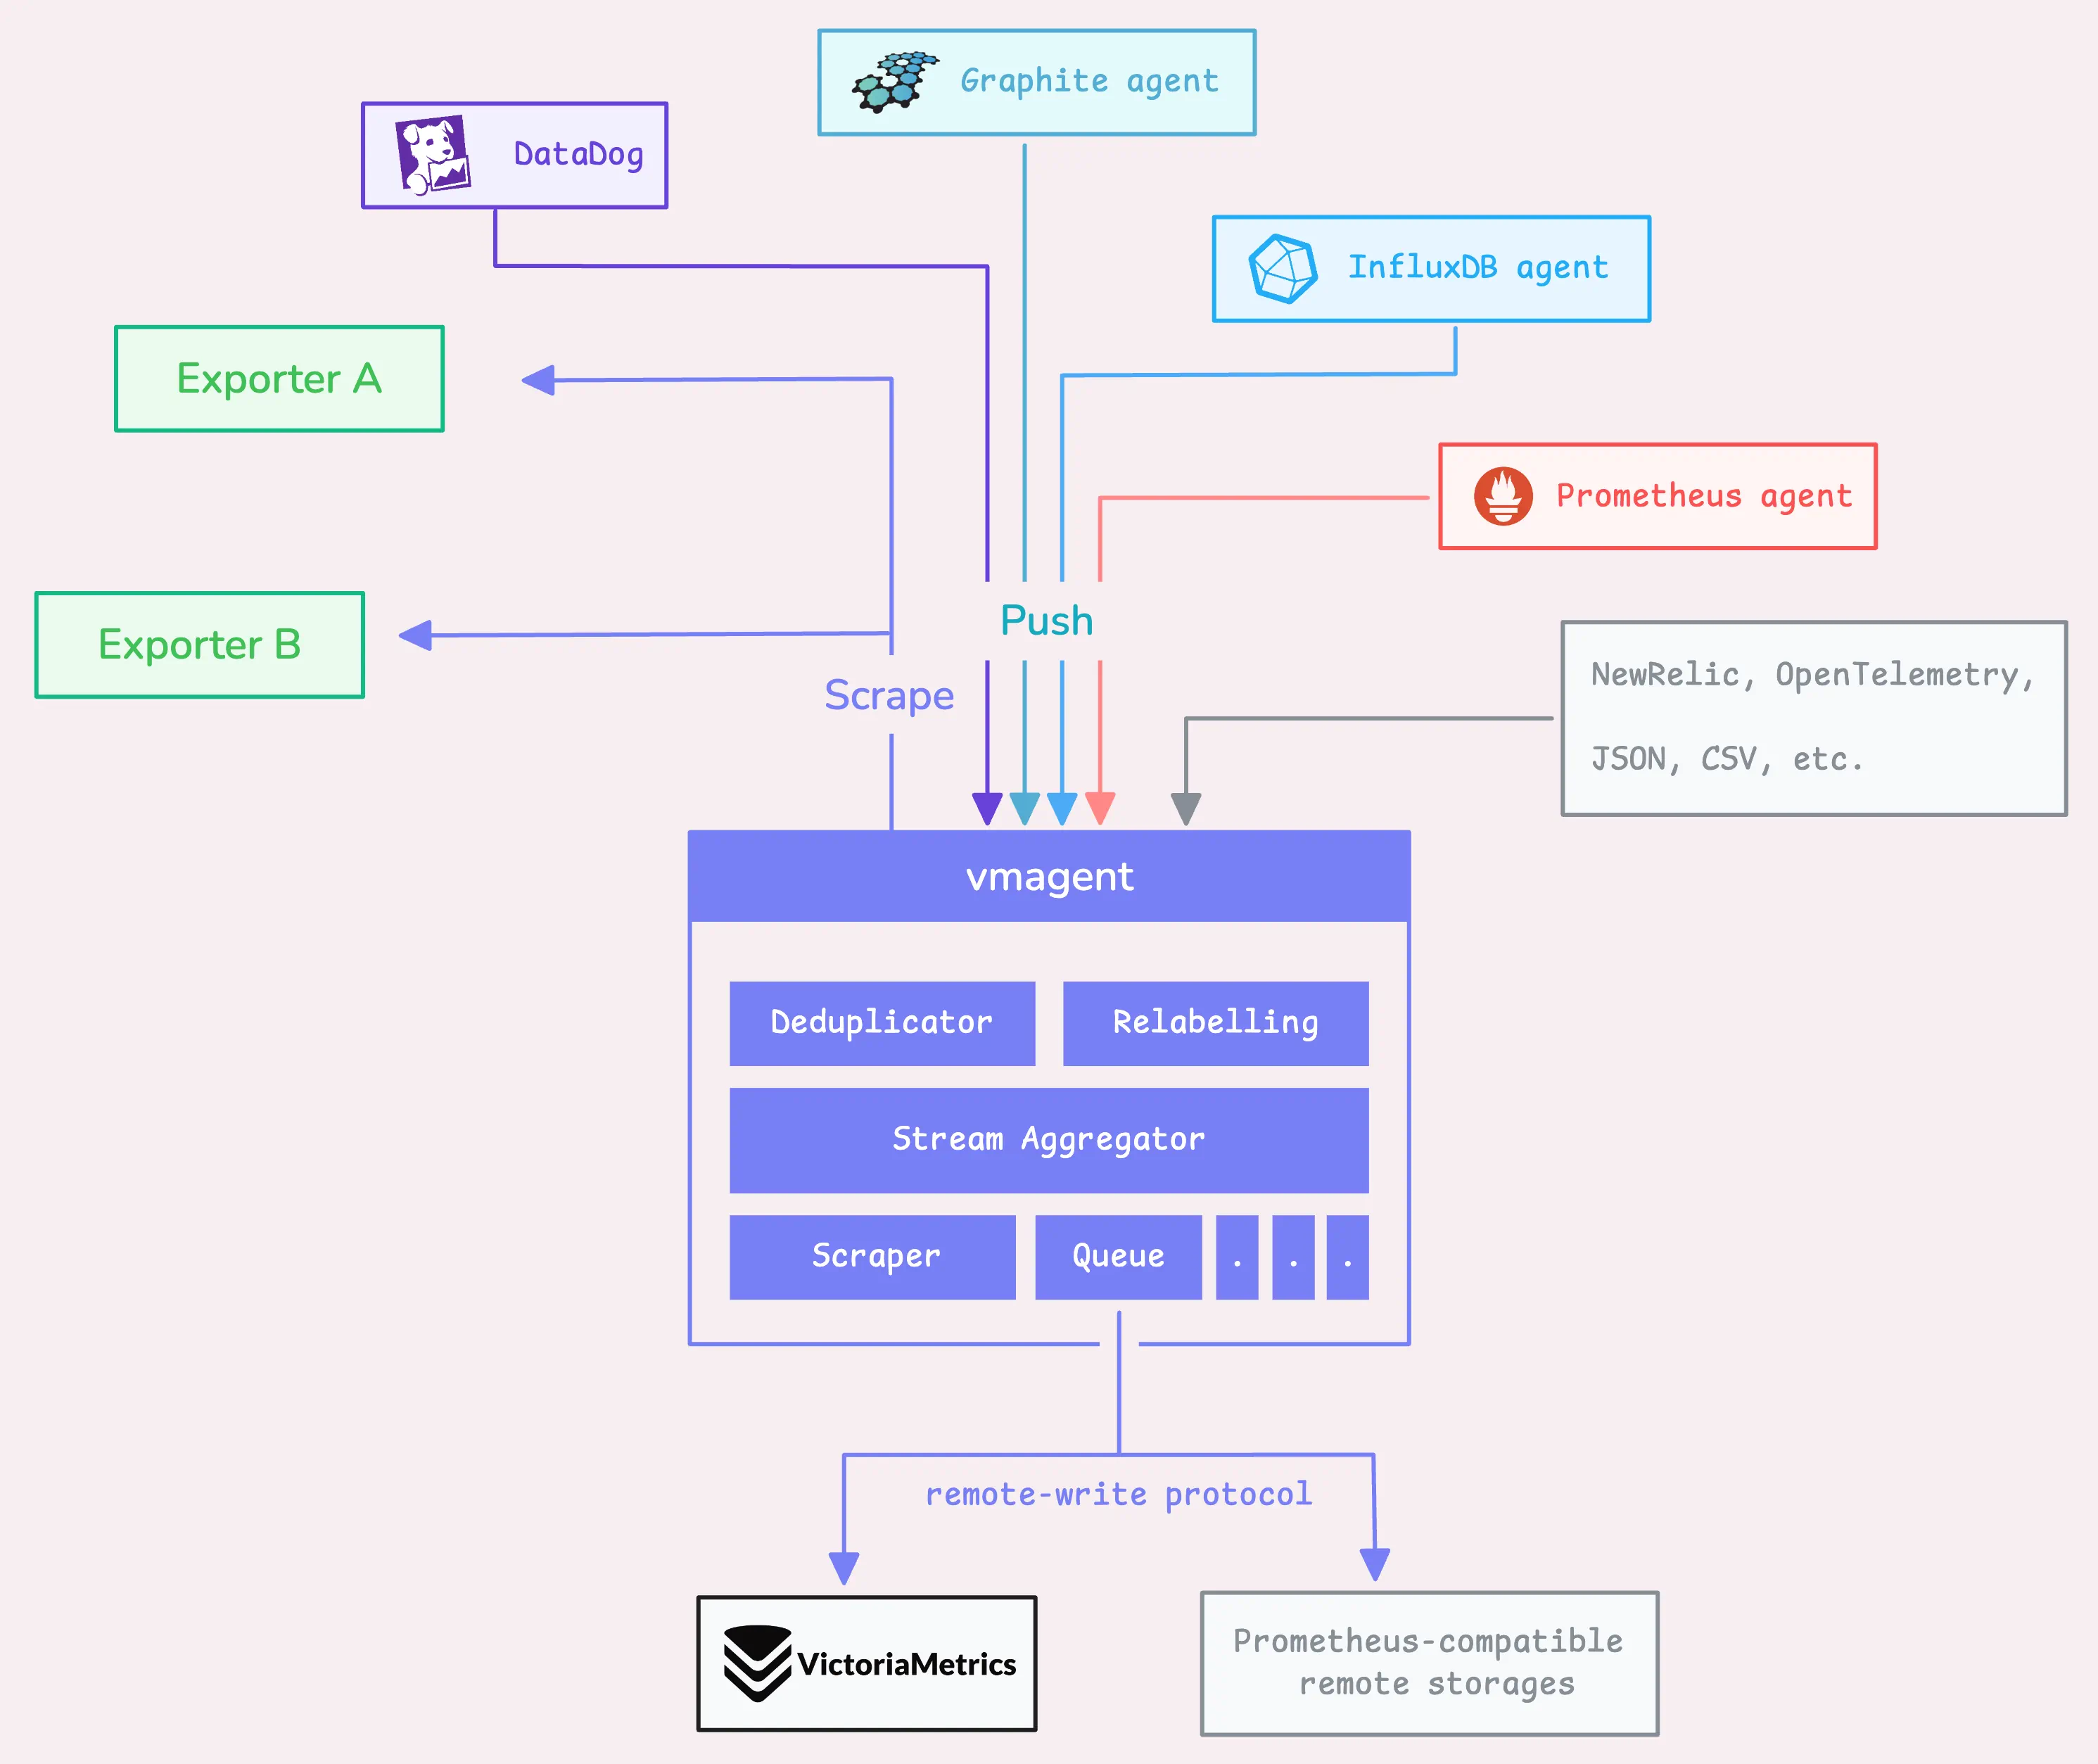
On top of that, vmagent collects a range of performance metrics from itself. These metrics are presented in a Prometheus-compatible format, so you can check them out at http://<vmagent-host>:8429/metrics.
In this discussion, we’ll dig into how vmagent works under the hood.
If you’ve already been using it, things should start clicking in terms of the flags you’ve set, the metrics it exposes, the log messages you see, and the documentation you’ve gone through.
Note: a few things to keep in mind
- Flags we mention will begin with a dash (
-), e.g.-remoteWrite.url. - Numbers we reference are the default values (these work well for most setups), but you can modify them using flags.
- If you’re using a Helm chart, some defaults might differ due to the chart’s configuration tweaks.
- Internal things are not intended to be relied on; they could be changed at any time.
If you have a topic in mind that you’d like us to cover, you can drop a DM to X (@func25) or connect with us on VictoriaMetrics’ Slack. We’re always looking for ideas and will focus on the most-requested ones. Thanks for sharing your suggestions!
Step 1: Receiving Data via API or Scrape
#
1. HTTP API
#
When you’re sending data to vmagent using the HTTP API, you can actually tack on extra labels to your data points.
It’s pretty easy – you can do this either by adding them as query parameters (?extra_label=foo=bar&extra_label=baz=aaa) or by using a Pushgateway-style format in the URL itself (metrics/job/my_app/instance/host123)
Concurrency Limiter
#
Now, here’s how vmagent handles the data: It reads the data with a concurrency limiter. By default, it allows a maximum of 2x the number of available CPU cores for concurrent inserts (-maxConcurrentInserts). If you’re dealing with a slow network, bumping up this number might help with data transfer speeds, but keep in mind it’ll also consume more resources.
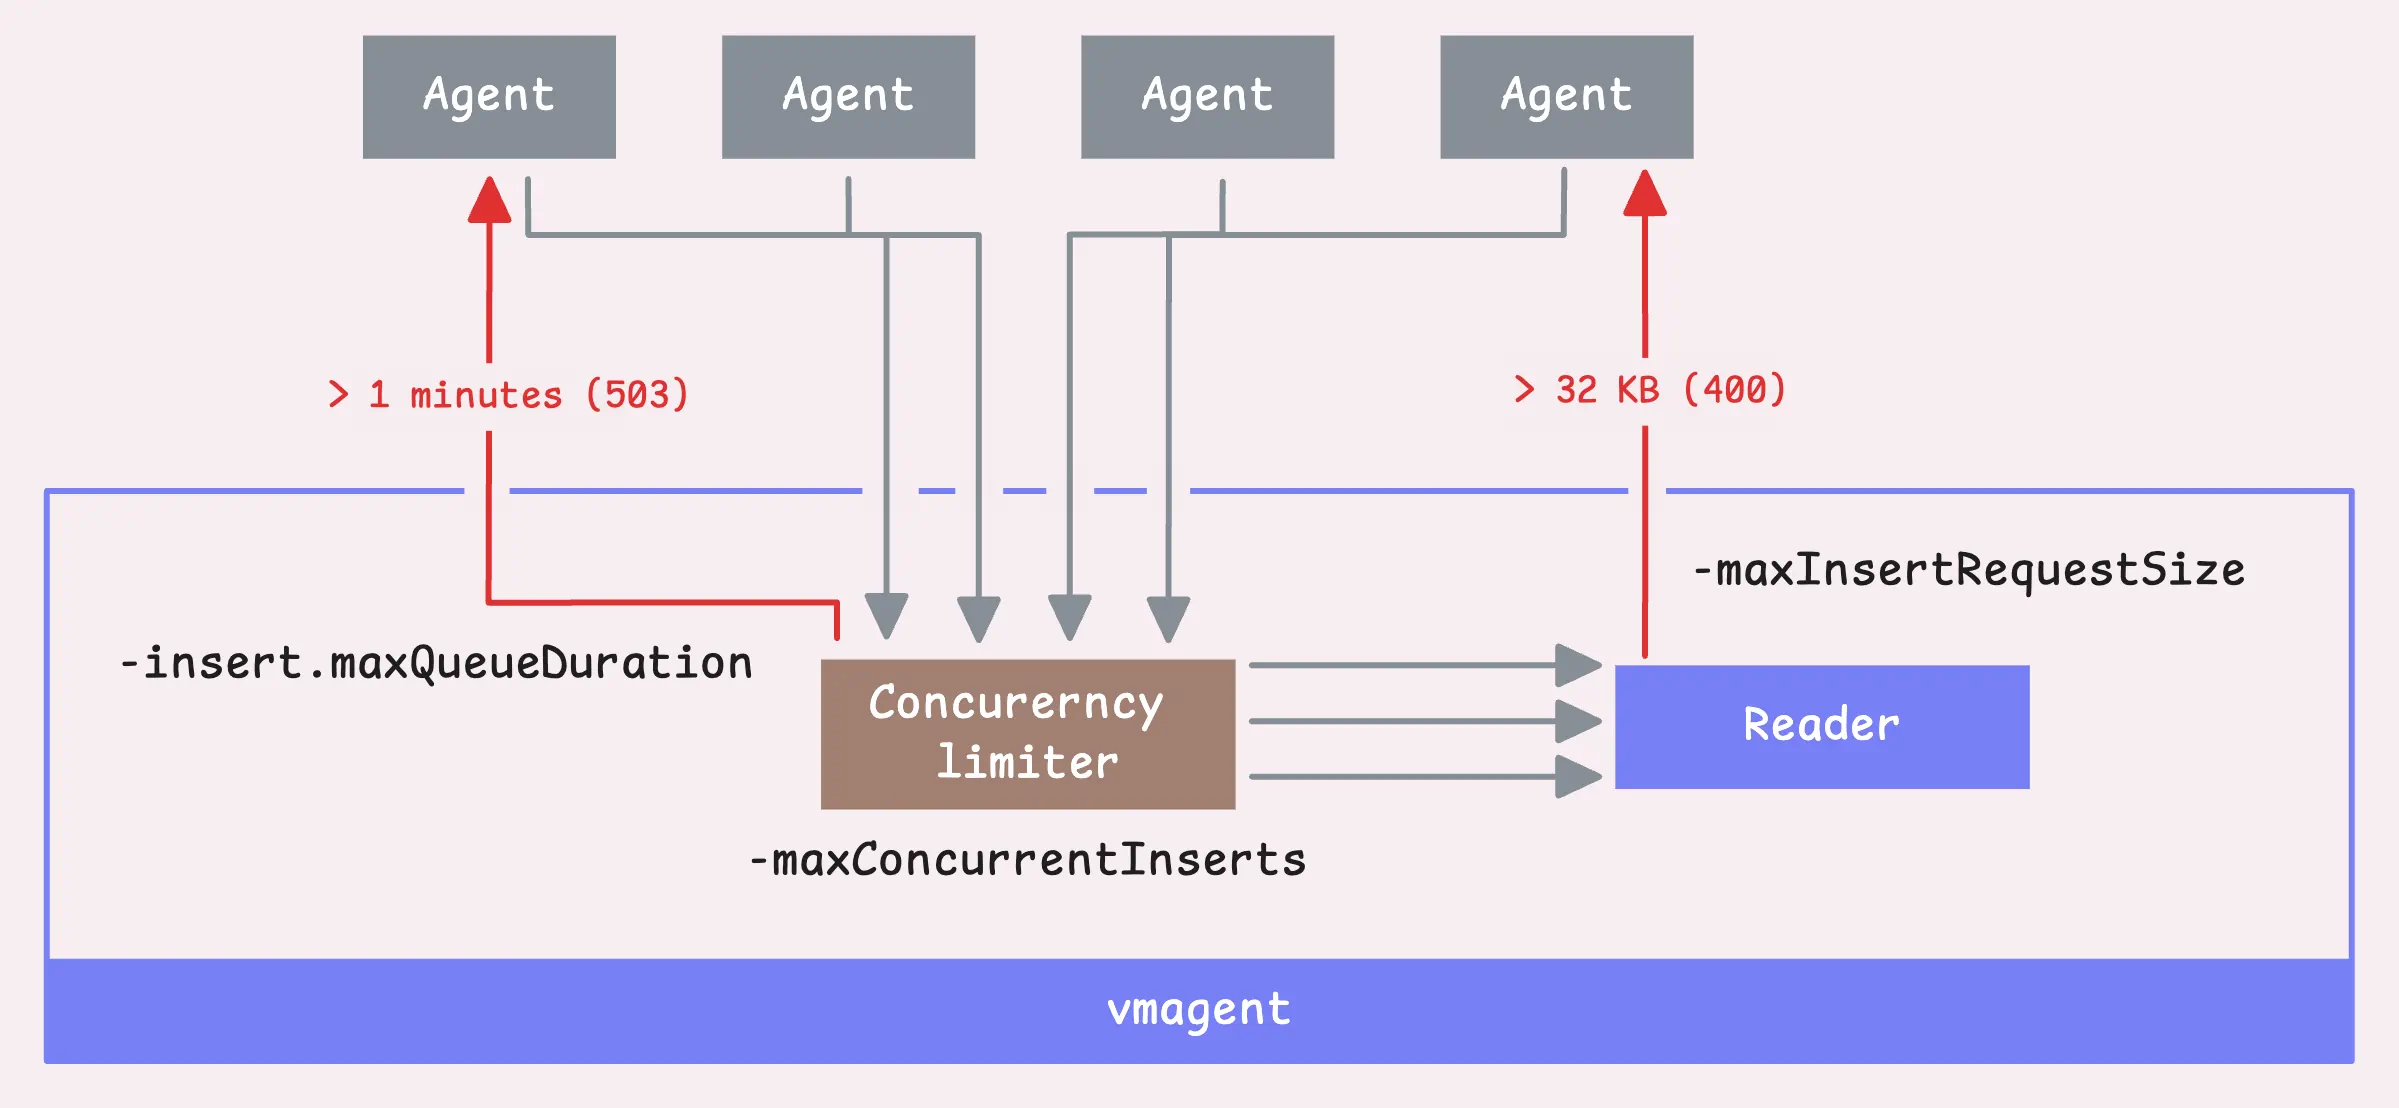
If a request is held up for more than 1 minute (-insert.maxQueueDuration), vmagent will send back a 503 error.
“Why does vmagent need to limit the number of concurrent inserts?”
It may seem that more concurrent requests mean higher throughput, but in fact, it doesn’t.
Each chunk takes up memory for both the original data and for storing parsed results. If there’s no limit on the number of goroutines doing this parsing, then every client connection will spawn a goroutine that creates these memory-hungry buffers.
Each goroutine for parsing would need a data buffer of up to 32MB, plus more space (2–4 times that) for storing parsed samples. At that scale, memory requirements shoot up to over 100GB.
And that’s unsustainable for most setups.
We restrict the active parsers to the number of available CPU cores. This way, only as many goroutines as there are CPU cores will parse data at any given time, while the remaining connections wait their turn.
“So why is there a flag to control that? isn’t it better to use default?”
The default is good for most cases, but if you’re dealing with a slow network, it’s better to increase this number.
When a client has a slow network, data doesn’t arrive all at once.
Instead, it dribbles in slowly. Since the concurrency limiter is already in place, vmagent has to sit and wait, leaving some concurrency slots tied up.
Now, we’re ready to read the request, but there’s a hard limit on the size of the request body (-maxInsertRequestSize), up to 32 MB.
Tip: Useful metrics
- Number of requests that have come to vmagent:
vmagent_http_requests_total. - Number of requests that have come to vmagent and have been read (either successfully or not):
vm_protoparser_read_calls_total. - Number of requests that failed to be read, either because they exceeded the max size limit or for other reasons:
vm_protoparser_read_errors_total. - Number of failed requests for any reason:
vm_protoparser_max_request_size_exceeded_total.
Decompression
#
Once the data is read, vmagent decompresses it based on the compression type specified in the request header.
The snappy and zstd decompression is applied only for probuf-encoded data in the Prometheus remote write protocol:
- Google’s Snappy: This is compatible with Prometheus and used for data encoded in Protobuf with the remote write protocol.
- Facebook’s Zstandard (or zstd): Works the same way as Snappy, so it’s a good alternative.
- Gzip: For data from other protocols (InfluxDB, OpenTelemetry, etc.), we support it with gzip compression or even without any compression if that’s the route you’re taking.
VictoriaMetrics’ remote write protocol is pretty similar to Prometheus’, but it uses zstd compression, which can reduce network traffic by 2x to 4x, but it comes with a tradeoff of about 10% higher CPU usage.
Read more about this tradeoffs in Save network costs with VictoriaMetrics remote write protocol - Aliaksandr Valialkin
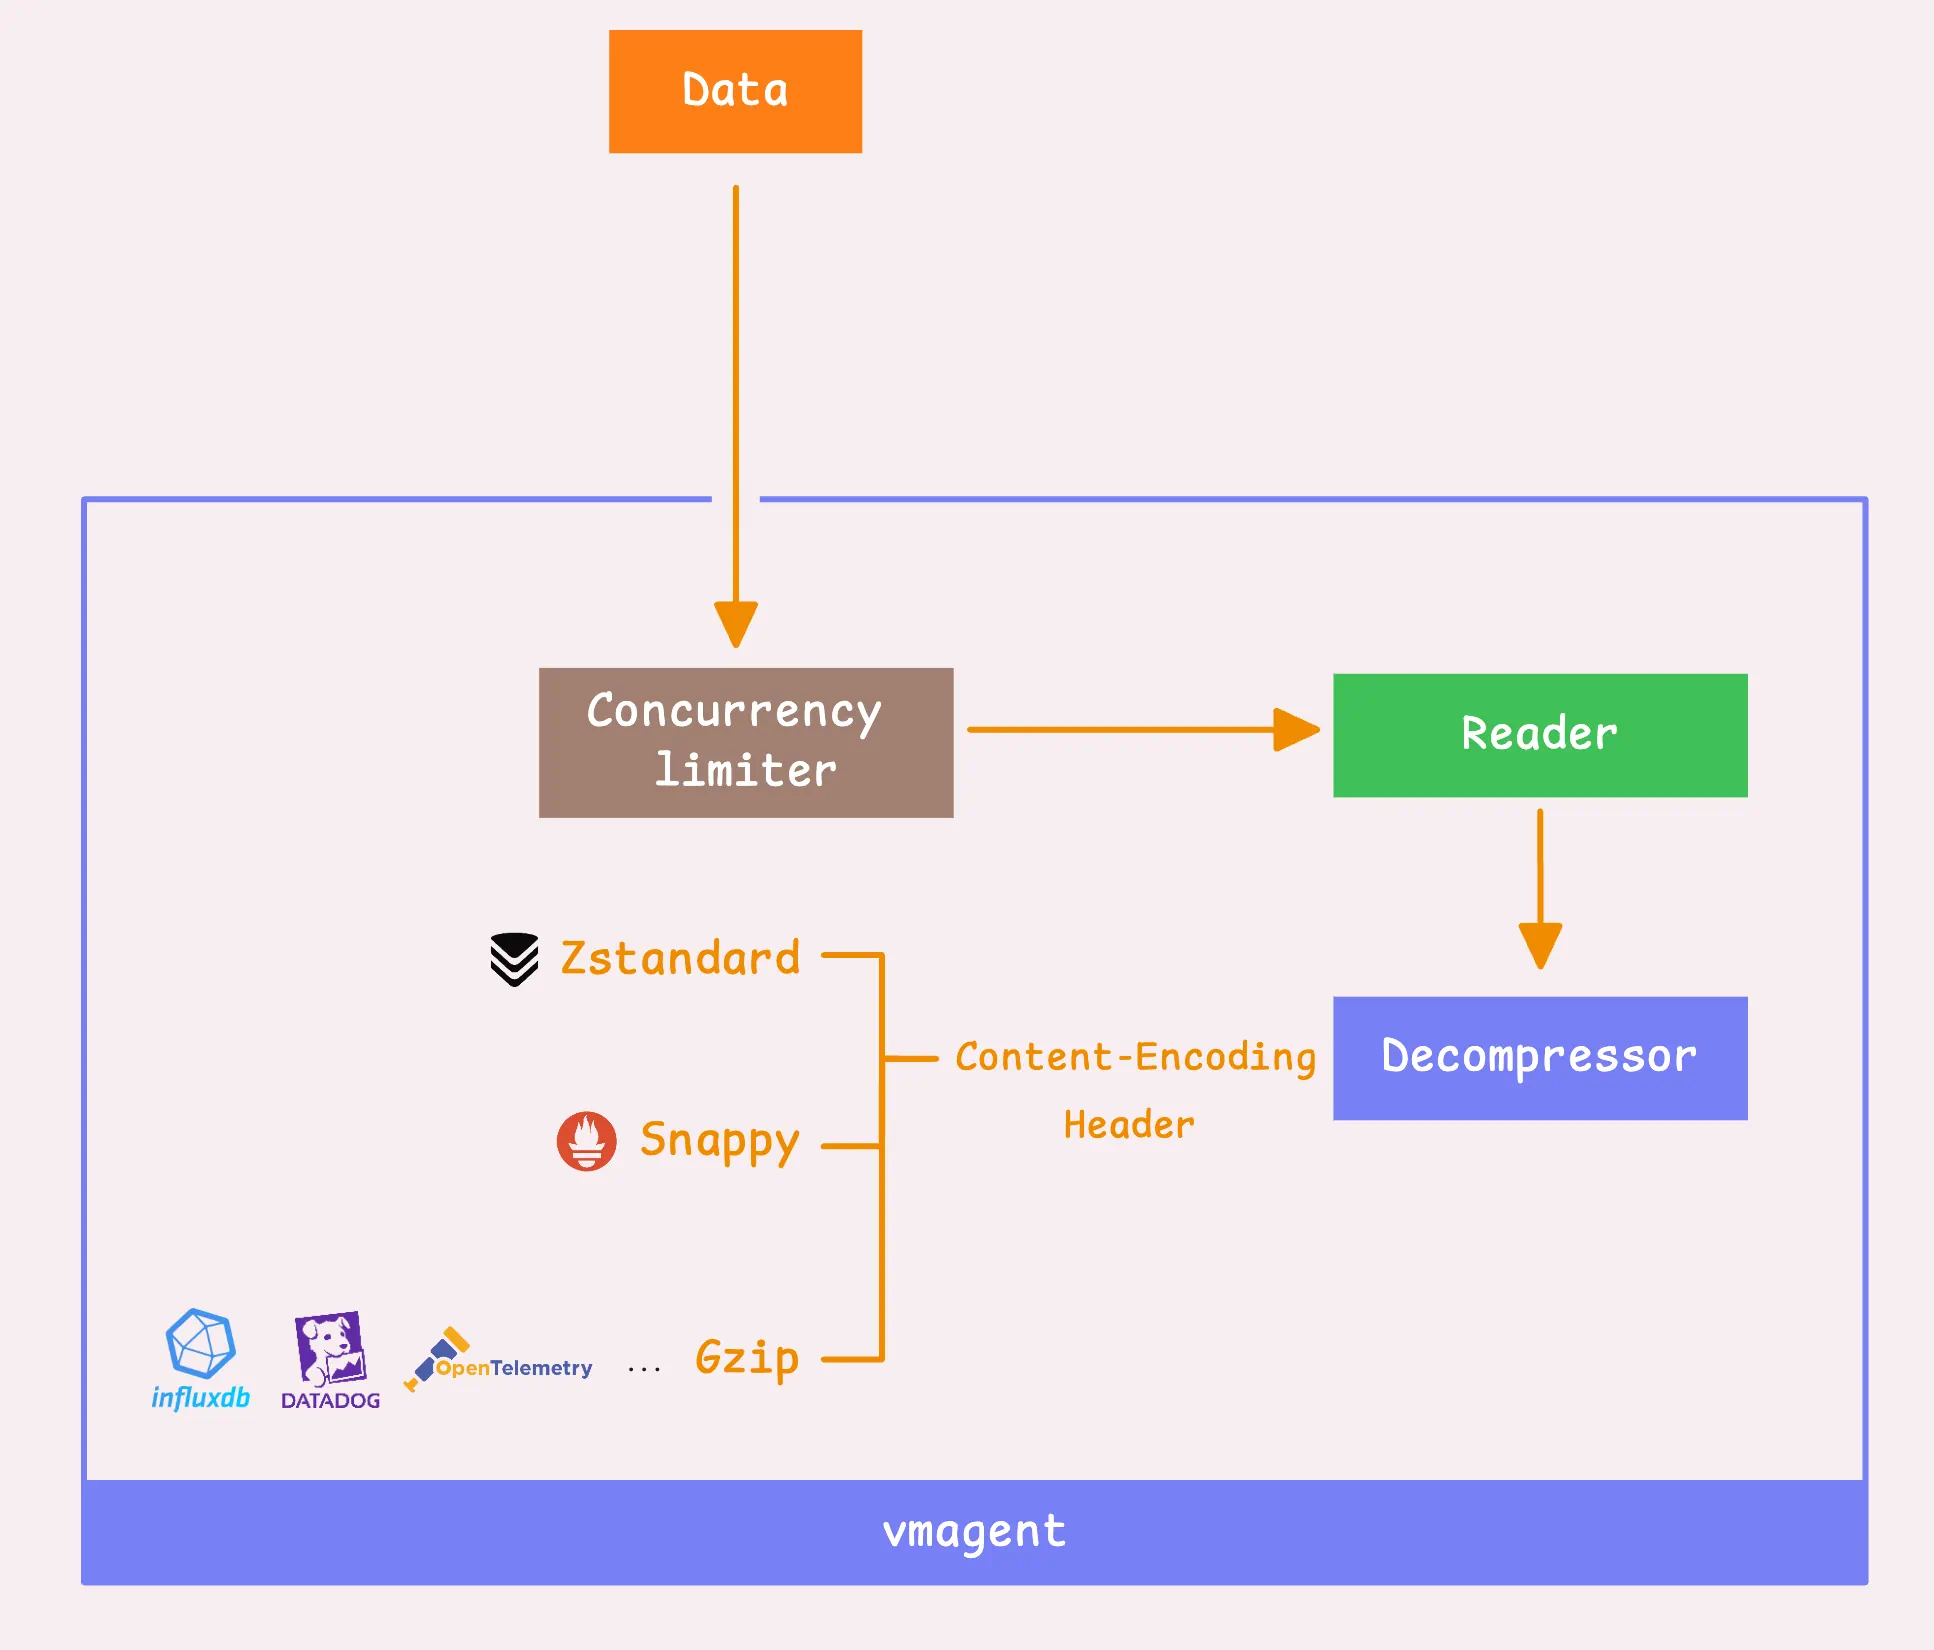
If vmagent is pushing data to VictoriaMetrics storage, it will use zstd compression by default. However, if there’s a mismatch or communication issue between vmagent and the storage, it’ll fall back to using snappy instead.
Other protocols either do not support compression or offer optional gzip compression. For instance, DataDog’s protocol supports both gzip and deflate, while most other protocols (InfluxDB, NewRelic, etc.) only support gzip compression.
Once the data is decompressed, the “metric name” gets converted into a label.
Technically, there’s no actual “metric name” under the hood, it’s just a special label called __name__. After this, the data is ready to move into the next processing stages.
Tip: Useful metrics
- Total number of rows inserted (counter):
vmagent_rows_inserted_total{type="promremotewrite"}. - Rows inserted per tenant (if multi-tenant mode is enabled):
vmagent_tenant_inserted_rows_total. - Rows inserted per request (histogram):
vmagent_rows_per_insert.
These give you a nice snapshot of how much data vmagent is handling at this point in the process.
2. Scraping
#
Instead of pushing data directly via the HTTP API, vmagent can also scrape metrics from targets at regular intervals.
These “regular intervals” are set either in the global field or for specific targets in the scrape config file.
config:
  global:
    scrape_interval: 10s
  scrape_configs:
    - job_name: "kubernetes-service-endpoints-slow"
      scrape_interval: 5m
      scrape_timeout: 30s
      ...
If you don’t set a global or target-specific scrape interval, it defaults to a 1-minute interval. Same thing with the scrape timeout, it defaults to 10 seconds. And in cases where the scrape interval is shorter than the timeout, the timeout takes priority.
At this point, vmagent sends out requests to scrape metrics from the targets, keeping that timeout in mind.
When the response body is too big, vmagent will drop any data exceeding 16 MB (-promscrape.maxScrapeSize). You can tweak this limit globally or for individual targets if you need to.
Tip: Useful metrics
- How many scrape requests have been made so far:
vm_promscrape_scrape_requests_total - How many scrapes were successful:
vm_promscrape_scrapes_total{status_code="200"} - Did any scrape responses exceed the size limit:
vm_promscrape_max_scrape_size_exceeded_errors_total - How often did a scrape time out:
vm_promscrape_scrapes_timed_out_total - How long is each scrape taking:
vm_promscrape_scrape_duration_seconds - How big are the scrape responses?:
vm_promscrape_scrape_response_size_bytes - How many scrapes have failed:
vm_promscrape_scrapes_failed_total
Once vmagent has the full response body loaded into memory, it can handle it in two ways: stream mode (this processes the data chunk by chunk) and one-shot mode (processes the entire scrape response in a single step).
Stream Mode & One-shot Mode
#
Both stream mode and one-shot mode have their own pros and cons.
For smaller scrape responses, one-shot mode tends to be more efficient since it has less overhead in setting up the context. In contrast, for larger responses, stream mode can be more resource-friendly as it processes the data in 64 KB chunks, working sequentially (not concurrently) rather than all at once.
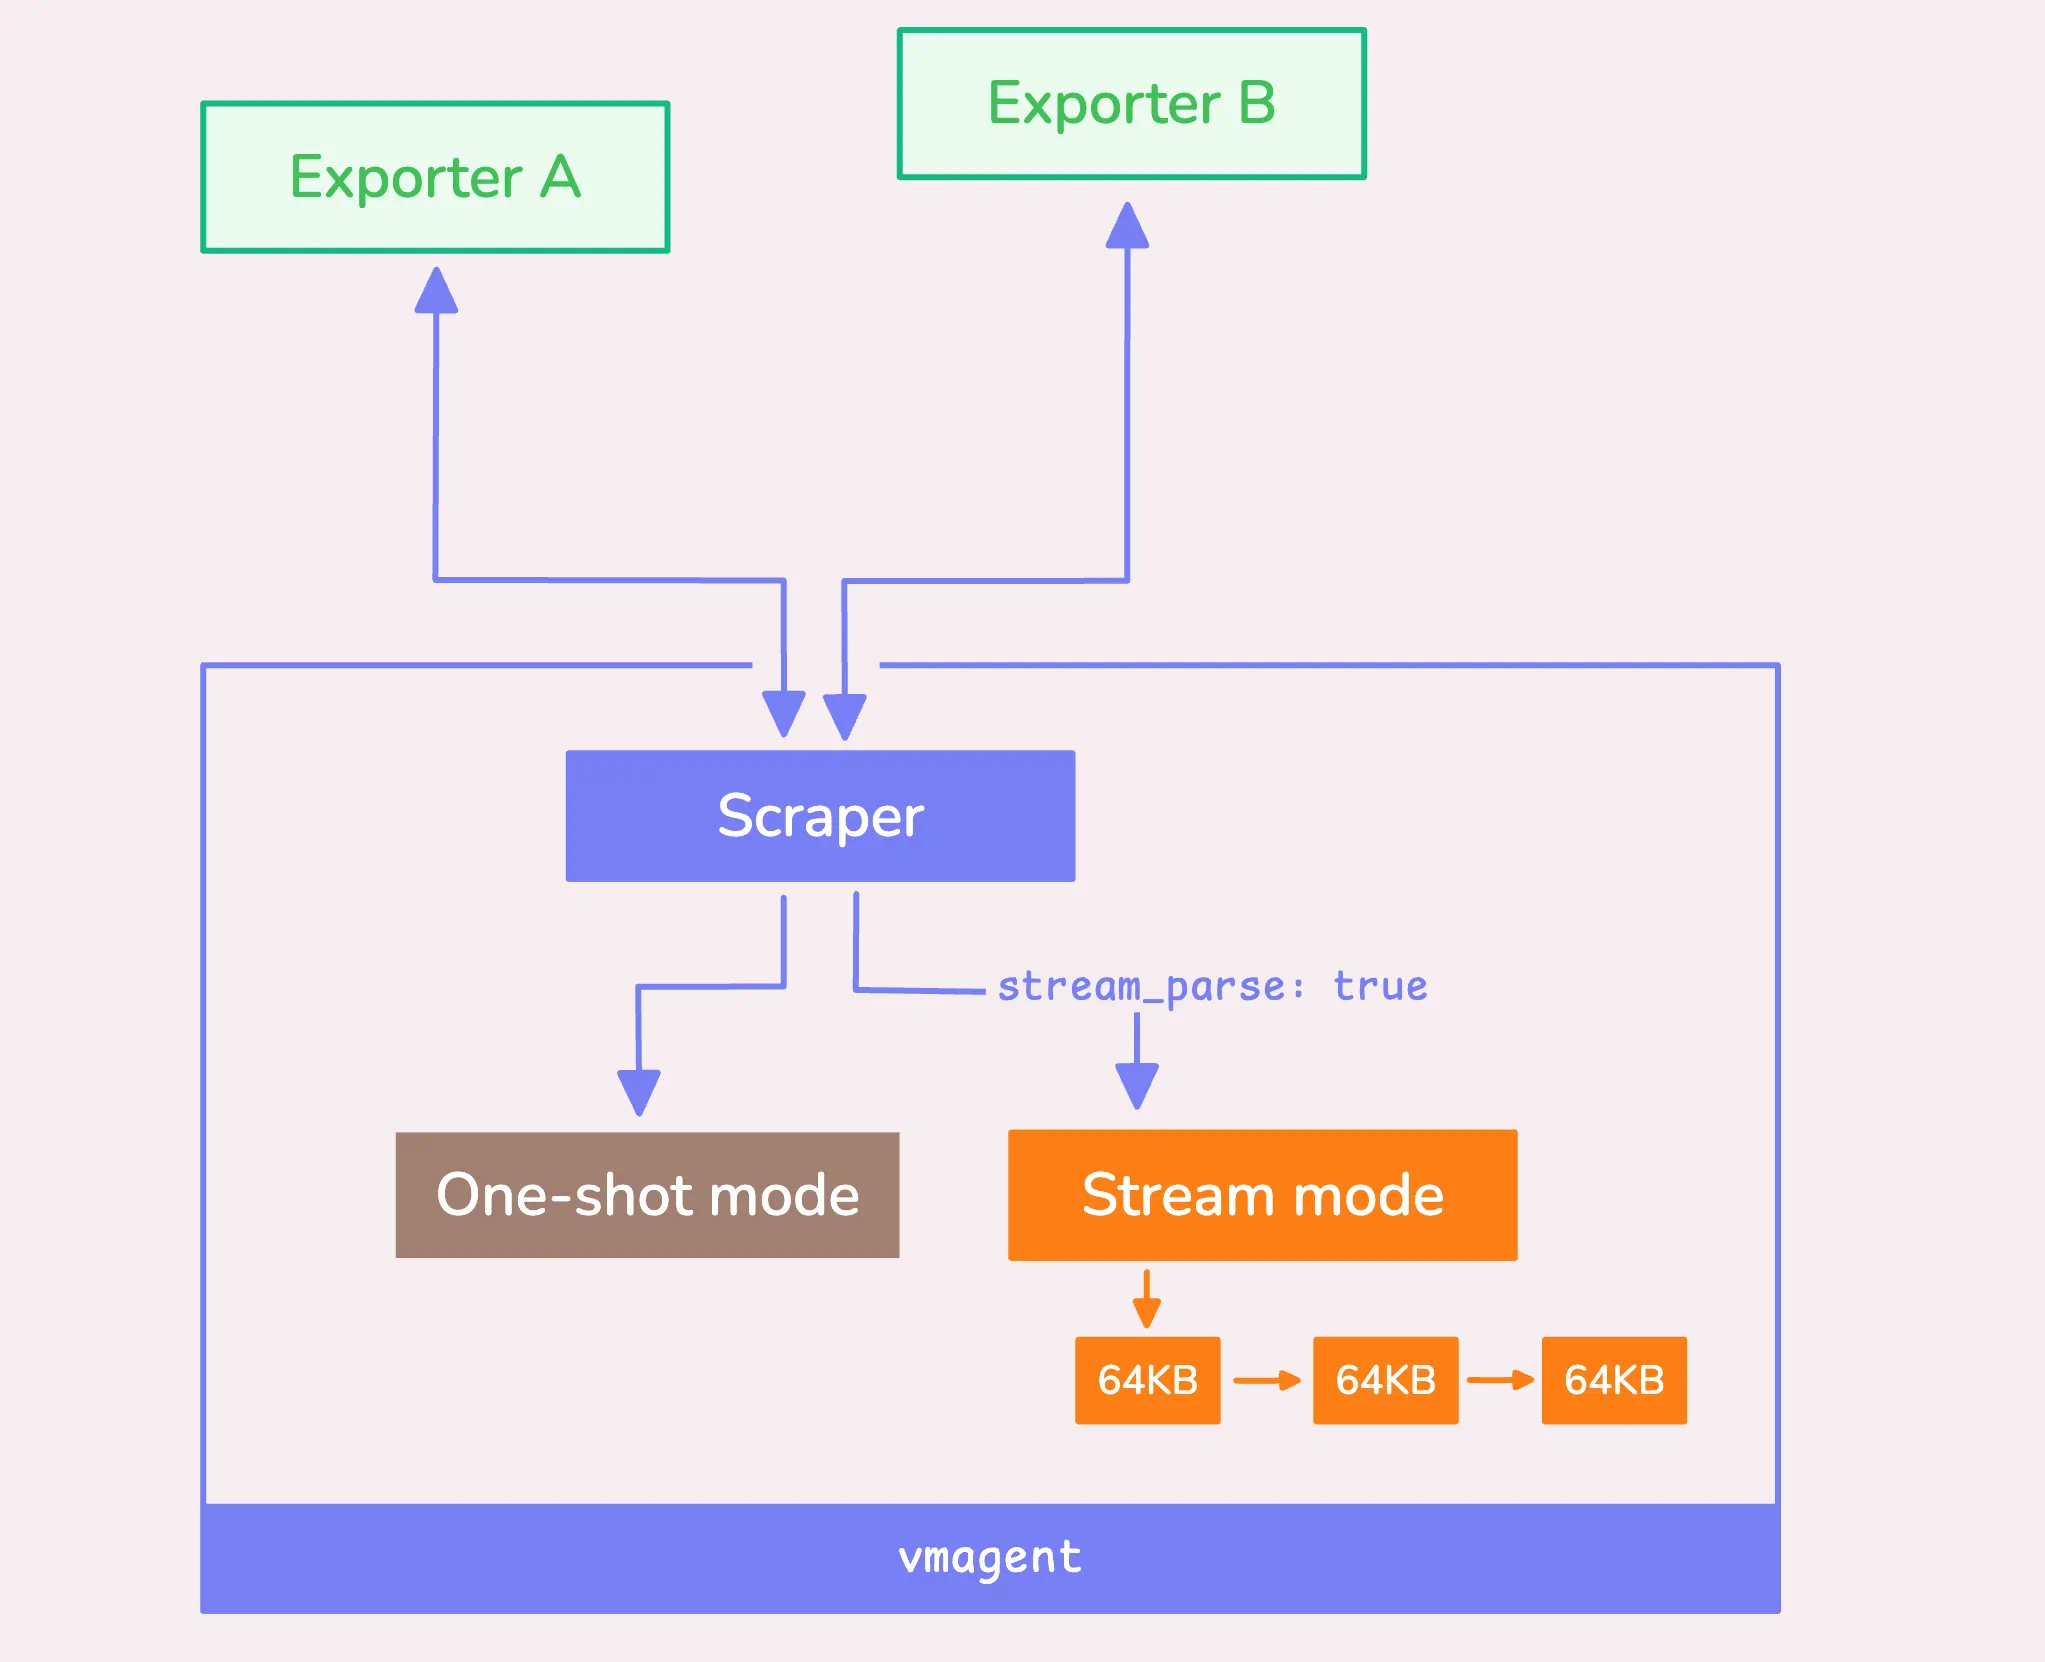
You can explicitly enable stream mode with a global flag (-promscrape.streamParse) or per scrape config using the scrape_config[].stream_parse field, like so:
scrape_configs:
- job_name: 'big-federate'
  stream_parse: true # <--
  ...
Even if you don’t manually enable stream mode, vmagent can switch to it automatically as an optimization if the response size exceeds 1 MB (-promscrape.minResponseSizeForStreamParse). However, this only happens if you haven’t set limits on the number of samples or unique time series.
Here’s where the limits come in, after processing any relabeling rules, vmagent can restrict:
- How many samples can be scraped (
scrape_configs[].sample_limit:) - How many unique timeseries a single scrape target can return (
-promscrape.seriesLimitPerTarget)
When you specify either of these limits, vmagent disables stream optimization to avoid confusion, since the way it drops data is handled differently.
Once the scraping process is ongoing, vmagent automatically generates some helpful metrics with the scrape_* prefix. However, these metrics will not appear on the /metrics page of vmagent itself.
Instead, they are pushed directly to the remote destination where the scraped data is sent.
- Total samples obtained before relabeling:
scrape_samples_scraped. - Samples remaining after relabeling:
scrape_samples_post_metric_relabeling. - New timeseries detected in the scrape:
scrape_series_added.
For more details on automatically generated labels and timeseries, you can always check out the automatically generated labels and time series.
At this point, the scraper also has this neat feature where it supports relabeling, using something called the metric_relabel_configs field.
Here’s a quick example:
scrape_configs:
- job_name: test
  static_configs:
  - targets: [host123]
  metric_relabel_configs:
  - if: '{job=~"my-app-.*",env!="dev"}'
    target_label: foo
    replacement: bar
Basically, what this rule does is apply a relabeling rule where it changes the foo label to bar for any metrics that fit this pattern {job=~"my-app-.*",env!="dev"} — so, any job name that starts with my-app- and where the env isn’t dev.
If you’re curious about more examples or different ways to use this, I’d definitely recommend checking out VictoriaMetrics’ relabeling cookbook. We’ve got some good tips in there
Step 2: Global Relabeling, Cardinality Reduction
#
Now that we’ve processed the raw data into time series, whether it came in through a push or a scrape, it all boils down to the same process from here on out.
First, vmagent makes sure the remote storages are ready to accept data.
To do this, you must have at least one remote storage configured (-remoteWrite.url), as this is mandatory for vmagent to function properly.
If a storage system is down - maybe it’s overloaded or failing, by default, we’ve got your back with the persistent queue enabled. This means the data gets sent to a local storage to avoid any data loss for that specific storage.
Now, if you’ve disabled the persistent queue for some reason, that’s a different story, the data for that storage will just get dropped.
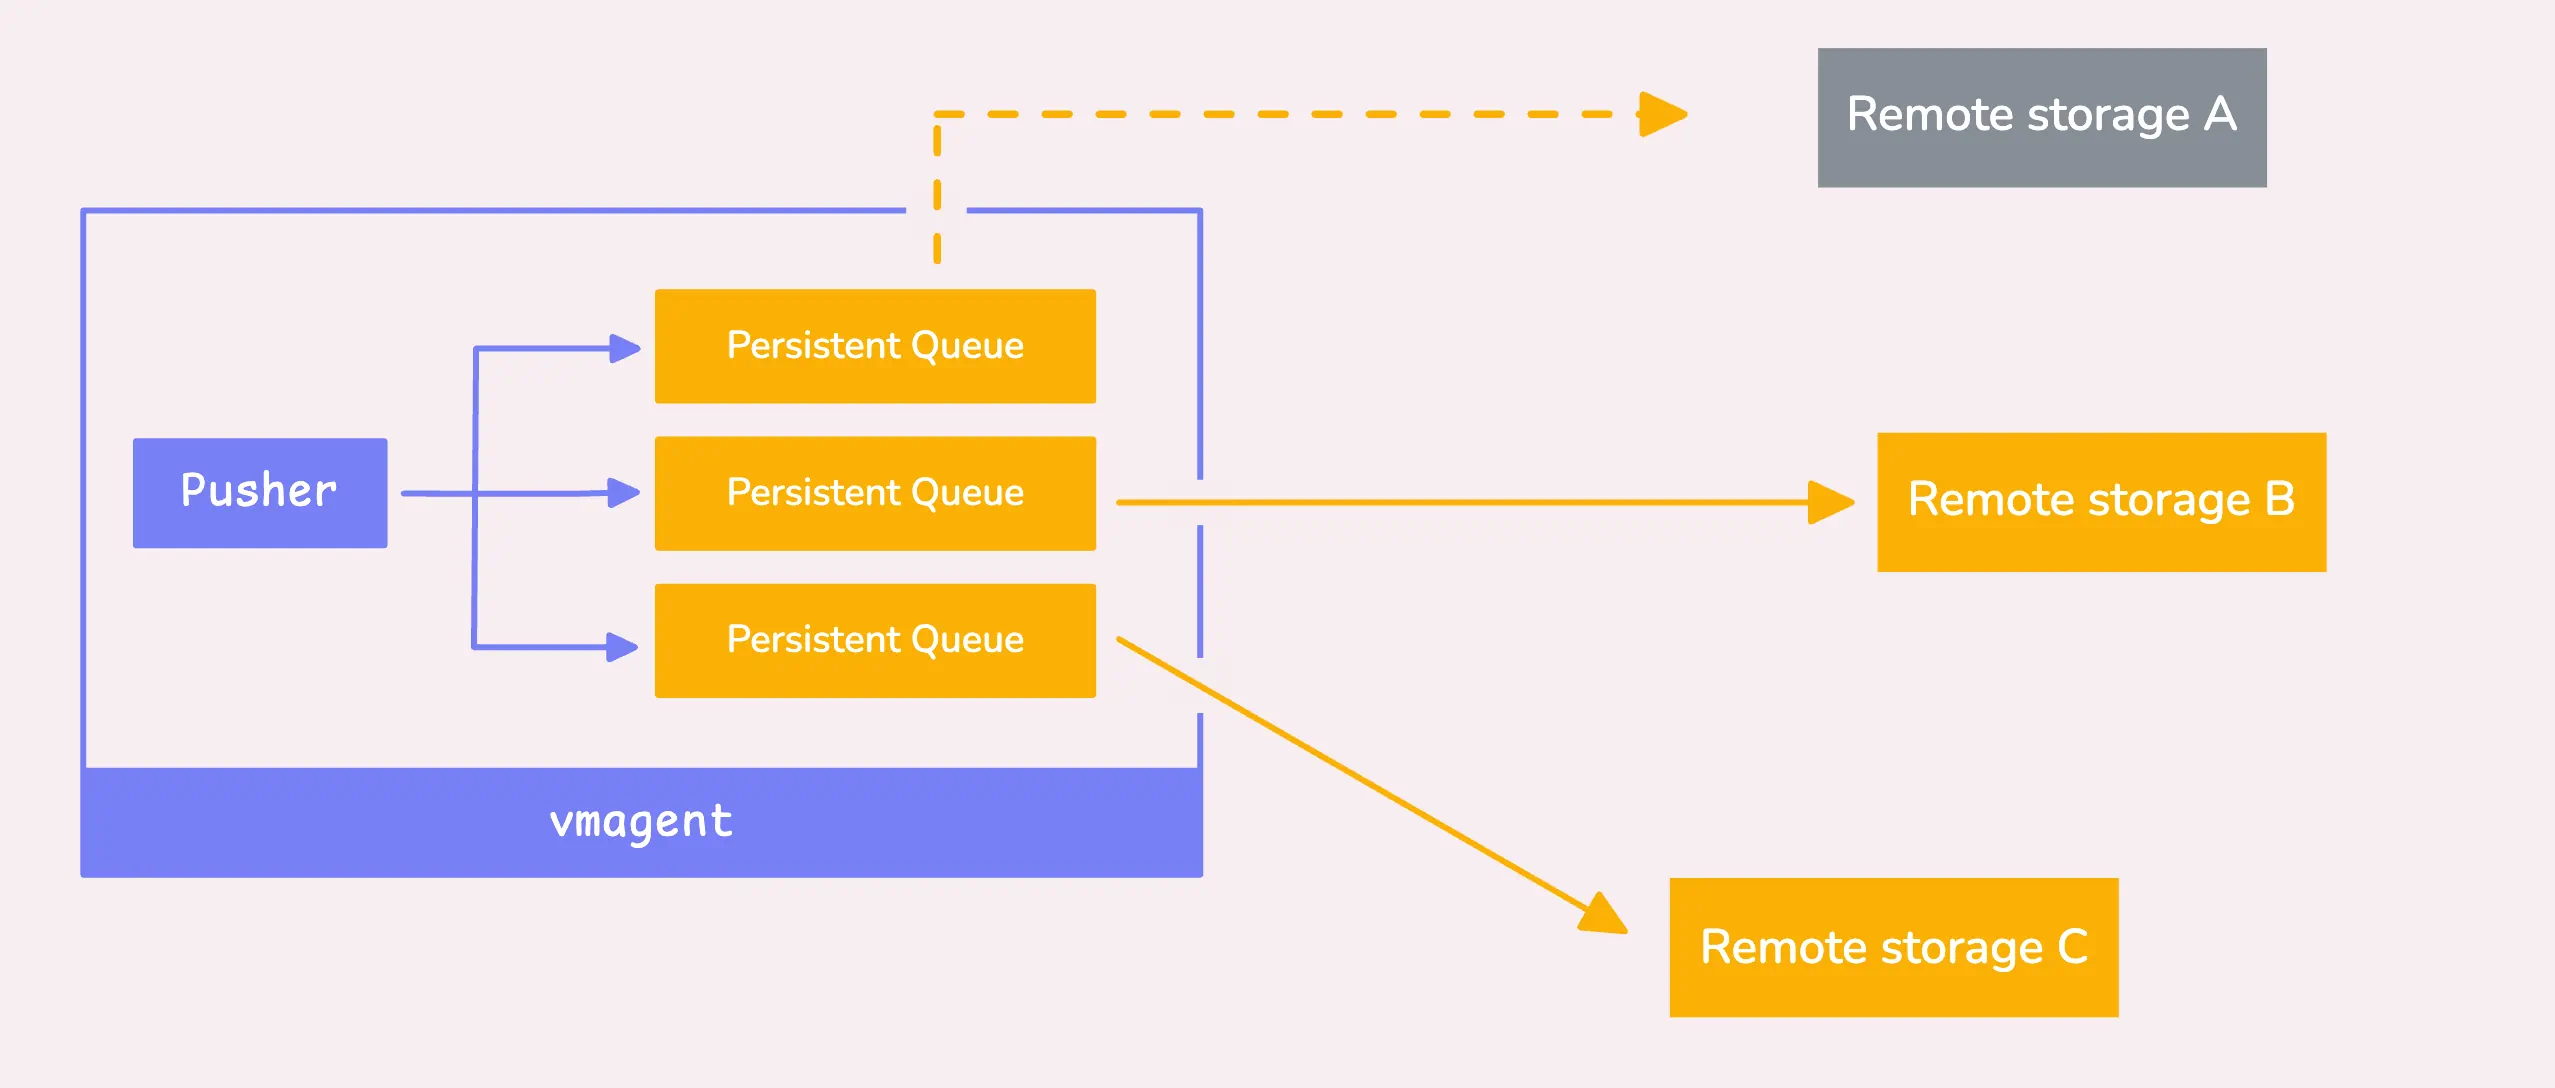
So, unless you’re sure, it’s probably a good idea to leave that queue enabled.
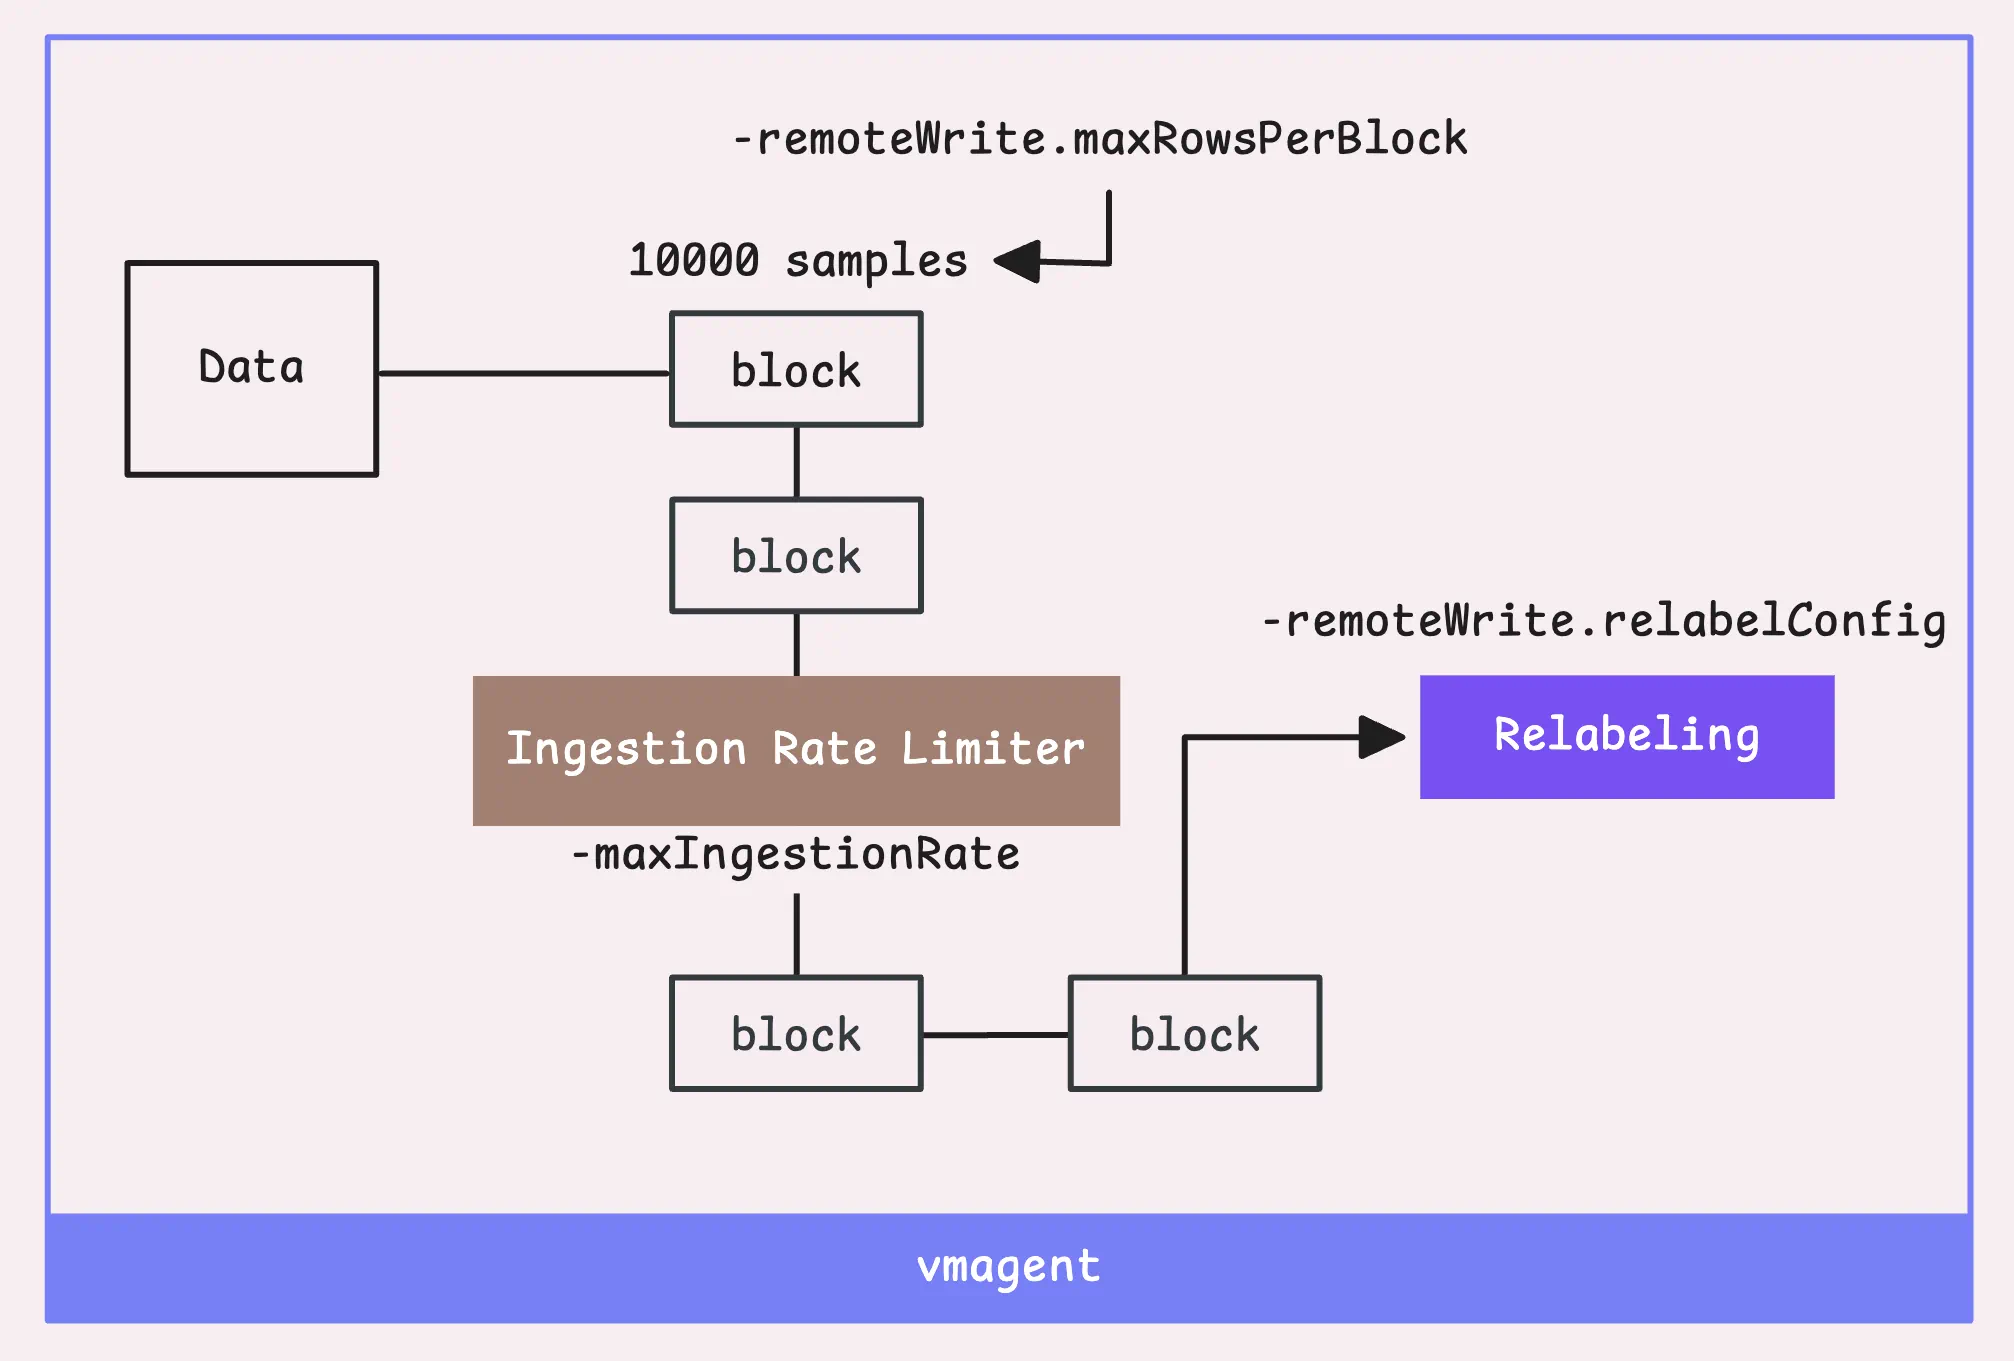
To keep things efficient in terms of memory and performance, we split the data into blocks. Each block has two limits: 10,000 samples (-remoteWrite.maxRowsPerBlock) or 100,000 labels (basically 10x the sample count).
Once a block of time series data is ready, global ingestion rate limiter kicks in. It controls how many samples per second vmagent can ingest (-maxIngestionRate).
By default, there’s no limit, but if you set one and it gets reached, the goroutine will be blocked until more data can be processed. You can keep an eye on how often this happens by checking the vmagent_max_ingestion_rate_limit_reached_total metric.
If you’re really focused on performance and want to protect your remote storage from getting overwhelmed by high cardinality, vmagent has your back with support for cardinality reduction at this stage.
“Hold on, what’s high cardinality?”
Basically, each time series is defined by a combination of a metric name and its labels (those key-value pairs).
So, temperature{country="US"} and temperature{country="UK"} would be considered two separate time series. High cardinality is when you’re tracking a large number of different time series.
This usually happens when you have labels like user_id, ip, etc., which have many possible values.
If you have a million users, and each one has a unique ID, you’ll end up with a million unique time series just because of the different user_id values
To avoid this, we control the maximum number of unique time series over a certain period with two flags: -remoteWrite.maxHourlySeries and -remoteWrite.maxDailySeries. The default is unlimited (0), but setting a limit can help better manage performance.
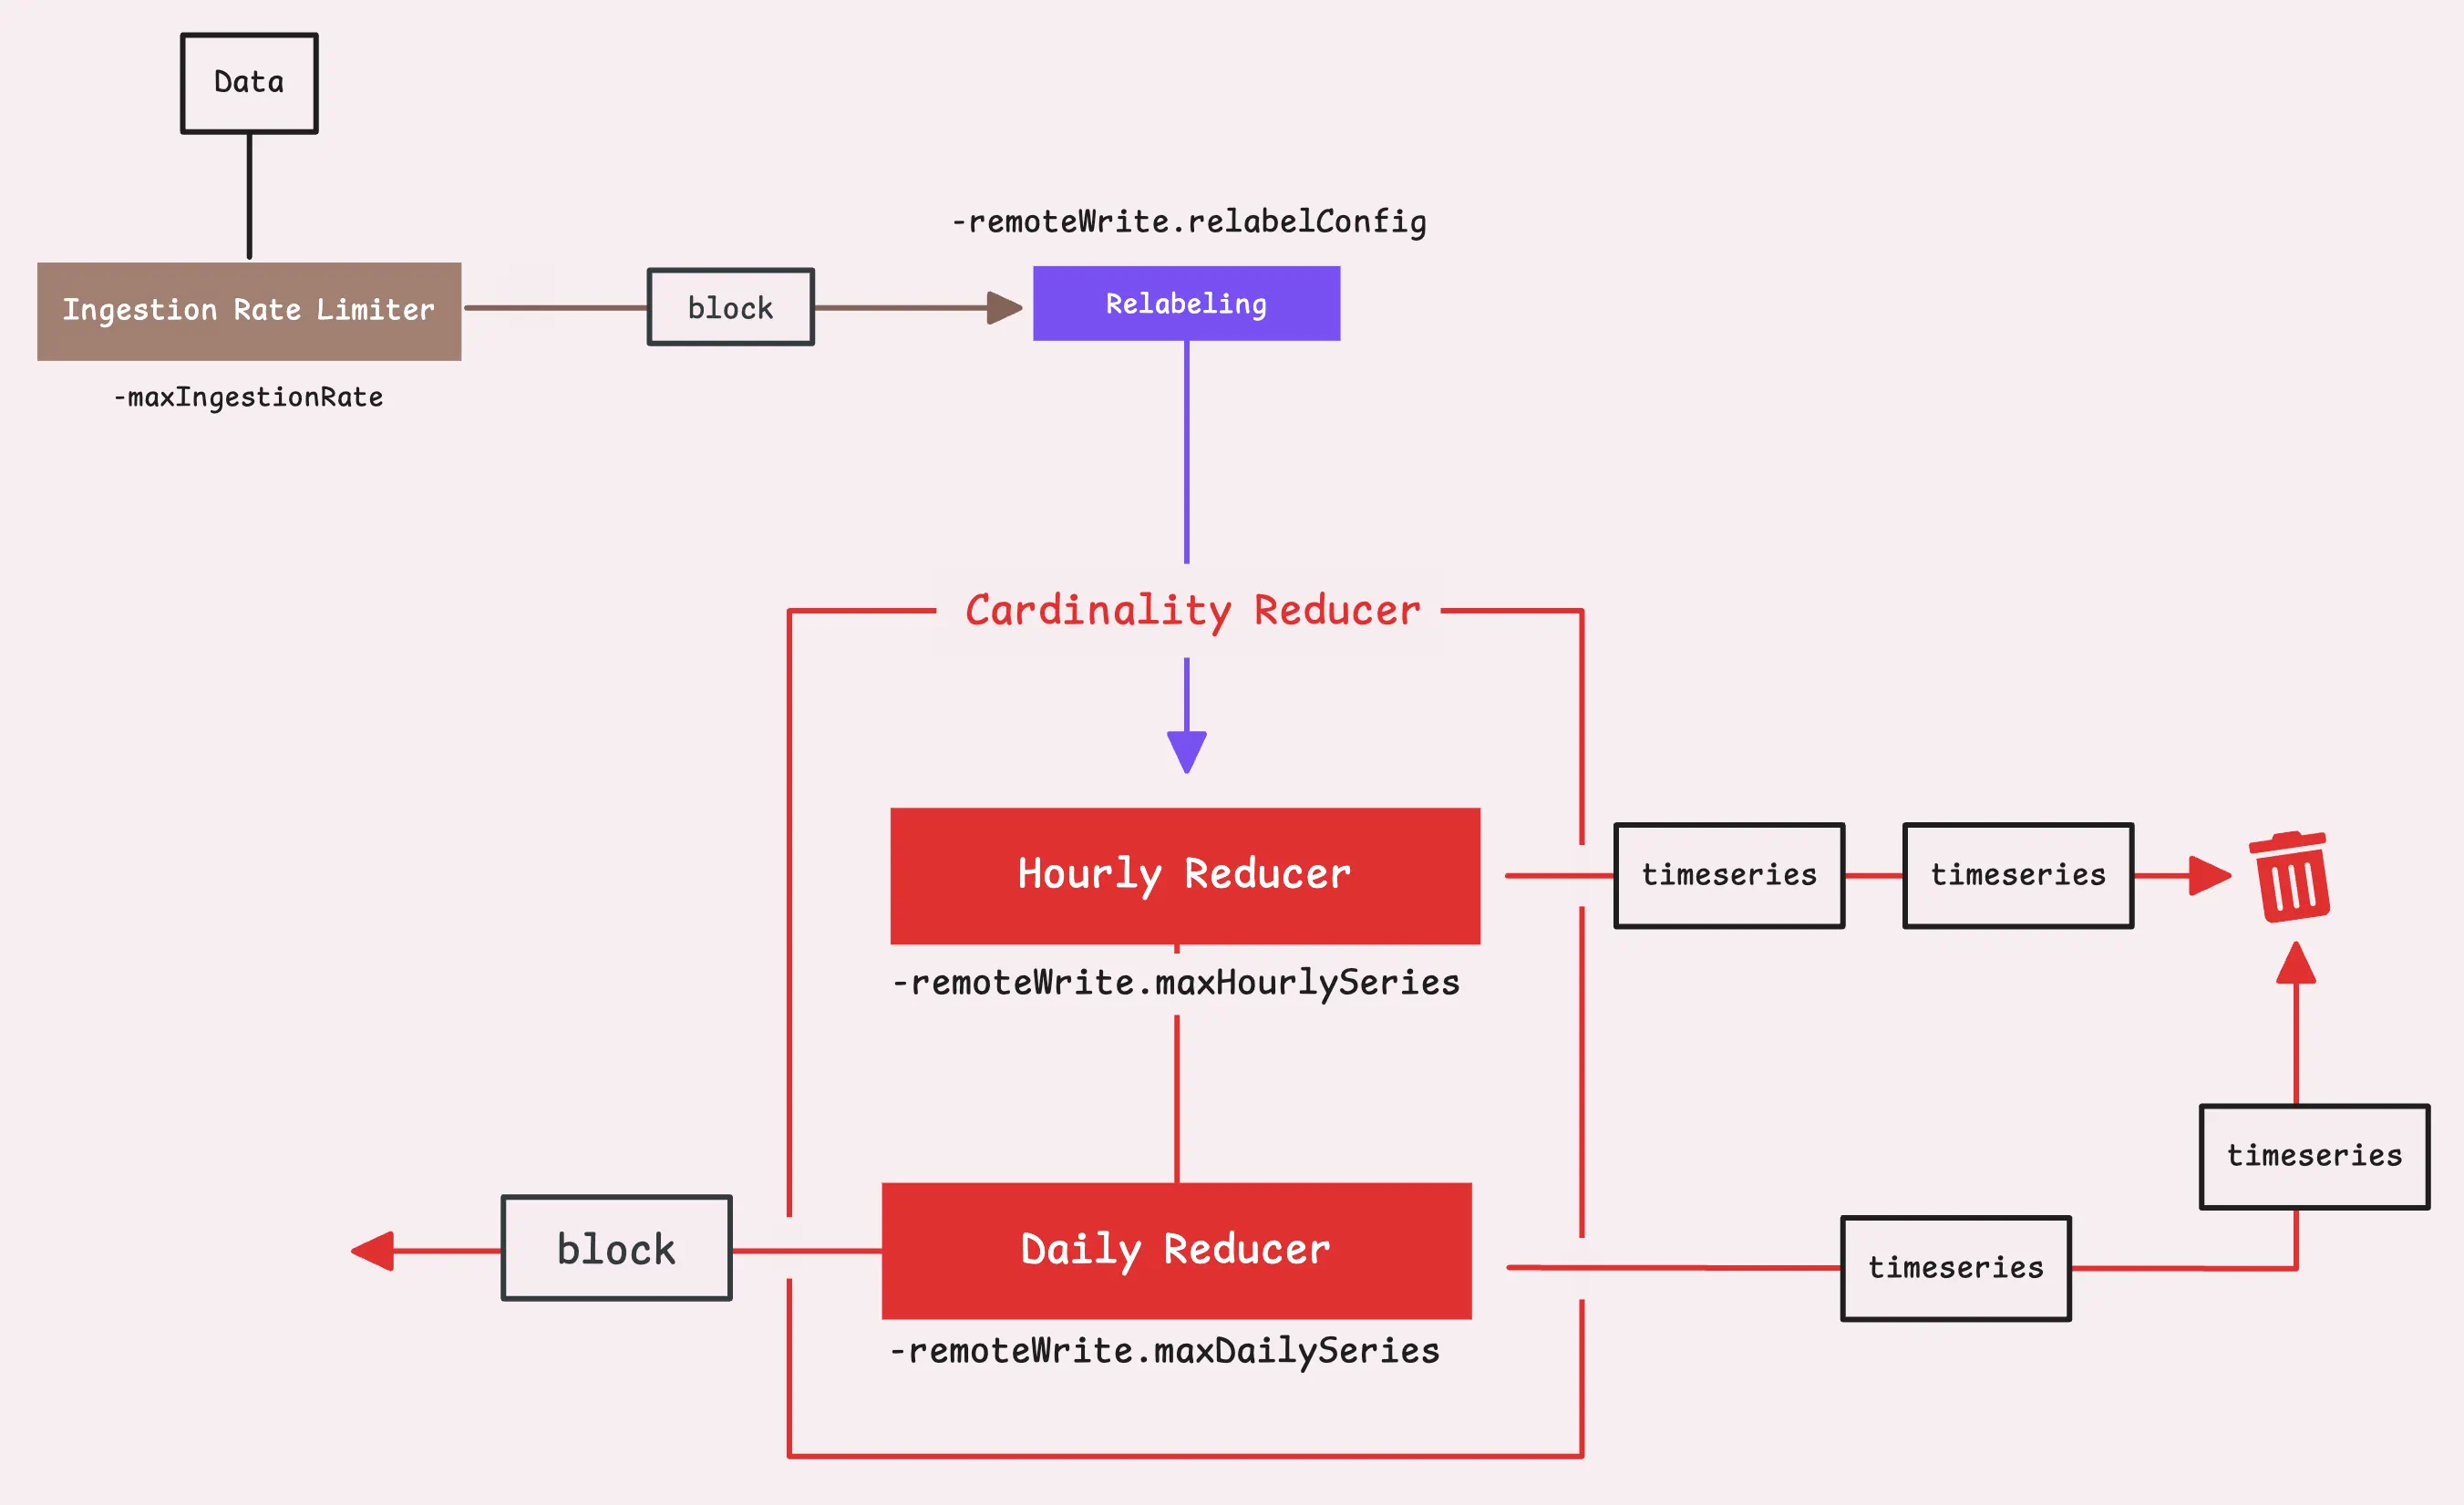
Any new time series that exceed the limit will be dropped, but the ones that have already been seen will continue to be forwarded as usual.
Now, let’s move our data to the next step.
Step 3: Global Deduplication & Stream Aggregation
#
So the vmagent can also handle deduplication, which basically gets rid of any extra, unnecessary data points in your time series.
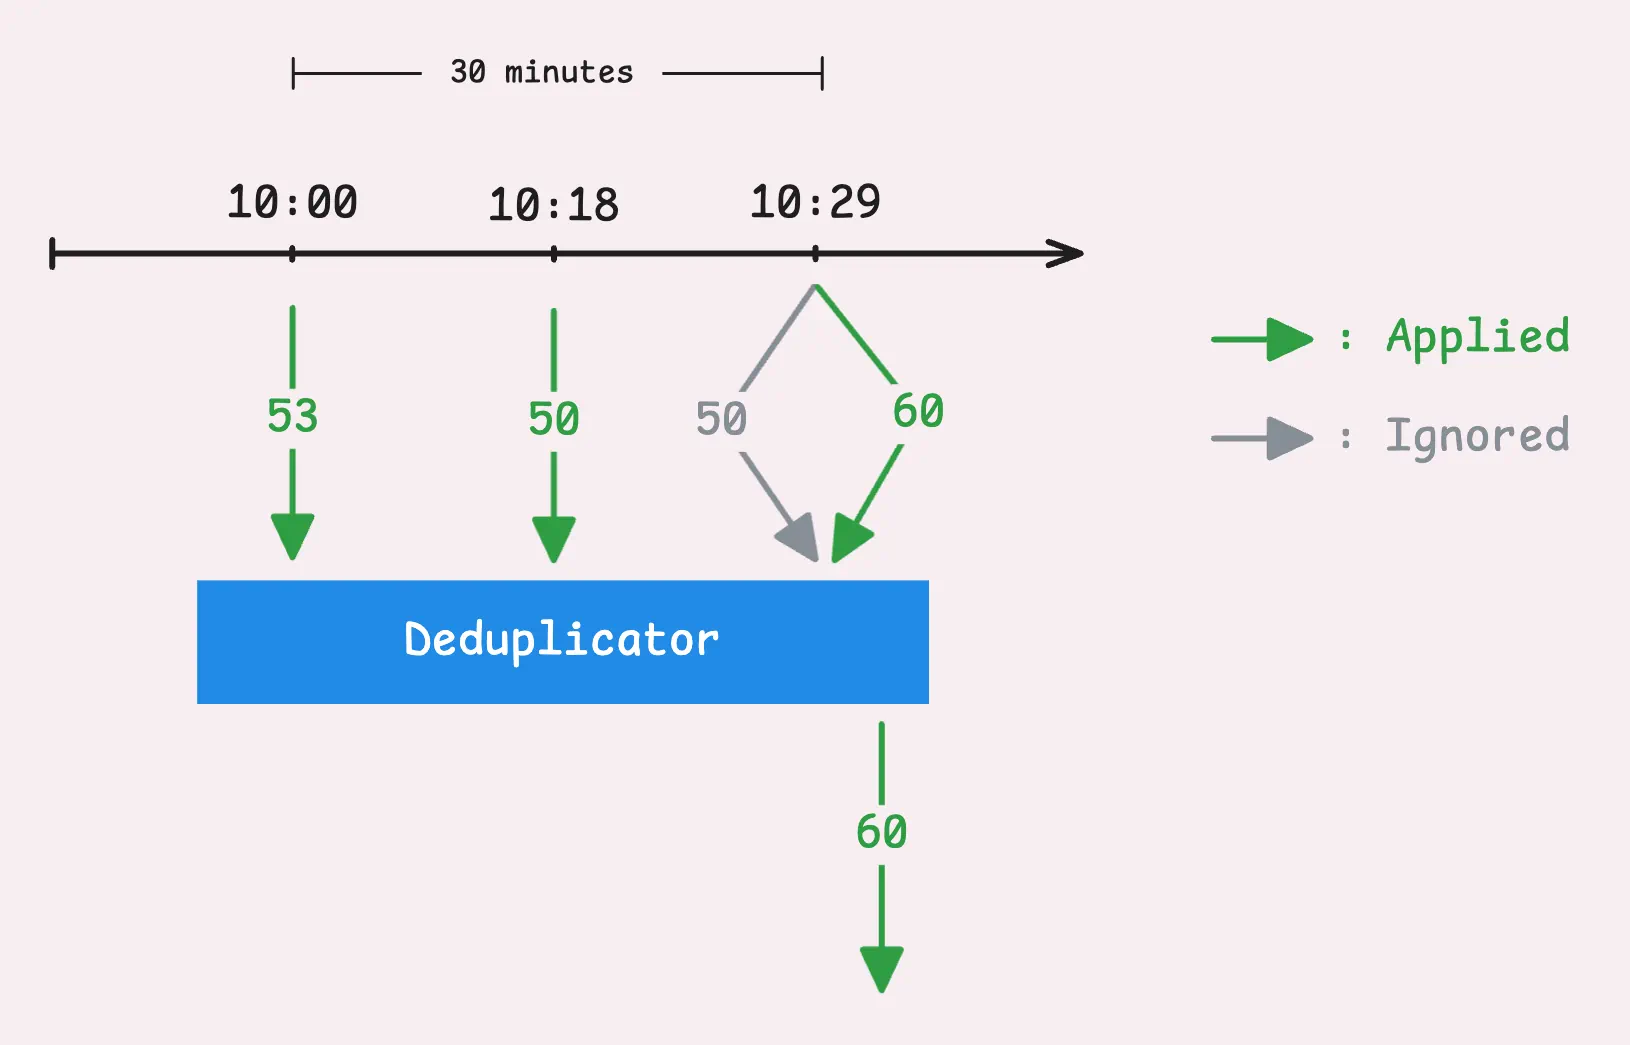
The goal here is to keep only the most important data point within a specific time frame, you can decide how long that window is by setting the -streamAggr.dedupInterval flag. For example, say you set the global deduplication interval to 30 seconds, what vmagent will do is:
- During that 30-second window, vmagent will hold on to only the most recent sample, which is the one with the highest timestamp.
- If two samples show up with the same timestamp, it’s going to keep the one with the higher value.
Next up is stream aggregation, which is really just a way to condense or summarize your incoming metrics in real time before they’re sent off to storage—whether that’s remote or local.
Let’s say you’re gathering data at a high rate, like once every second.
Storing every single data point could take up a lot of space and slow down your queries. But you probably don’t want to lose valuable metrics by using deduplication either and that’s where stream aggregation helps out. It lets you “summarize” the data over longer periods — like 5 minutes, for example:
- match: '{__name__=~".+_total"}'
  interval: 5m
  outputs: [total]
In this case, any metric ending in “_total” will be stored as one data point every 5 minutes.
So if the original metric was “some_metric_total,” the aggregated version would be something like “some_metric_total:5m_total.” You end up with fewer data points overall, but you’re not losing any important information.
Once stream aggregation is turned on, vmagent sends the data to an aggregator, which has its own in-memory cache. This cache eventually gets flushed to remote storage in the background. It’s not part of the main flow, but it’ll send batches whenever needed.
By default, the aggregator will steal and drop only the input time series that matched the stream aggregation rules — basically, those that contributed to the aggregated result from the normal flow.
You can adjust how this works with two flags, though the distinction between them can be a bit subtle:
-streamAggr.keepInput(default: false): Whether to keep both the matched and unmatched input time series. If set to true, both are kept. If false, the flag below determines what happens.-streamAggr.dropInput(default: false): Whether to drop all input time series or just the matched ones. If set to true, all inputs are dropped. If false, only the matched input time series are dropped.
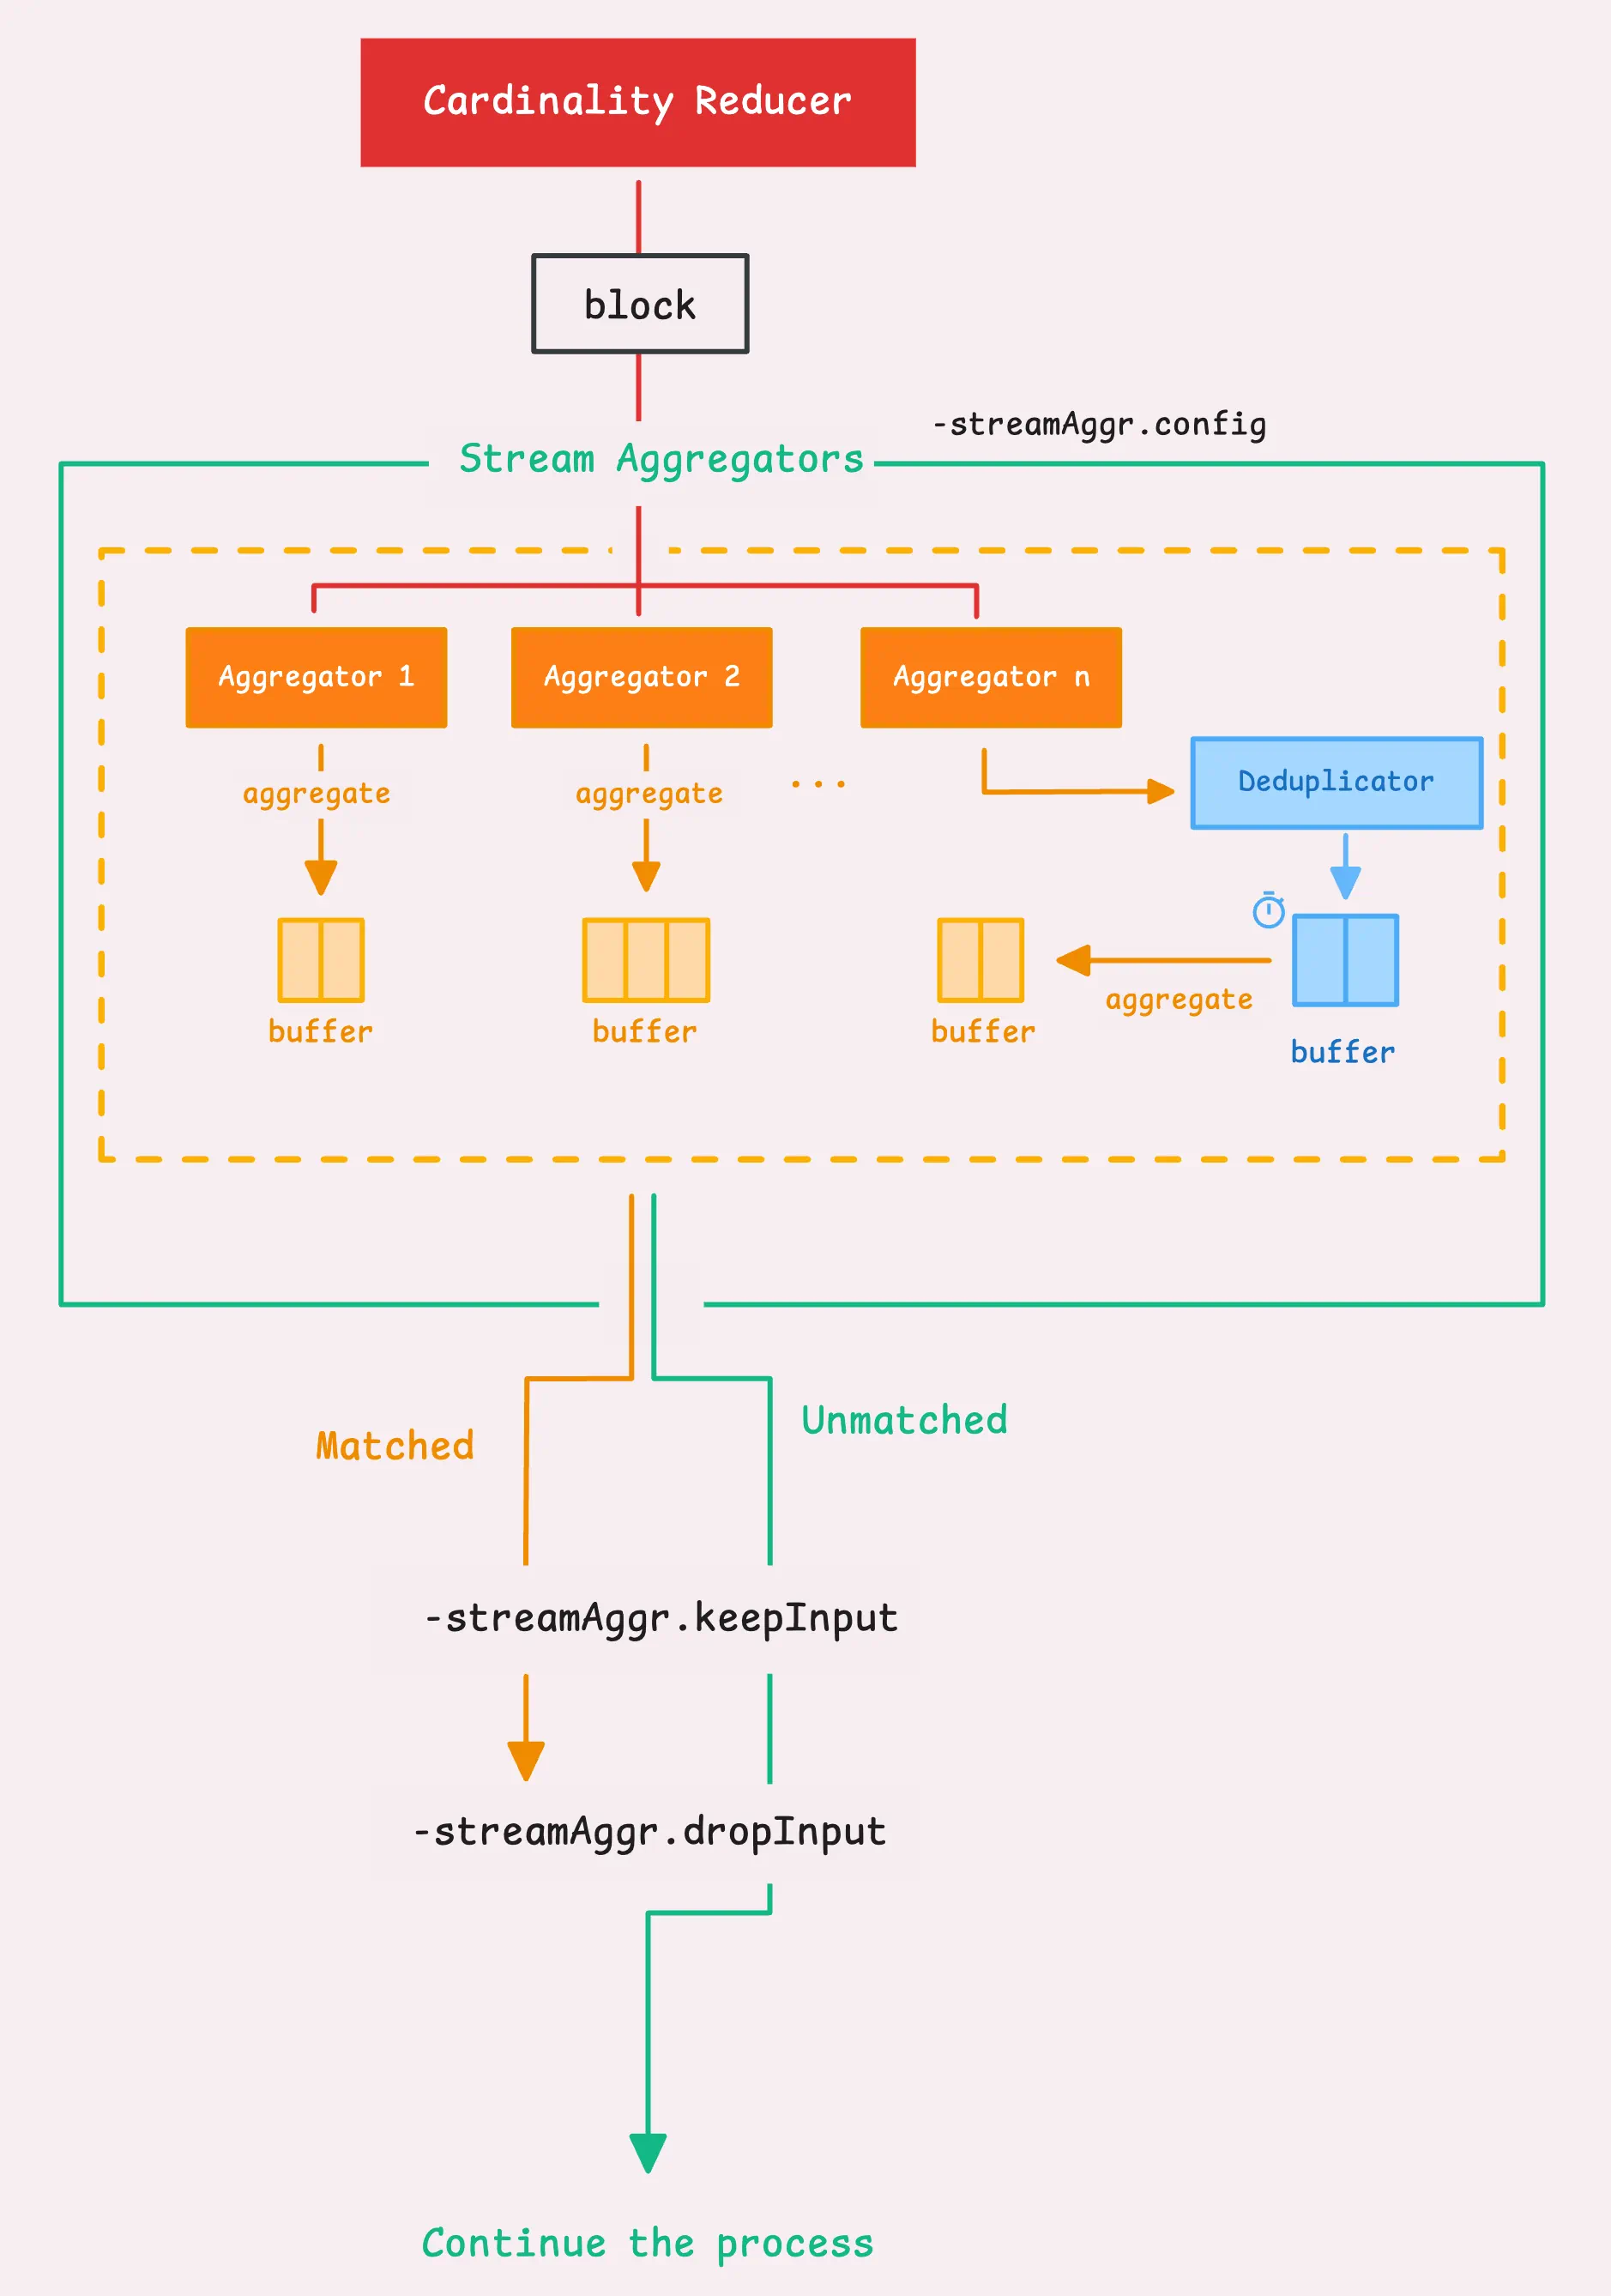
Here’s something to keep in mind: global deduplication also applies to stream aggregation. Since deduplication happens first, the data is filtered during the deduplication interval, and then the remaining data gets flushed to the aggregator.
After that, the aggregator flushes the data to remote storage, working behind the scenes as usual.
“What happens if the deduplication interval is longer than the stream aggregation interval?”
Great question! To use both deduplication and stream aggregation properly, there are a couple of conditions you need to follow:
- The stream aggregation interval has to be longer than the deduplication interval.
- It should also be a multiple of the deduplication interval.
And if you want to get more specific, you can set up deduplication on a per-stream basis, which means each stream aggregation rule can have its own deduplication settings:
- match: '{__name__=~".+_total"}'
  interval: 1m
  outputs: [total]
  dedup_interval: 30s
In this case, the data gets aggregated every minute, but during each 30-second deduplication window, it keeps only the freshest (or highest value) sample.
So, you’re still cutting down the noise but keeping the key data that matters.
Step 4: Sharding & Replication
#
At this point, we’re still working with each block of time series data (10,000 samples or 100,000 labels). Any time series that didn’t match stream aggregation or weren’t held by the deduplicator will now move into this next phase.
We’ve got two main strategies to talk about: replication and sharding (you can even mix them if that suits your setup).
- Replication: If you’ve set up more than one remote storage (
-remoteWrite.url), vmagent will send (or replicate) all the time series data to each storage system. - Sharding: If you set the sharding flag (
-remoteWrite.shardByURL), it won’t send the same data to every storage system. Instead, it splits the data between them, distributing the load evenly.
Replication is pretty simple, so let’s focus on sharding and how the two can work together.
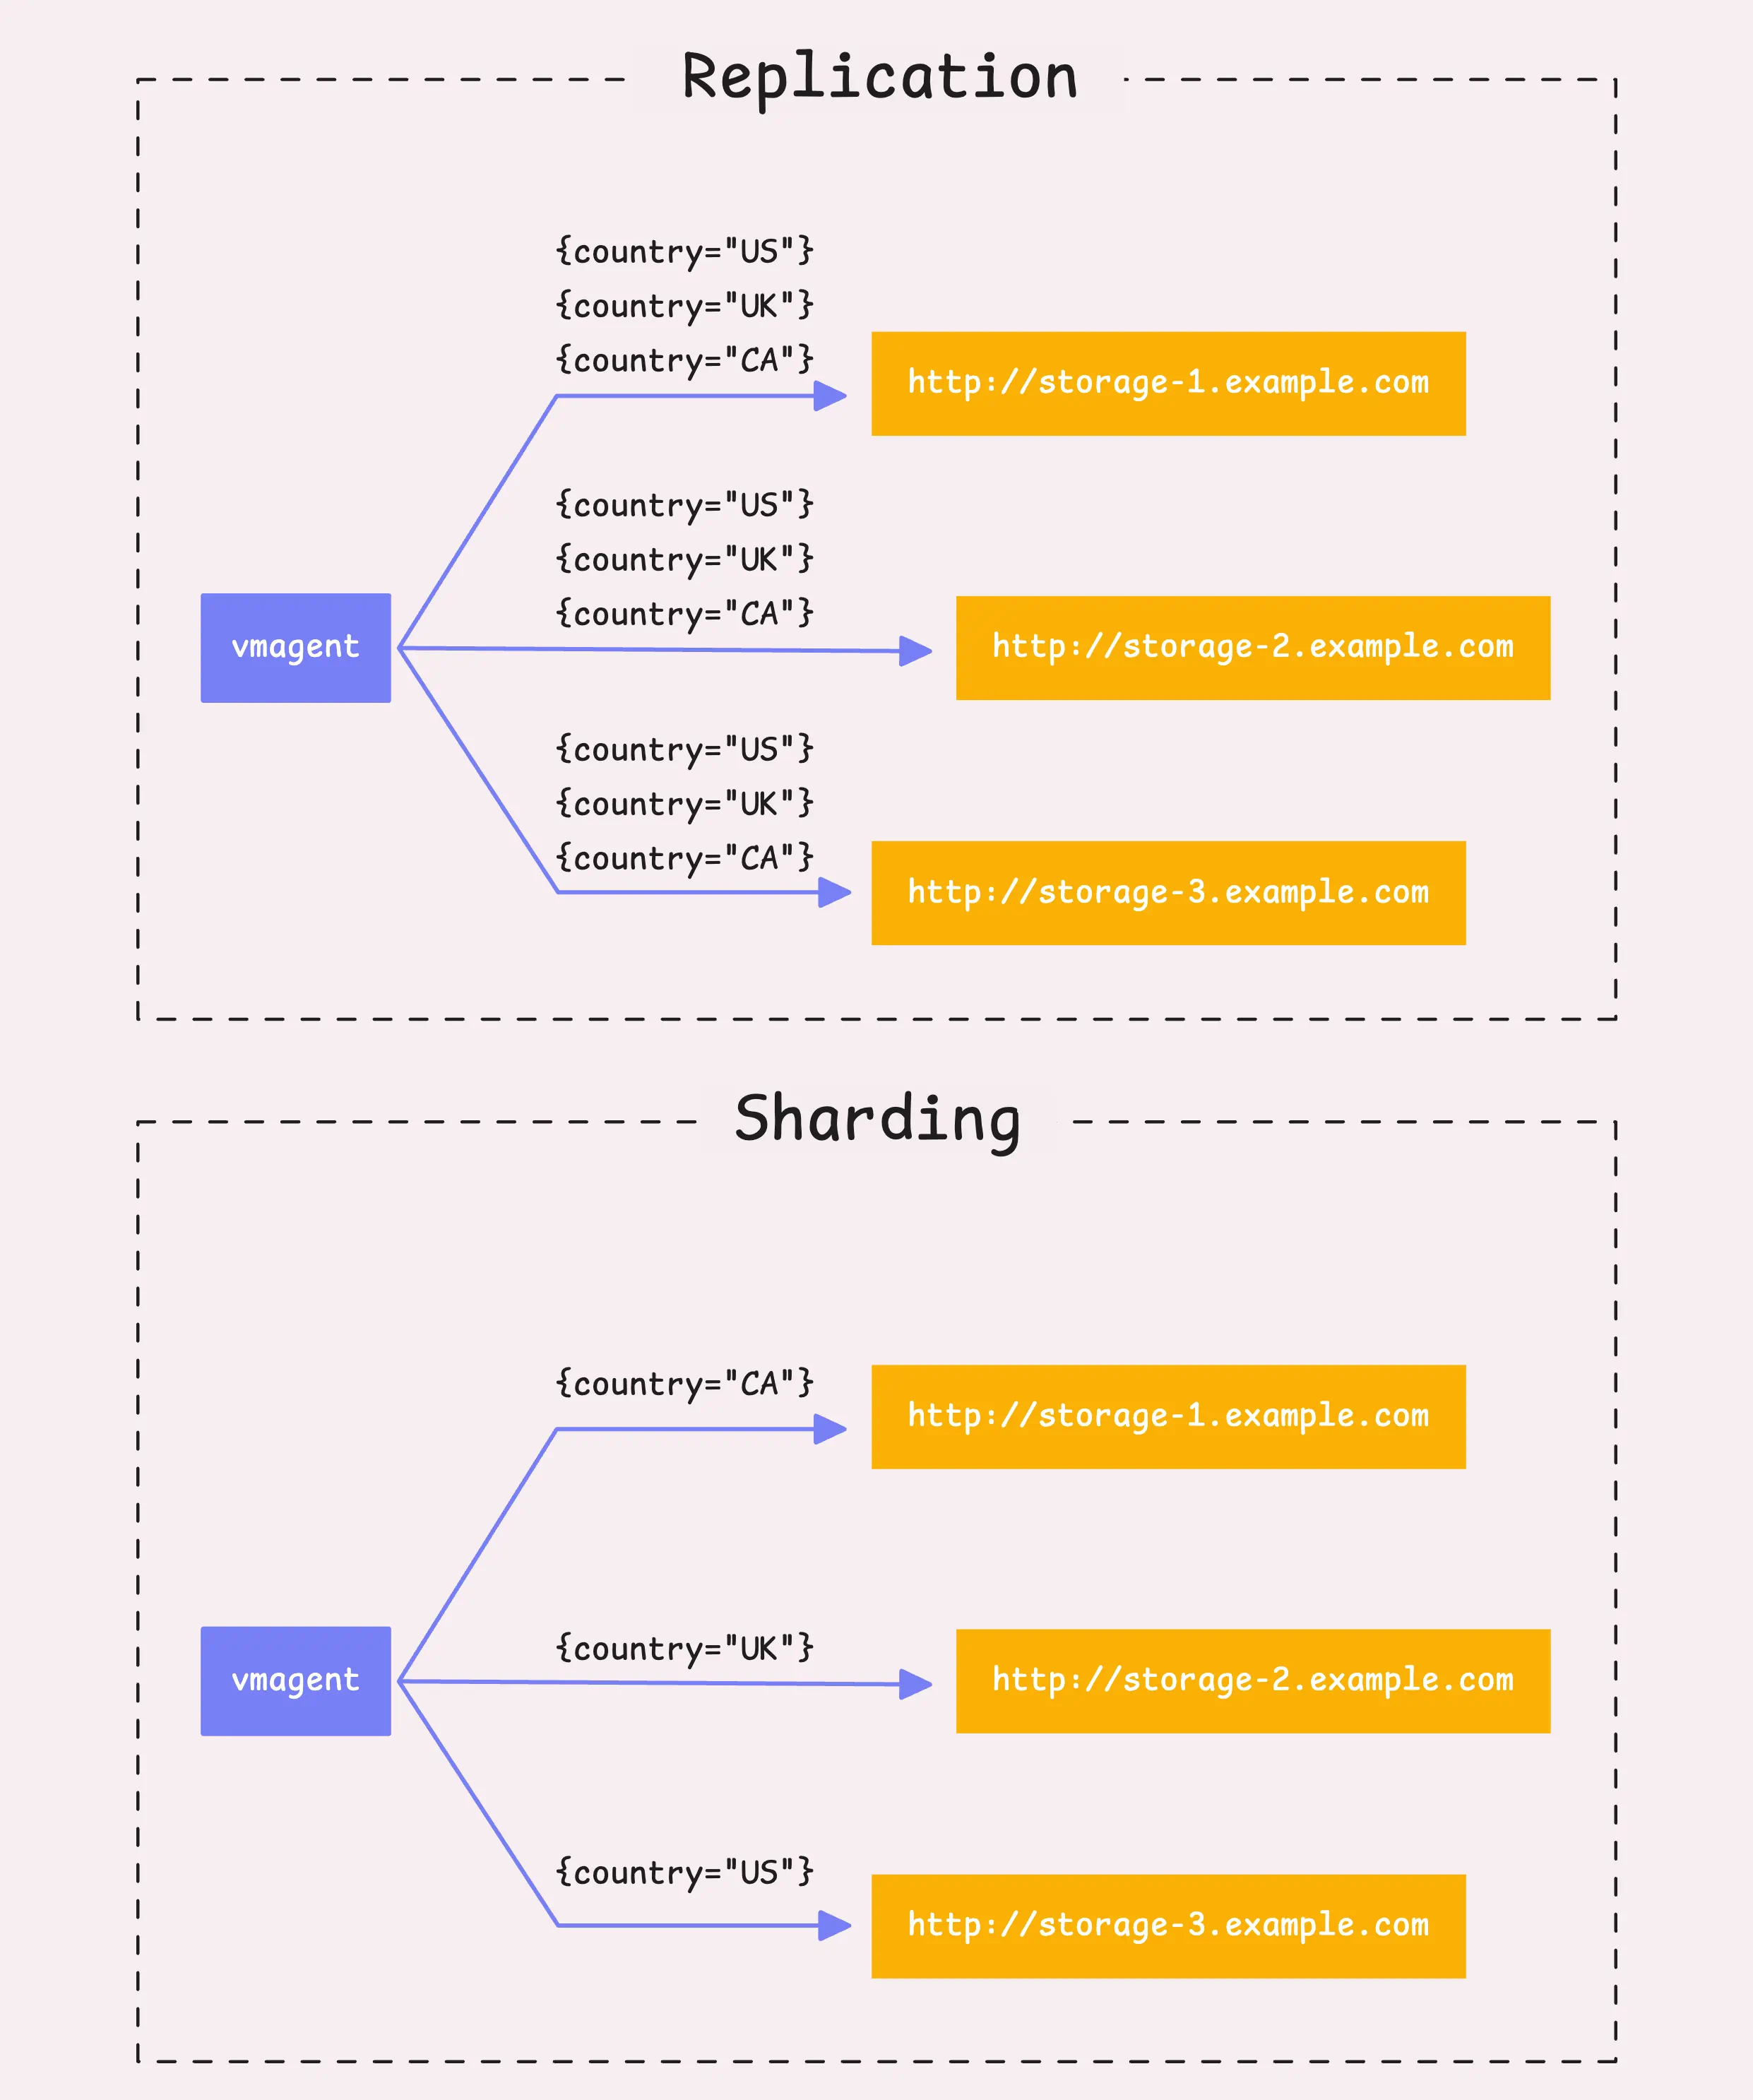
For sharding, vmagent takes the labels from each time series, combines them, and runs them through a hash function (xxHash, which is fast and non-cryptographic). The resulting 64-bit hash determines which shard the time series belongs to.
Each shard then gets sent to a different remote storage system.
You can actually control which labels are used for sharding by specifying which ones to include (-remoteWrite.shardByURL.labels) and which ones to ignore (-remoteWrite.shardByURL.ignoreLabels).
To boost data availability, you can also enable shard replication (-remoteWrite.shardByURLReplicas). This means that if one storage system goes down or can’t receive the data (maybe due to a network issue or hardware failure), the data still exists in another shard, so nothing gets lost.
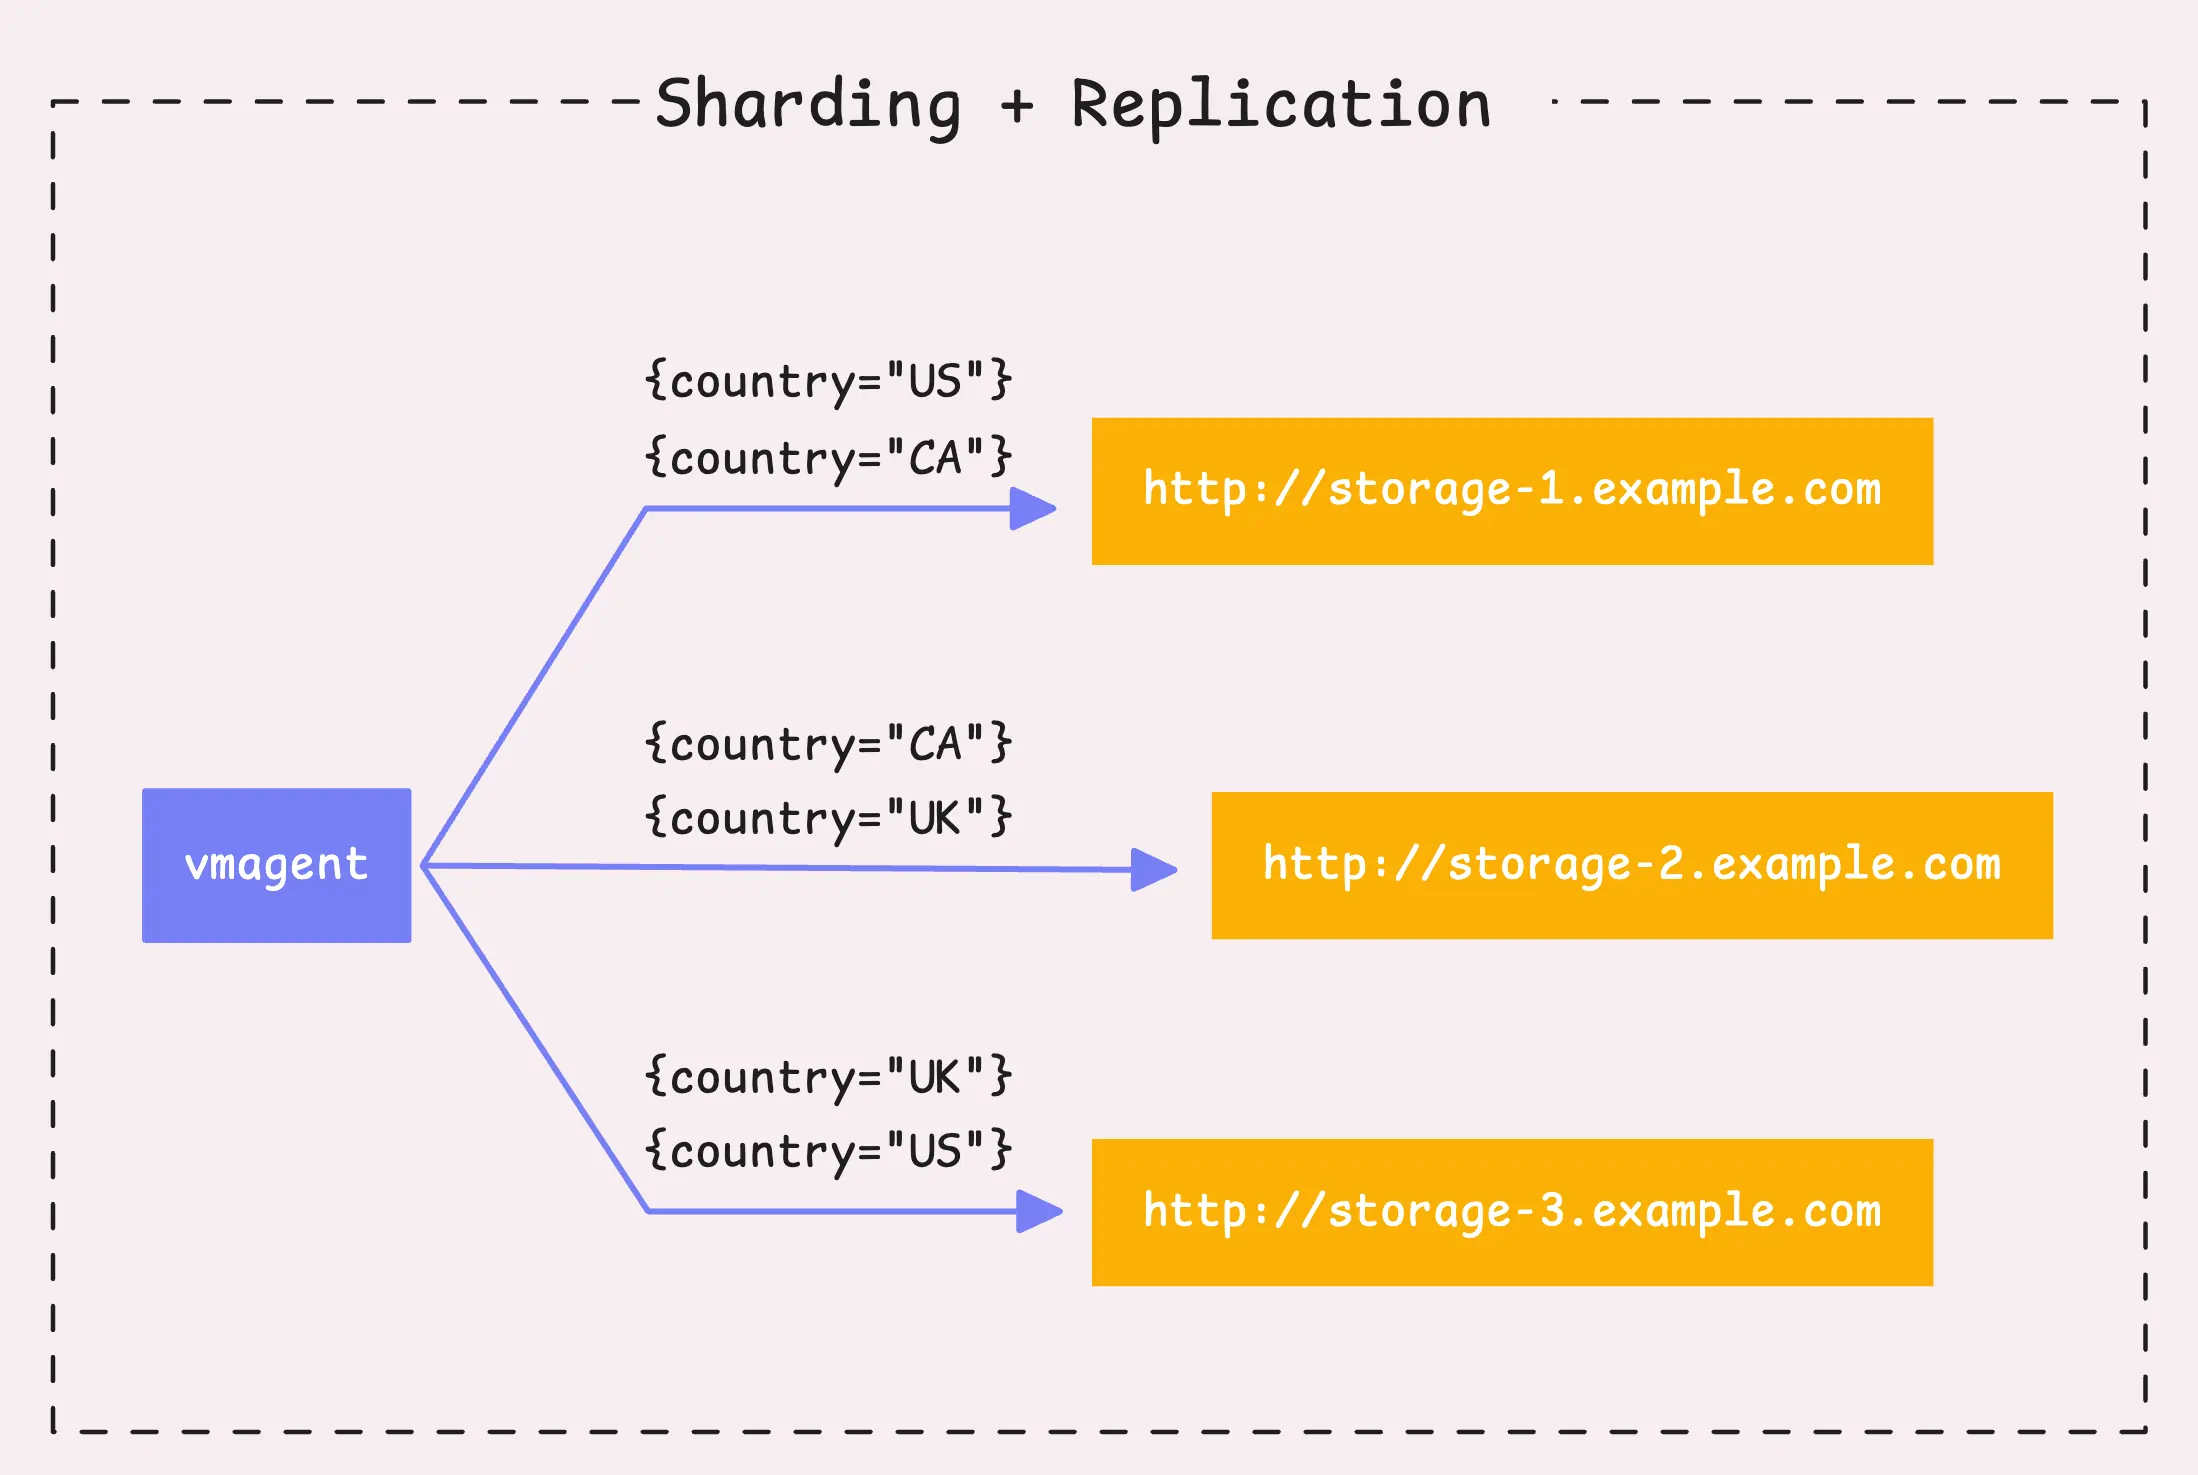
By default, sharding only creates one replica (so no replication), but you can adjust that depending on how much redundancy you want.
Step 5: Per Remote Storage Fine-tuning, Rounding Sample Values
#
So, at this point, each time series has its destination, whether it’s sharded or replicated, but we’re not quite ready to send the data to the remote storage yet.
Each push to a remote storage has its own manager, known as the “remote write context” (remoteWriteCtx). This context handles all the things we talked about earlier, but now it’s specific to each remote storage. It personalizes (or maybe “storagelizes”?) how things like stream aggregation and deduplication are applied.
Let’s run through this quickly:
- First, we apply relabeling again, but this time it’s for each remote storage URL (
-remoteWrite.urlRelabelConfig). - Second, deduplication is applied (
-remoteWrite.streamAggr.dedupInterval). - Then, we apply stream aggregation (
-remoteWrite.streamAggr.config). Just a heads-up, we don’t recommend mixing global stream aggregation with per-remote-storage stream aggregation unless you really know what you’re doing.
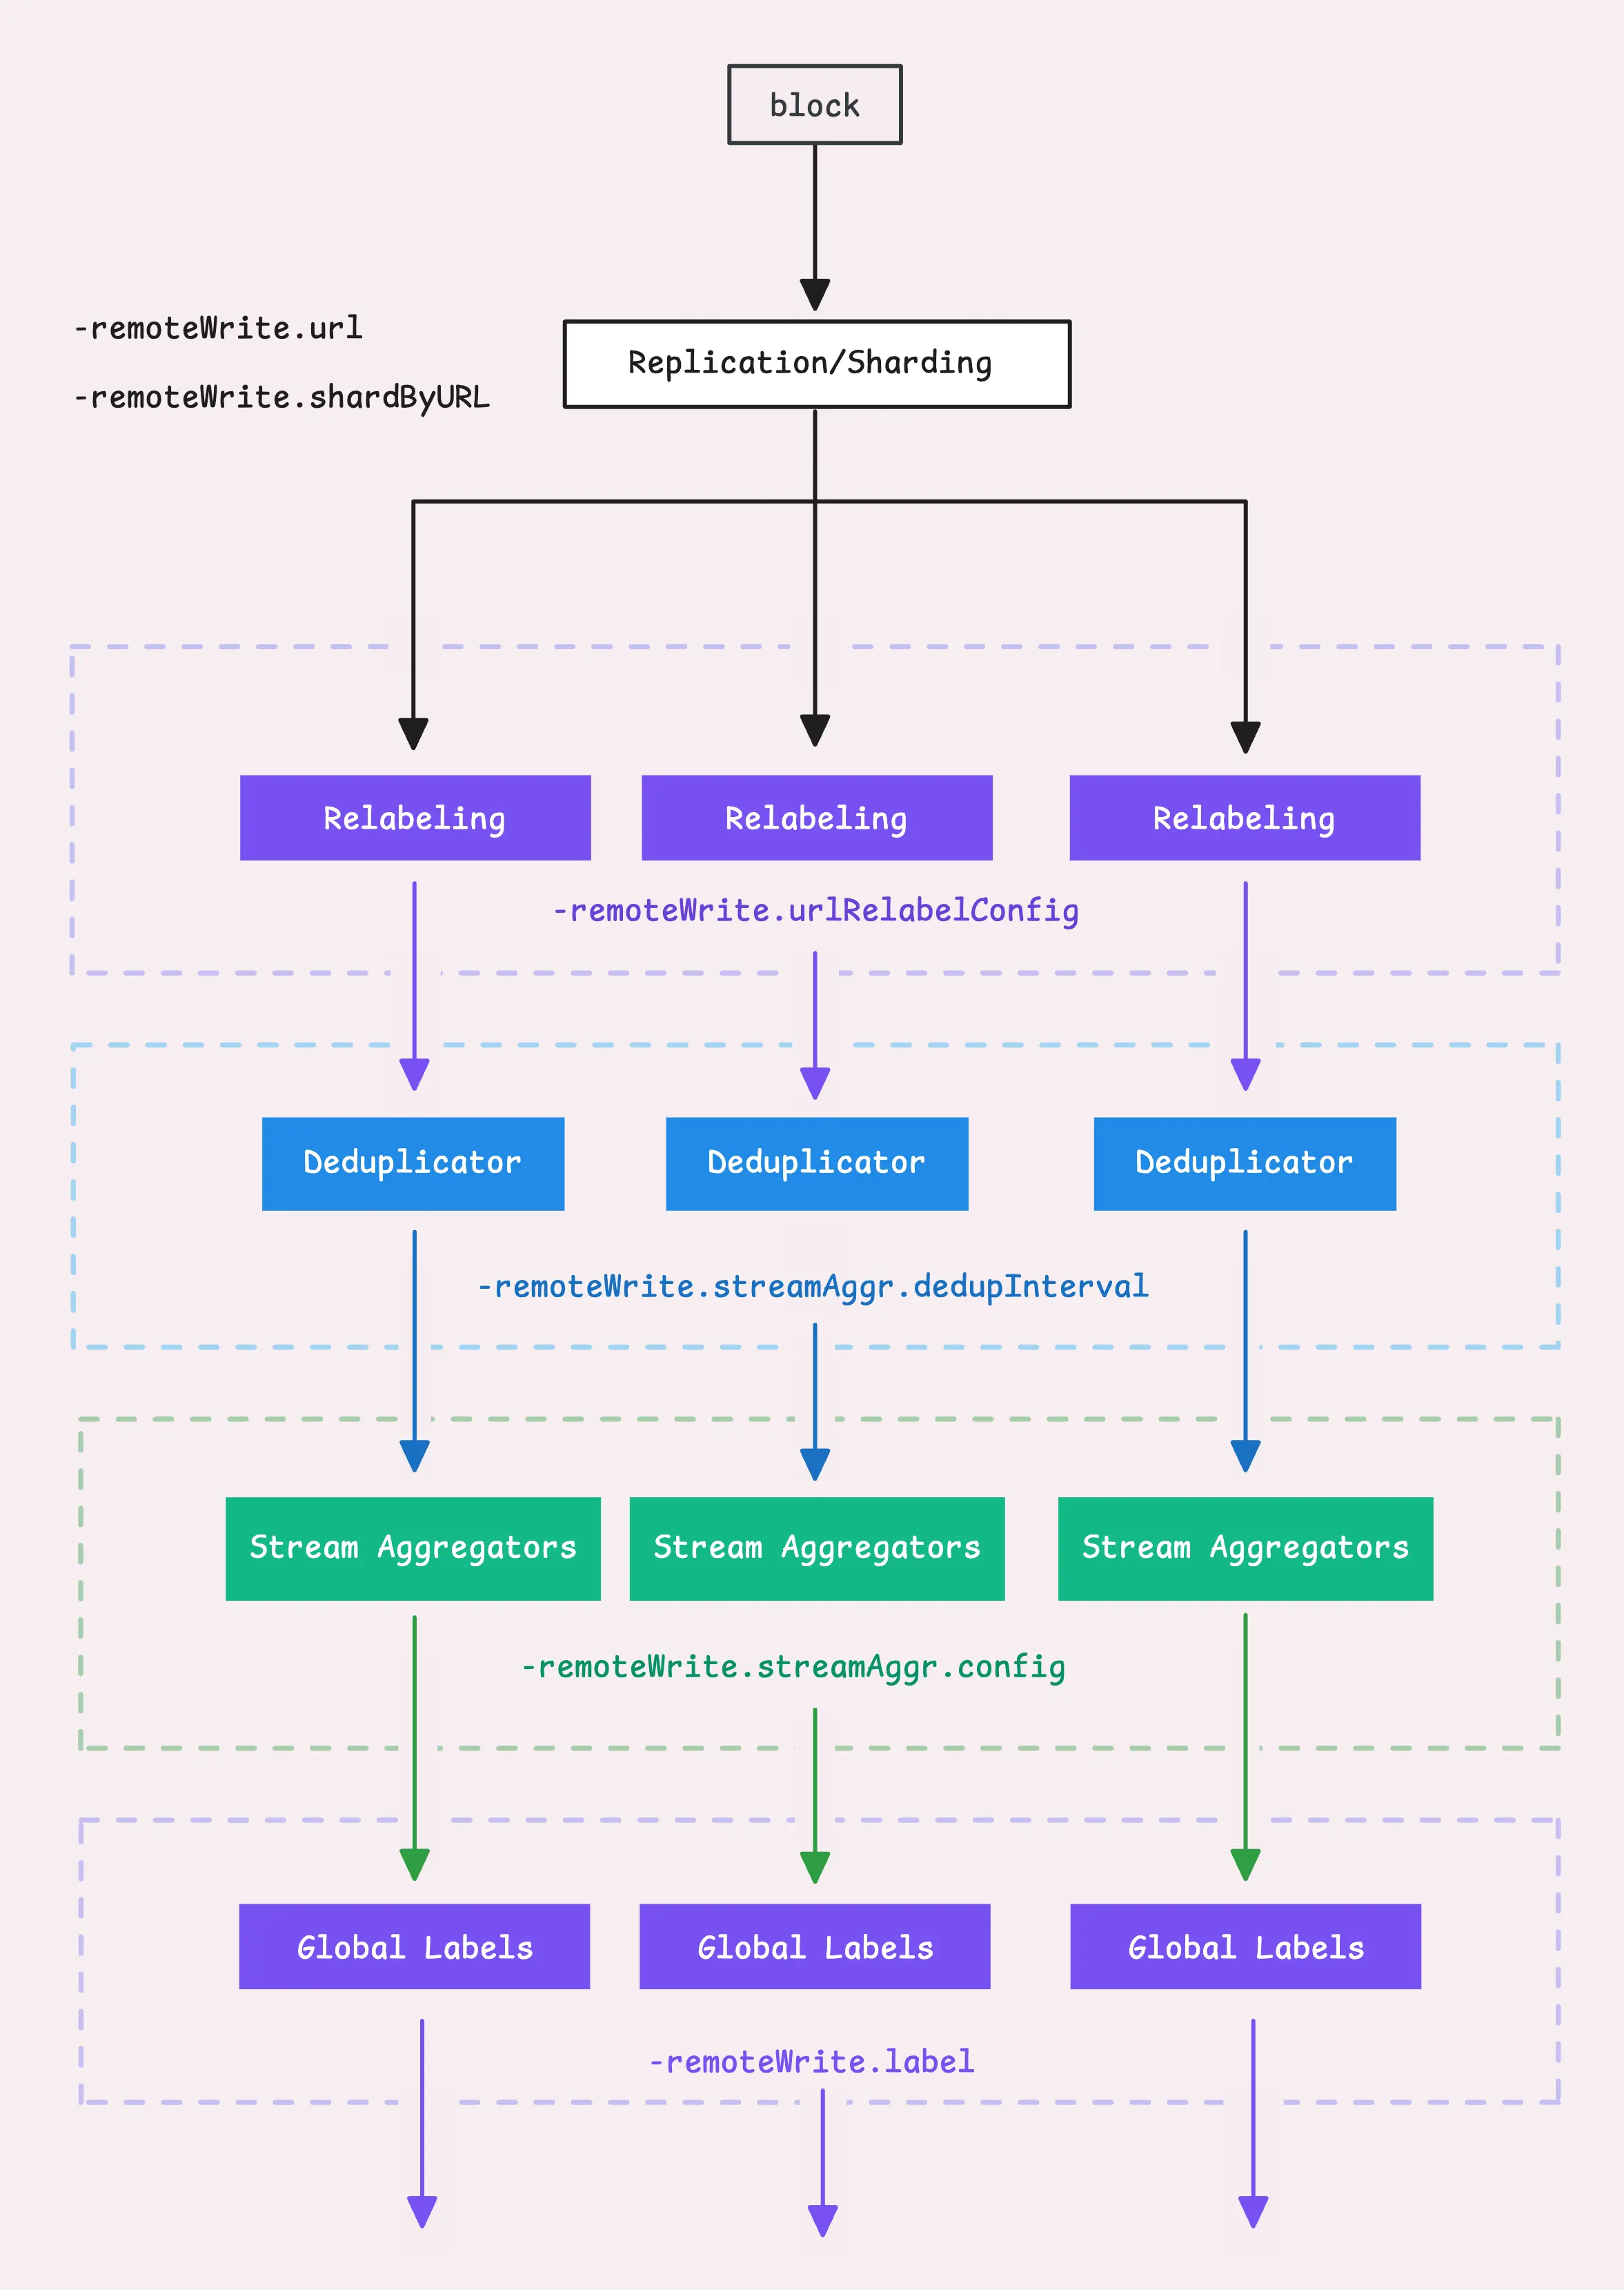
Finally, we add global labels (-remoteWrite.label) to all the time series data. These labels are applied no matter what relabeling happens at the remote storage level.
Now, we’re done with modifying labels, but we still need to tweak the sample values.
Our vmagent can modify the values of time series samples by rounding them in two ways: either to a specific number of significant figures or to a set number of decimal places.
Significant figures (
-remoteWrite.significantFigures): Focuses on how meaningful or precise the number is. For instance, 12345.6789 rounded to 2 significant figures becomes 12000 (it keeps just the 1 and 2, dropping the rest). If you set a value for significant figures that’s less than or equal to 0, or more than 18, no rounding is applied.Decimal places (
-remoteWrite.roundDigits): Controls how many digits are kept after the decimal point. So, with the same example, 12345.6789 rounded to 2 decimal places becomes 12345.68. If the number of decimal places is set to less than or equal to 0, or more than 100, vmagent won’t round it.
By default, vmagent doesn’t do any rounding at all (significant figures are set to 0, and decimal places are set to 100).
“What’s this good for?”
Besides making the data more readable, these simpler sample values also help VictoriaMetrics compress the data more effectively, which can save on storage.
Step 6: Flush: Fast Queue
#
Now that we’ve got:
- A block of time series data with corrected labels,
- Rounded sample values,
- The correct destination set.
It’s time to flush these samples to the in-memory queue, also known as the “fast queue.”
The fast queue is a hybrid system made up of both an in-memory queue and a file-based (persistent) queue that uses disk storage. This setup helps us handle samples that pile up too quickly when the remote storage can’t keep up with the ingestion rate.
Earlier in the process, we decompressed the time series data using either snappy or zstd (or none). Now we need to compress it again before sending it to the fast queue.
If after compression the block of data is larger than 8 MB (-remoteWrite.maxBlockSize), vmagent will split it in half, and keep splitting recursively until it meets the 8 MB limit.
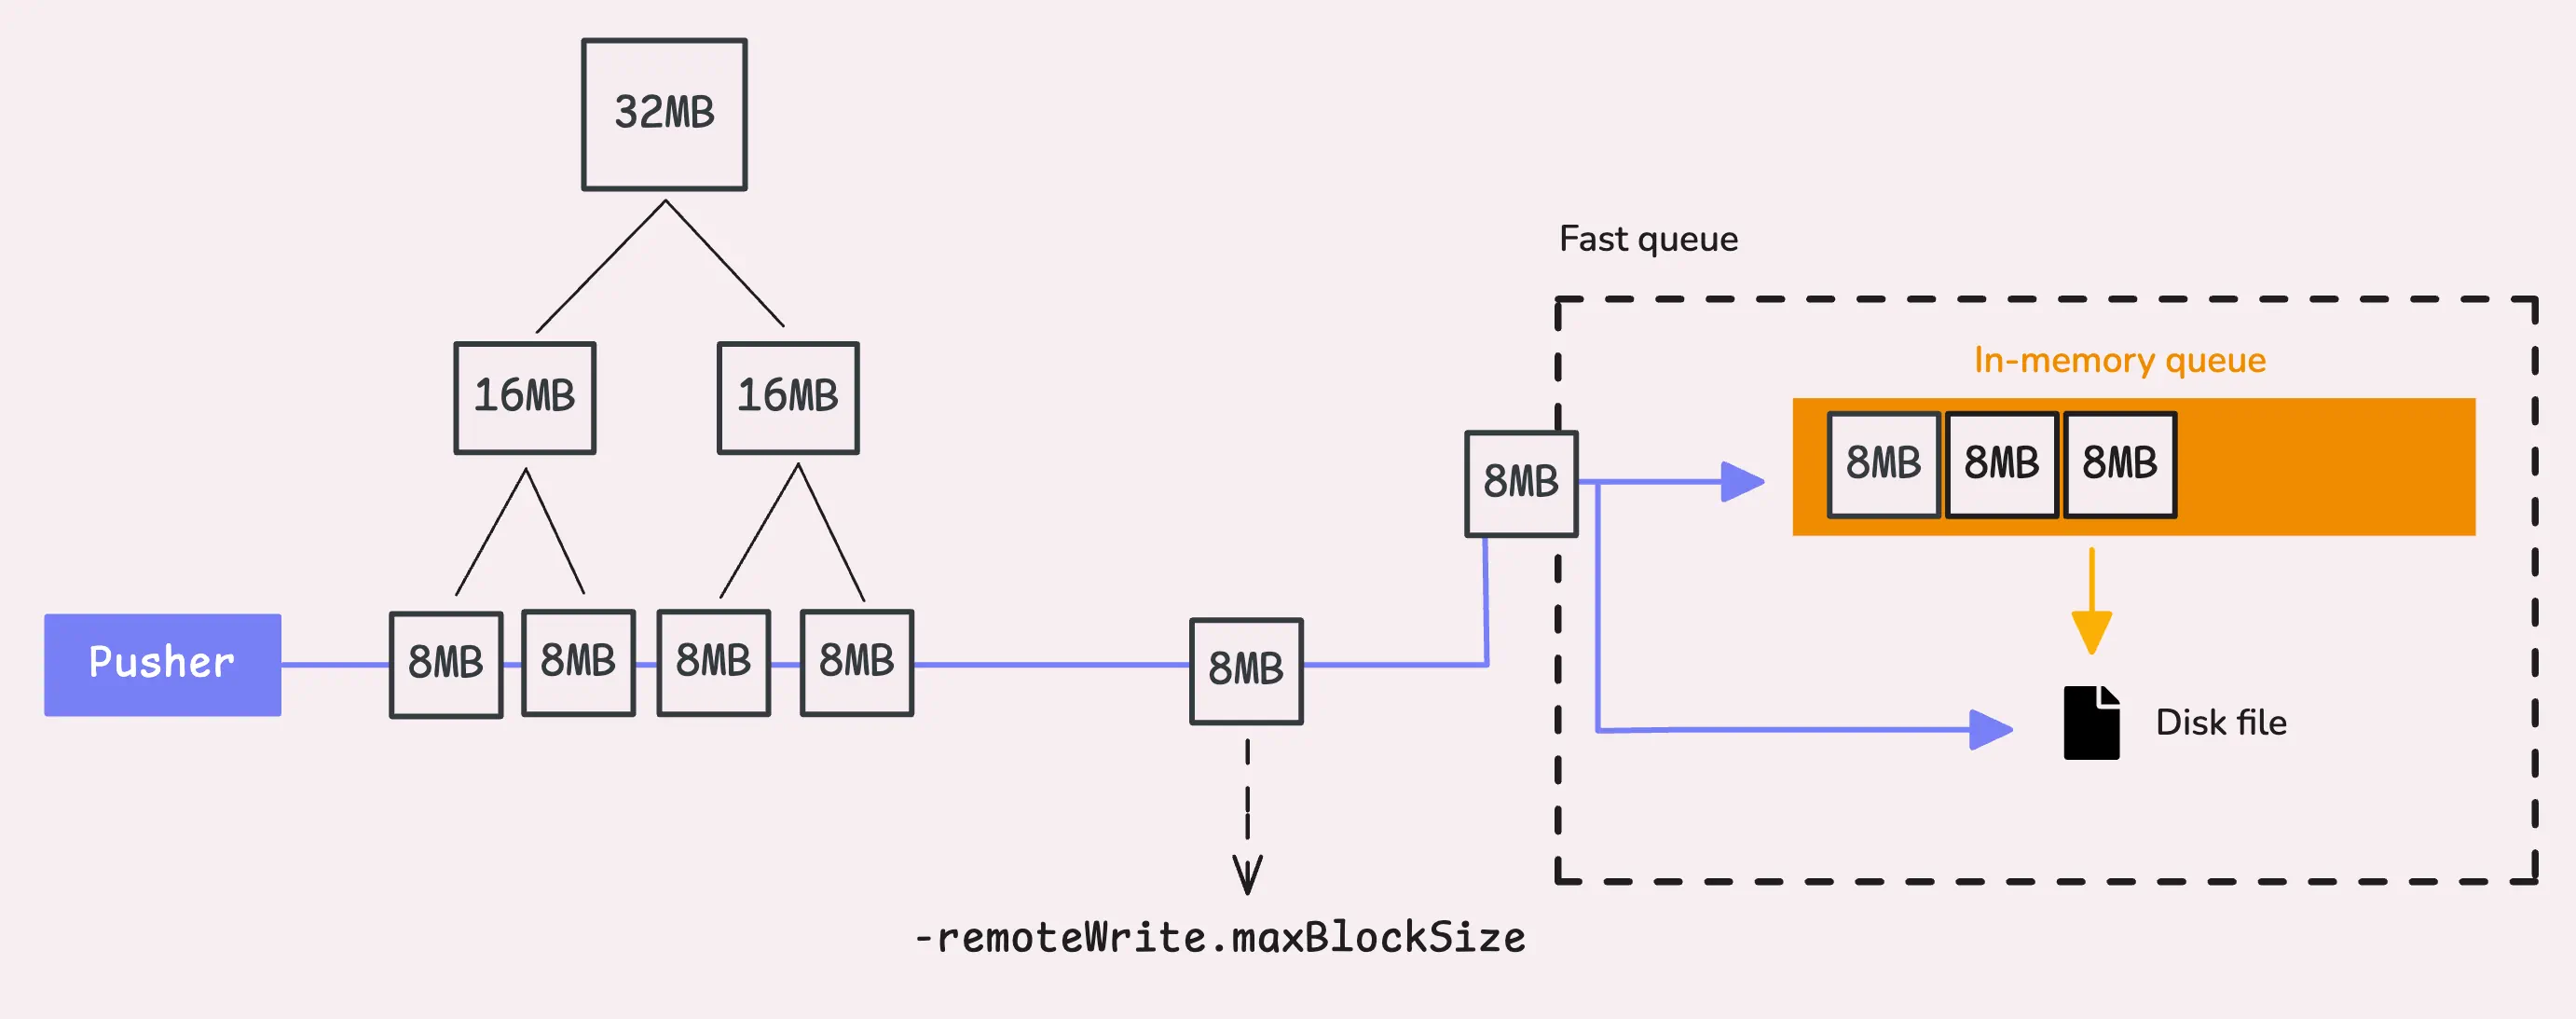
“What happens if a single sample is already larger than the max block size? We can’t split it anymore!”
Good point. In edge cases where a sample exceeds the max block size, you’ll see a warning log: “dropping a sample for metric with too long labels exceeding -remoteWrite.maxBlockSize=%d bytes”. This happens when the max size is set too low for certain metrics.
If you set the max block size too high, vmagent has a safeguard in place.
The compressed block size (after compression) is capped at 32 MB and this limit is hardcoded, so you don’t have to worry about bloated blocks overwhelming your system.
In-memory Queue
#
Alright, we’re good to go! Let’s take a closer look at how the fast queue works.
The in-memory queue is actually a simple buffered channel in Go, which functions as a FIFO (First In, First Out) queue. But, who’s reading from this channel?
When vmagent starts, it spins up a certain number of workers (or goroutines). By default, this is 2x the number of available CPU cores. If you’re dealing with a high volume of data and need more power, you can increase the worker count using the -remoteWrite.queues flag.
These workers have 5 seconds to read data from the in-memory queue.
If they don’t manage to pull the data in time, those samples get flushed to the file-based queue (disk storage).
“Does the in-memory queue have a limit?”
Yes, it does. There’s a cap on how many blocks of data can be stored in memory.
If we hit that limit too quickly (within that 5-second window), any extra data will be flushed to disk. You can adjust this limit by setting -memory.allowedPercent (default is 60%) or -memory.allowedBytes if you want to be more specific. If you set allowed bytes, it overrides the percentage setting.
The default setting is generally fine as is, don’t tweak it unless you’re sure of what you’re doing.
Here’s how the max memory is calculated:
maxInmemoryBlocks := allowed memory / number of remote storage / maxRowsPerBlock / 100

// clamp(value, min, max)
clamp(maxInmemoryBlocks, 2, queue * 100)
Remember, we have a default of 10,000 samples (rows) per block (-remoteWrite.maxRowsPerBlock). We also make sure there are always at least 2 blocks in memory, and no more than 100 blocks per queue.
To sum up, when does data get flushed from memory to disk?
- Worker timeout: If 5 seconds go by and a worker hasn’t read from the in-memory queue, the data is flushed to disk.
- Backlogged disk queue: If the disk queue still has data waiting to be flushed to remote storage, any new blocks get pushed straight to disk.
- Memory limit reached: If the in-memory queue hits its limit, new blocks get pushed to disk immediately.
This way, even if things slow down on the remote storage side, your data is still safe and won’t get lost.
File-based Queue
#
When data gets flushed to disk, it’s stored in the directory specified by -remoteWrite.tmpDataPath (default: /vmagent-remotewrite-data). If you don’t need to persist data to disk, you can disable this feature by setting -remoteWrite.disableOnDiskQueue.
Just like the in-memory queue, the file-based queue also has limits.
The system will only store a set amount of data on disk, controlled by the -remoteWrite.maxDiskUsagePerURL (default: 0 - unlimited) flag. If we hit that limit, vmagent makes sure new data won’t overflow by removing the oldest blocks of unprocessed data to make space.
As old blocks are dropped, vmagent updates the internal counters and logs how much data was dropped.
Tip: Useful metrics
- Block drop:
vm_persistentqueue_blocks_dropped_total. - Bytes drop:
vm_persistentqueue_bytes_dropped_total.
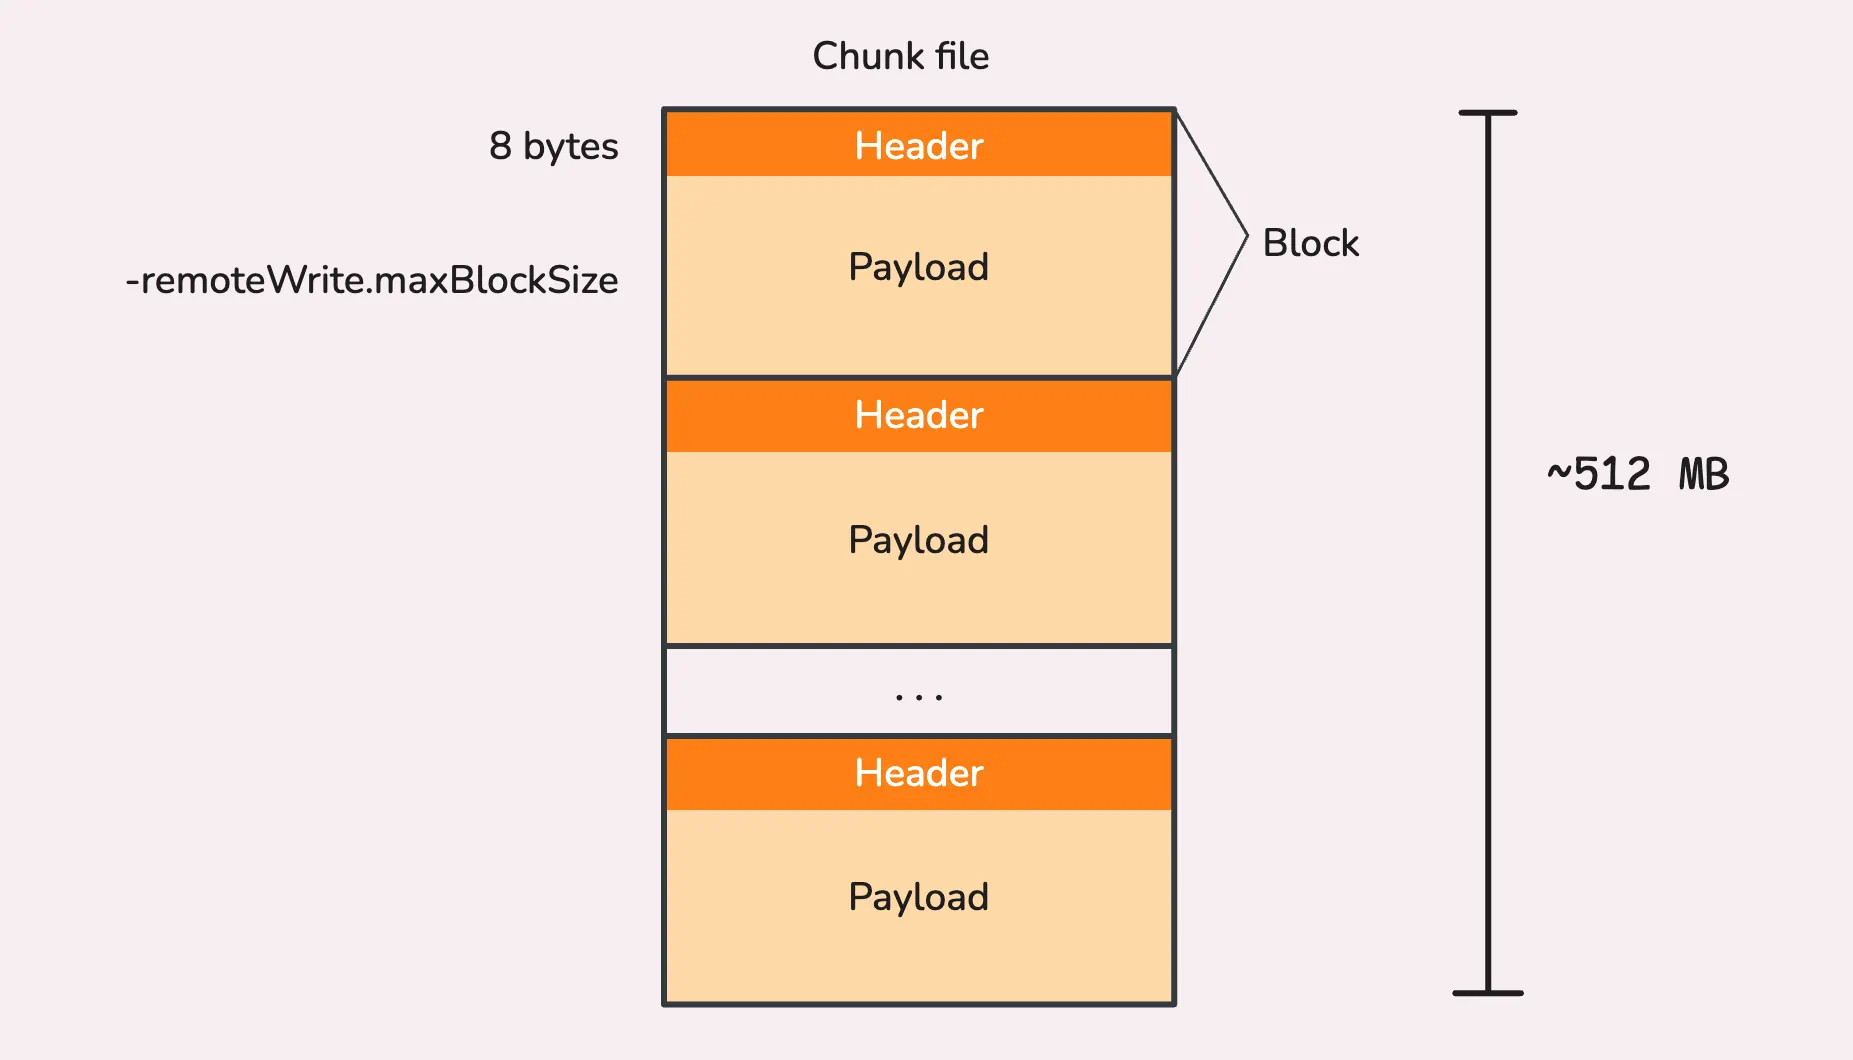
When data is written to disk, it’s stored in chunk files. Each chunk file is capped at roughly 512 MB, and once that limit is reached, vmagent creates a new chunk file for the next set of blocks. Over time, multiple chunk files may be created as data keeps coming in.
Each block of data within a chunk file has two parts:
- Header: This is a small, 8-byte header that tells the system the size of the block, it helps vmagent know how much data to read when retrieving the block later.
- Payload: This is the actual block of time series data, written after the header.
“Why limit each chunk file to 512 MB?”
Good question! The 512 MB limit is hardcoded and comes from the following logic:
const MaxBlockSize = 32 * 1024 * 1024 // 32 MB
const DefaultChunkFileSize = (MaxBlockSize + 8) * 16 // over 512 MB
The largest block size is expected to be around 32 MB (compressed) at most, plus 8 bytes for the header. Since each chunk file can hold up to 16 blocks, this adds up to just over 512 MB per chunk file.
These chunk files are stored in the /vmagent-remotewrite-data/persistent-queue/<url_id>_<url_hash>/<byte_offset> directory. If you are using a Helm chart, the default root path (-remoteWrite.tmpDataPath) may be different, such as /tmpData.
/tmpData/persistent-queue
│
└── 1_B075D19130BC92D7
    ├── 0000000000000000  # 512 MB chunk file
    ├── 0000000002000000  # 512 MB chunk file
    ├── 0000000004000000  # 512 MB chunk file
    ├── 0000000006000000  # 512 MB chunk file
    ├── flock.lock
    └── metainfo.json
Now, when writing to a file, it’s not exactly efficient to write small chunks of data directly to disk every single time.
Instead, vmagent uses buffered writing, we can think of it like a “holding area” in memory where smaller pieces of data are gathered until the buffer is full or it makes sense to write it all to disk at once.
This helps reduce the number of disk writes and speeds things up. Of course, if a chunk of data is too big to fit in the buffer, vmagent skips the buffer and writes that data straight to disk.
“So, how big is the buffer?”
The buffer size is based on your memory settings (-memory.allowedPercent, default is 60%, or -memory.allowedBytes). The calculation looks like this:
// clamp(x, min, max)
bufferSize := clamp(allowed memory / 8 KB, 4 KB, 512 KB)
For instance, if your allowed memory is 2 GB, the buffer size would be 250 KB, which is nicely within the 4 KB to 512 KB range.
After the data is flushed to disk, vmagent also writes out a small metadata file (metainfo.json) to track how much data has been processed, how much is written, and other essential info. If the system crashes or gets restarted, this metadata helps vmagent pick up right where it left off.
“What about the data held by the deduplicator and stream aggregator?”
Same deal, the deduplicator flushes its data to the stream aggregator based on the dedup interval, and then the stream aggregator periodically flushes it to the fast queue, following the same process.
So, everything stays in sync even when buffering and writing to disk.
Step 7: Flush: Remote Storage
#
As we’ve discussed, when vmagent starts, it launches a number of workers to pull data blocks from the fast queue (both the in-memory and file-based queues), process them, and then attempt to send them to the remote storage.
Each remote storage gets its own set of workers, usually 2x the number of CPU cores (-remoteWrite.queues). So, if you’ve got 4 CPU cores, you’ll have 8 workers in total for each remote storage.
A worker pulls a block of time series data from the queue. It checks the in-memory queue first, and if that’s empty, it moves on to the file-based queue. If both queues are empty, the worker just waits until new data arrives.
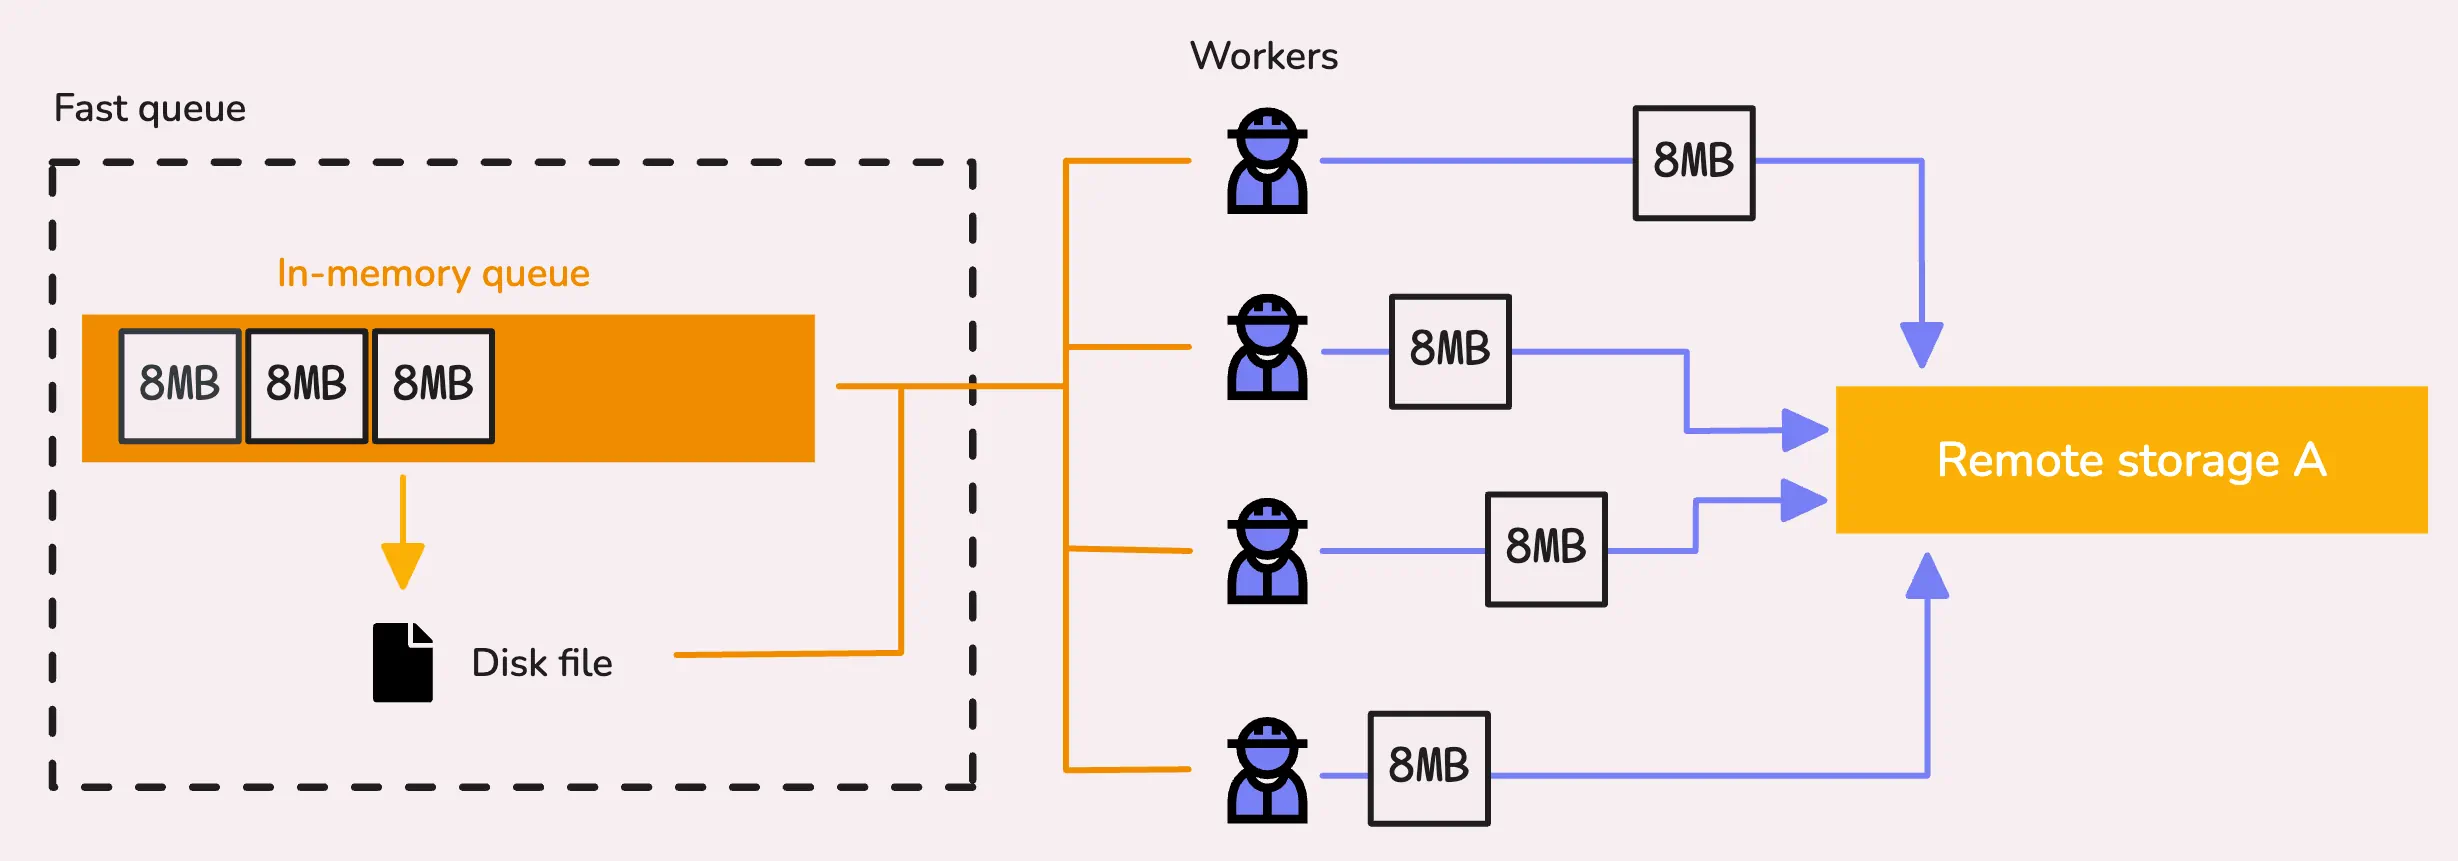
Once it has a valid block, the worker starts sending it to the remote storage, and it blocks until a response is received. If vmagent needs to stop at this point (say, for a restart or reschedule), it handles things gracefully by waiting up to 5 more seconds for the request to finish sending. That’s why vmagent can take a moment to actually stop—it’s waiting for the data to get through.
If the 5 seconds pass and the data still hasn’t been responded to, vmagent forcefully writes that block back to the fast queue. Depending on the situation, it might go back into the in-memory queue or get stored in the file-based queue.
There are a couple of interesting things that happen right before a block of data is sent to remote storage.
The vmagent uses a rate limiter to ensure the data doesn’t exceed a certain number of bytes per second (-remoteWrite.rateLimit).
By default, this is unlimited (0), but it’s particularly useful if a remote storage server comes back online after being unavailable for a while. It prevents the server from being overwhelmed by a flood of requests all at once.
Tip: Useful metrics
- Total number of requests sent:
vmagent_remotewrite_requests_total{url="%s",status_code="%d"}. - Total bytes sent:
vmagent_remotewrite_bytes_sent_total. - Total blocks sent:
vmagent_remotewrite_blocks_sent_total. - Request duration:
vmagent_remotewrite_duration_seconds.
There’s also a duration metric called vmagent_remotewrite_send_duration_seconds_total to track how long it takes to send a block to remote storage, regardless of whether it was successful or not.
“What happens if sending fails?”
If the remote storage responds with a status code of 409 or 400, it’s considered a permanent rejection.
This usually means the block can’t be accepted due to something like a bad request or a conflict. In this case, vmagent logs the event and skips the block entirely - similar to how Prometheus handles these scenarios. You can track how many blocks are rejected with the vmagent_remotewrite_packets_dropped_total metric.
For other types of failures (with different status codes), vmagent retries sending the block using exponential backoff.
This means that with each failure, the time between retries gets progressively longer, but it won’t exceed a predefined maximum retry duration. You can monitor how many times vmagent retries with the vmagent_remotewrite_retries_count_total metric.
The initial retry interval (-remoteWrite.retryMinInterval) is 1 second by default, and the maximum retry interval (-remoteWrite.maxRetryInterval) is 60 seconds.
Read next: How vmstorage Handles Data Ingestion
Who We Are
#
Need to monitor your services to see how everything performs and to troubleshoot issues? VictoriaMetrics is a fast, open-source, and cost-efficient way to stay on top of your infrastructure’s performance.
If you come across anything outdated or have questions, feel free to send me a DM on X (@func25).
Leave a comment below or Contact Us if you have any questions!
comments powered by Disqus
- What is vmagent?
- Step 1: Receiving Data via API or Scrape
- Step 2: Global Relabeling, Cardinality Reduction
- Step 3: Global Deduplication & Stream Aggregation
- Step 4: Sharding & Replication
- Step 5: Per Remote Storage Fine-tuning, Rounding Sample Values
- Step 6: Flush: Fast Queue
- Step 7: Flush: Remote Storage
- Who We Are