- Blog /
- vmagent High-Availability Examples
vmagent High-Availability Examples
Share:


vmagent supports both the pushing and pulling (scrape) of metrics and here are examples of high availability setups for both cases.
Push and High Availability
#
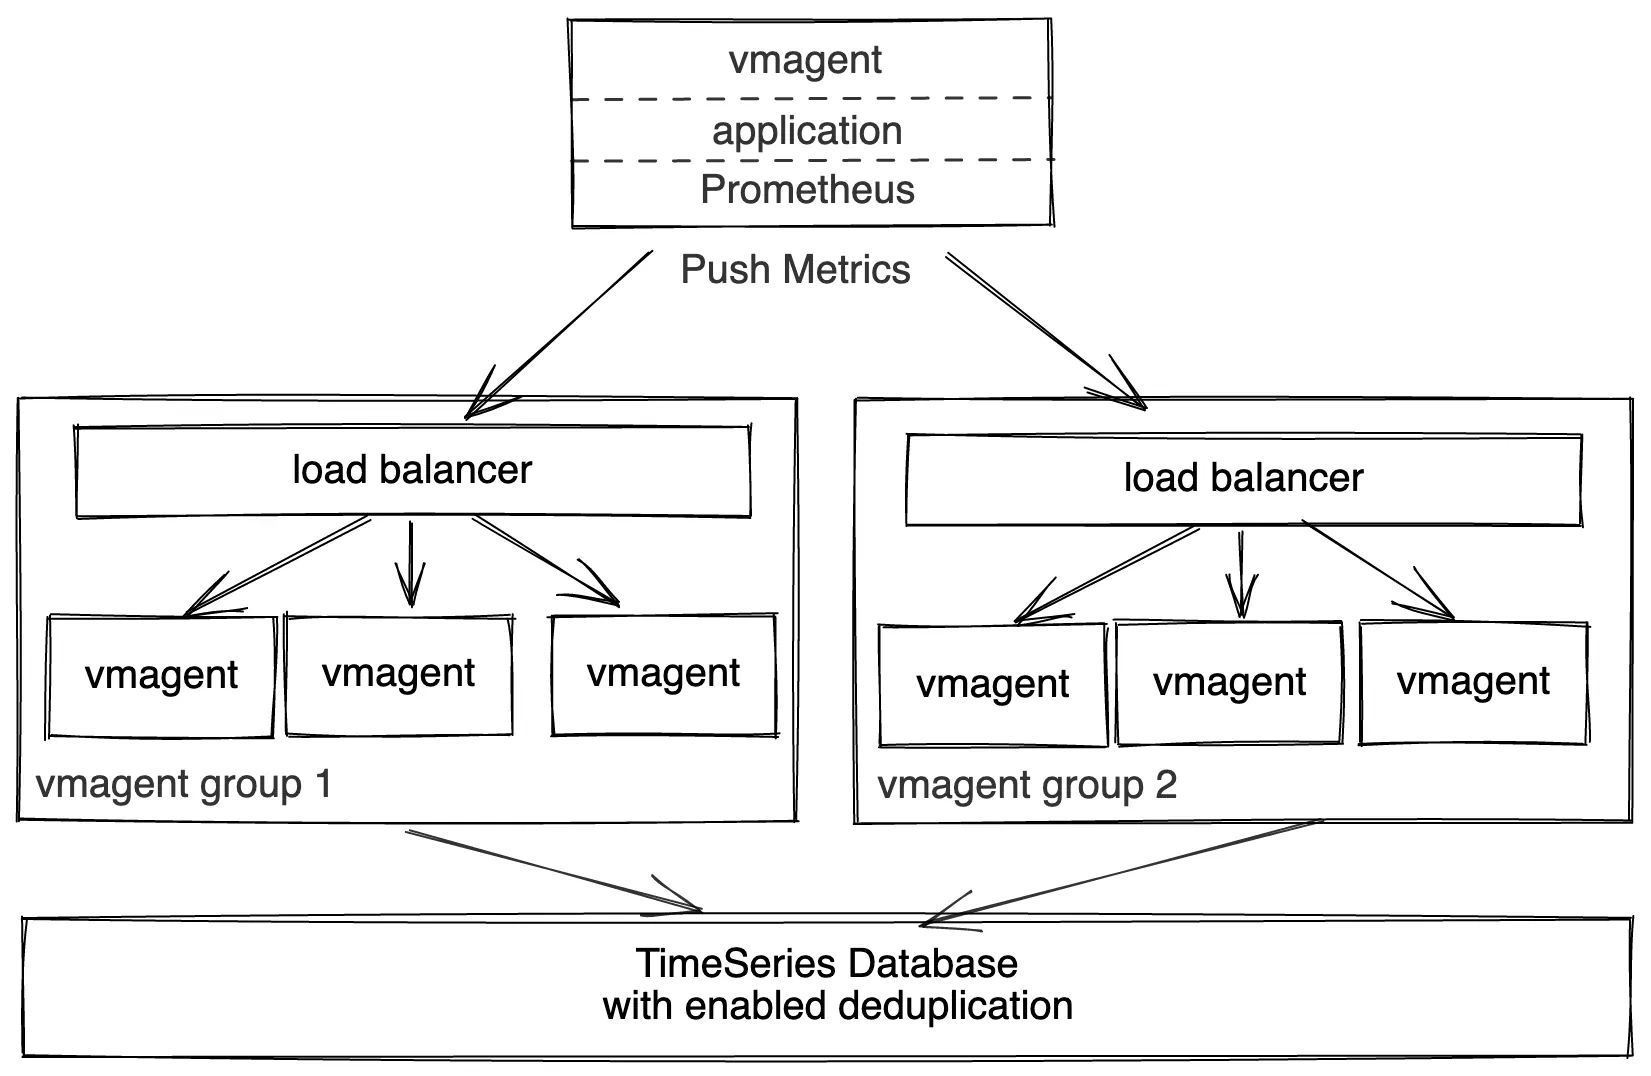 vmagent push model high availability
Multiple sources can push data simultaneously to two groups of identically configured vmagents via the following supported push protocols:
- InfluxDB line protocol
- DataDog “submit metrics” API
- Graphite plaintext protocol
- OpenTSDB http and telnet protocols
- Arbitrary CSV
- JSON line protocol
- Prometheus remote write protocol
- Prometheus metrics exposition format
The groups must be located in distinct availability zones for high availability puproses. E.g. when a group in a single AZ becomes unavailable, the collected data continues flowing to the group in another AZ.
The load-balancer in front of vmagent groups serves the following purposes:
- Horizontal scalability. If existing vmagent nodes in the group reach their scalability limits, then just add new vmagent nodes in order to process larger amounts of data.
- High availability. If a single vmagent becomes unavailable, then the load-balancer continues routing the incoming data via the remaining available vmagent nodes.
vmagent nodes push the incoming data to VictoriaMetrics (either single-node or cluster version may be used for storing the data).
The deduplication must be set up at VictoriaMetrics in order to remove duplicate samples received via two vmagent groups. See how to deduplicate data in single-node VictoriaMetrics and how to deduplicate data in the cluster version of VictoriaMetrics.
Pull and High Availability for small-to-medium loads
#
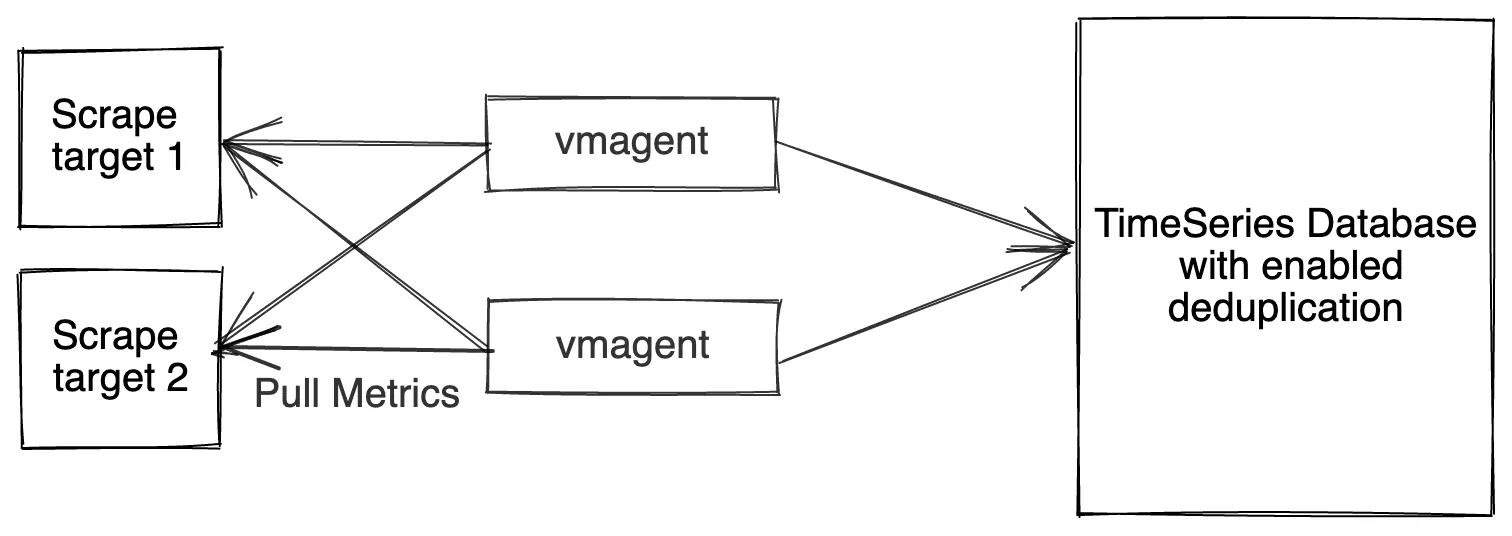 vmagent pull model high availability for small-to-medium loads
Two identically configured vmagent instances scrape the same targets and send the collected metrics to VictoriaMetrics (either single-node or cluster version may be used for storing the data). If a single vmagent instance is temporarily unavailable, then the remaining vmagent continues scraping the metrics. This prevents gaps in the collected data at VictoriaMetrics.
The deduplication must be set up at VictoriaMetrics in order to remove duplicate samples received via two vmagent instances. See how to deduplicate data in single-node VictoriaMetrics and how to deduplicate data in the cluster version of VictoriaMetrics.
Pull and High Availability for high loads
#
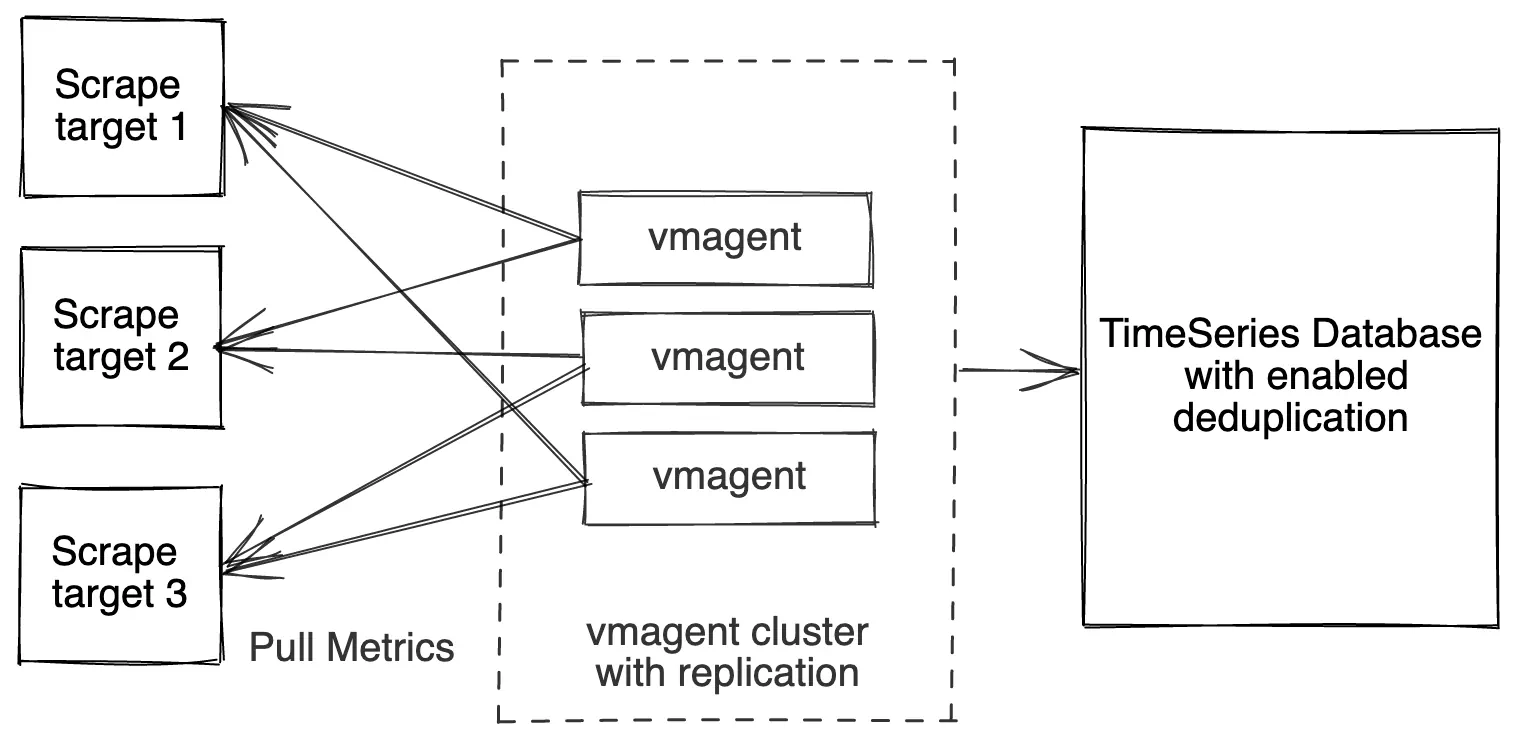
vmagent pull model high availability for high loads
If a single vmagent has no enough resources for scraping the needed targets, then it is possible to spread scrape targets among a group of vmagent instances. This can be achieved with the following command-line flags:
-promscrape.cluster.membersCount- the number of members in the group of vmagent instances-promscrape.cluster.memberNum- unique index of vmagent instance in the group-promscrape.cluster.replicationFactor- the number of vmagent instances in the cluster, which scrape every configured target
Every vmagent instance in the group must have identical -promscrape.config files and identical command-line flags except of -promscrape.cluster.memberNum flag.
Every vmagent instance must have unique value for the -promscrape.cluster.memberNum flag in the range [0 .. promscrape.cluster.membersCount-1].
In this setup every vmagent instance scrapes promscrape.cluster.replicationFactor / promscrape.cluster.membersCount part of all the scrape targets
defined at -promscrape.config (including dynamically discovered scrape targets).
If -promscrape.cluster.replicationFactor is set to a value greater than 1, then deduplication must be set up at VictoriaMetrics in order to remove duplicate samples received from vmagent replicas. See how to deduplicate data in single-node VictoriaMetrics and how to deduplicate data in the cluster version of VictoriaMetrics.
Give it a try and please do share your feedback or ask us any questions via the comments section below. We’d love to know your experience!
Leave a comment below or Contact Us if you have any questions!
comments powered by Disqus