- Blog /
- VictoriaMetrics Tech Talk Stream: A Deep Dive into Blackbox Monitoring

VictoriaMetrics Tech Talk Stream: A Deep Dive into Blackbox Monitoring
VictoriaMetrics Tech Talk Stream: A Deep Dive into Blackbox Monitoring
#
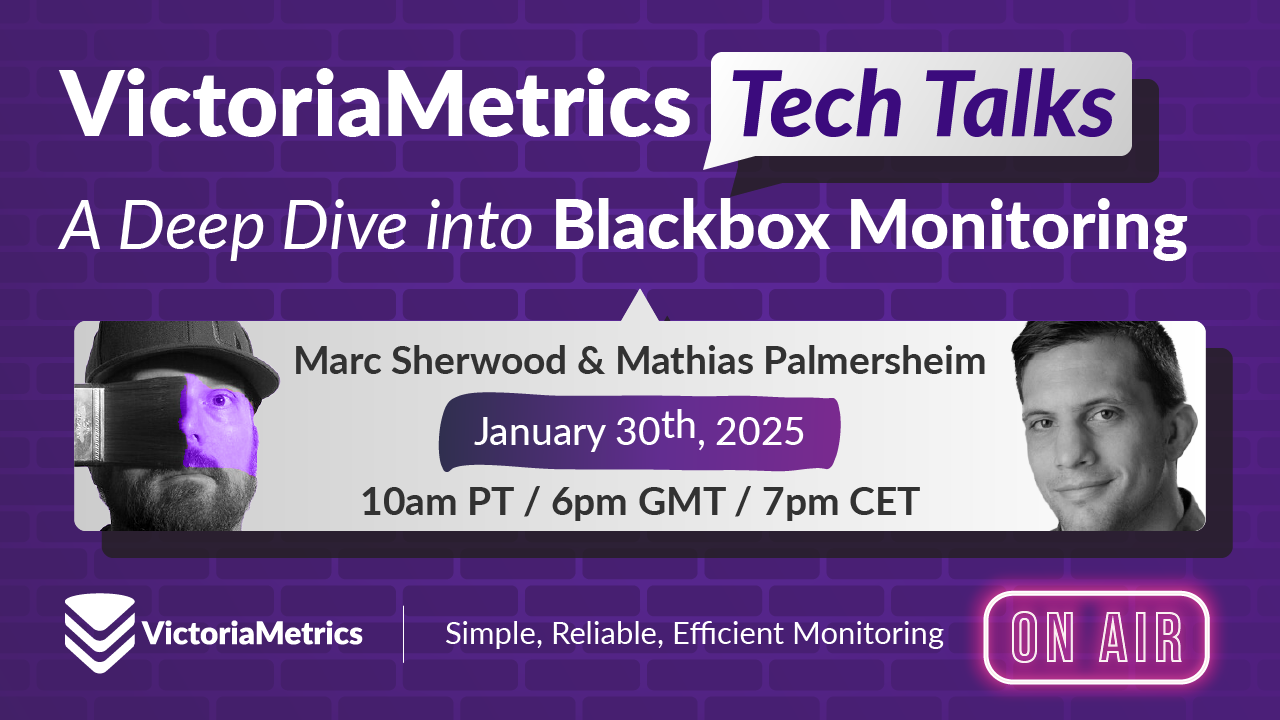
Join us for the first stream of our brand new monthly tech talk series, where we’ll dive deep into the world of monitoring and observability.
Tech Talk #1: A Deep Dive into Blackbox Monitoring
Do you have any blackboxes that do not provide any monitoring data except for letting you know things are broken? Do you wish you had a way to know your systems were healthy without the constant vigilance?
Join our tech talk to discover how blackbox monitoring can give you peace of mind. Then join us for a tech talk on Blackbox Monitoring where we’ll explore how to gain valuable insights into your application’s health and performance from an external perspective.
Here’s a sneak peek of what we’ll cover:
- The Problem: Why simple health checks are not enough and how blackbox monitoring fills the gap.
- What is Blackbox Monitoring? Understanding the core concepts and benefits of monitoring your applications like a user.
- Solutions: Exploring various blackbox monitoring tools, from open-source options like Gatus, Uptime Kuma, Telegraf, and Blackbox Exporter to dedicated SaaS solutions. We’ll weigh the pros and cons of each to help you choose the best fit.
- Live Demo: A practical demonstration using Shiftmon and Telegraf to set up and configure blackbox monitoring for your applications. We’ll cover:
- Deploying monitoring nodes.
- Configuring checks for HTTP responses, DNS queries, SSL certificates, and ping.
- Setting up alerts to notify you of potential issues.
- Visualizing data with Grafana dashboards.
- Real-world scenarios: Witnessing blackbox monitoring in action as we simulate an outage and observe how the system detects and alerts on the issue.
This talk is perfect for:
- DevOps engineers
- SREs
- System administrators
- Anyone interested in improving their application monitoring strategy
Don’t miss out! Join us and learn how to stop babysitting your dashboards and gain peace of mind knowing your applications are running smoothly.
Tune in on our YouTube Channel! 🔔
Save the date: January 30th, at 10 am PT / 6 pm GMT / 7 pm CET!
Add an event to your calendar: Google, Outlook, Apple.
Leave a comment below or Contact Us if you have any questions!
comments powered by Disqus