- Blog /
- VictoriaMetrics September 2026 Ecosystem Updates

VictoriaMetrics September 2026 Ecosystem Updates
Share:


Another month whooshed by, bringing a slew of updates: 3 vmanomaly and 2 VictoriaMetrics releases, and new versions of vmestimator, VictoriaTraces, and our first ever LTS release of VictoriaLogs. This brings 12 months of stability to VictoriaLogs Enterprise users.
But the big one was the launch of VictoriaTraces on VictoriaMetrics Cloud. Finally, we can offer a complete managed observability stack with metrics, logs, and traces. We run it, you use it.
This ecosystem update includes:
- Releases of VictoriaMetrics 1.153.0 and 1.152.0
- Updates for vmestimator 0.1.16, VictoriaLogs 1.53.0, VictoriaLogs LTS 1.52.1, and VictoriaTraces 0.12.0.
- Releases of vmanomaly 1.30.7, 1.30.6, 1.30.5.
VictoriaMetrics 1.153.0 is out: OIDC single sign-on for vmauth
#
- New OIDC-based single sign-on on vmauth: vmauth now supports Single sign-on (SSO) via OpenID Connect.
- Skip pending state on vmalert restarts: vmalert now moves alerts straight to firing when their state can be restored after a restart, instead of going through an unnecessary pending phase first.
- Improved page cache efficiency in storage: vmsingle and vmstorage now support opt-in
FADV_RANDOMandMADV_RANDOMhints for data part files. We believe this setting can improve query performance. If you are interested in testing, enable the-fs.disableAdviseRandomRead=falseflag and, should you find it helpful, please share your results and feedback in issue #11461. Thank you! - HTTP headers in vmauth access logs: vmauth can now print selected HTTP headers in its access logs. Only headers listed in the
access_log.headerssetting are logged, which makes it easier to troubleshoot pipelines that rely on HTTP headers. - Includes 11 bug fixes and 3 security fixes
VictoriaMetrics 1.152.0 is out: Accurate unused metrics reporting in cluster
#
- Unused metrics reporting fix: In VictoriaMetrics cluster, vmselect now applies the
lefilter on the/api/v1/status/metric_names_statsendpoint only after merging request counters from all vmstorage nodes. Previously, the endpoint could incorrectly report actively queried metrics as unused when a node’s local request counter was zero. Thanks to @missusk for their contribution.
vmestimator 0.1.16 is out: Churn ratio estimation
#
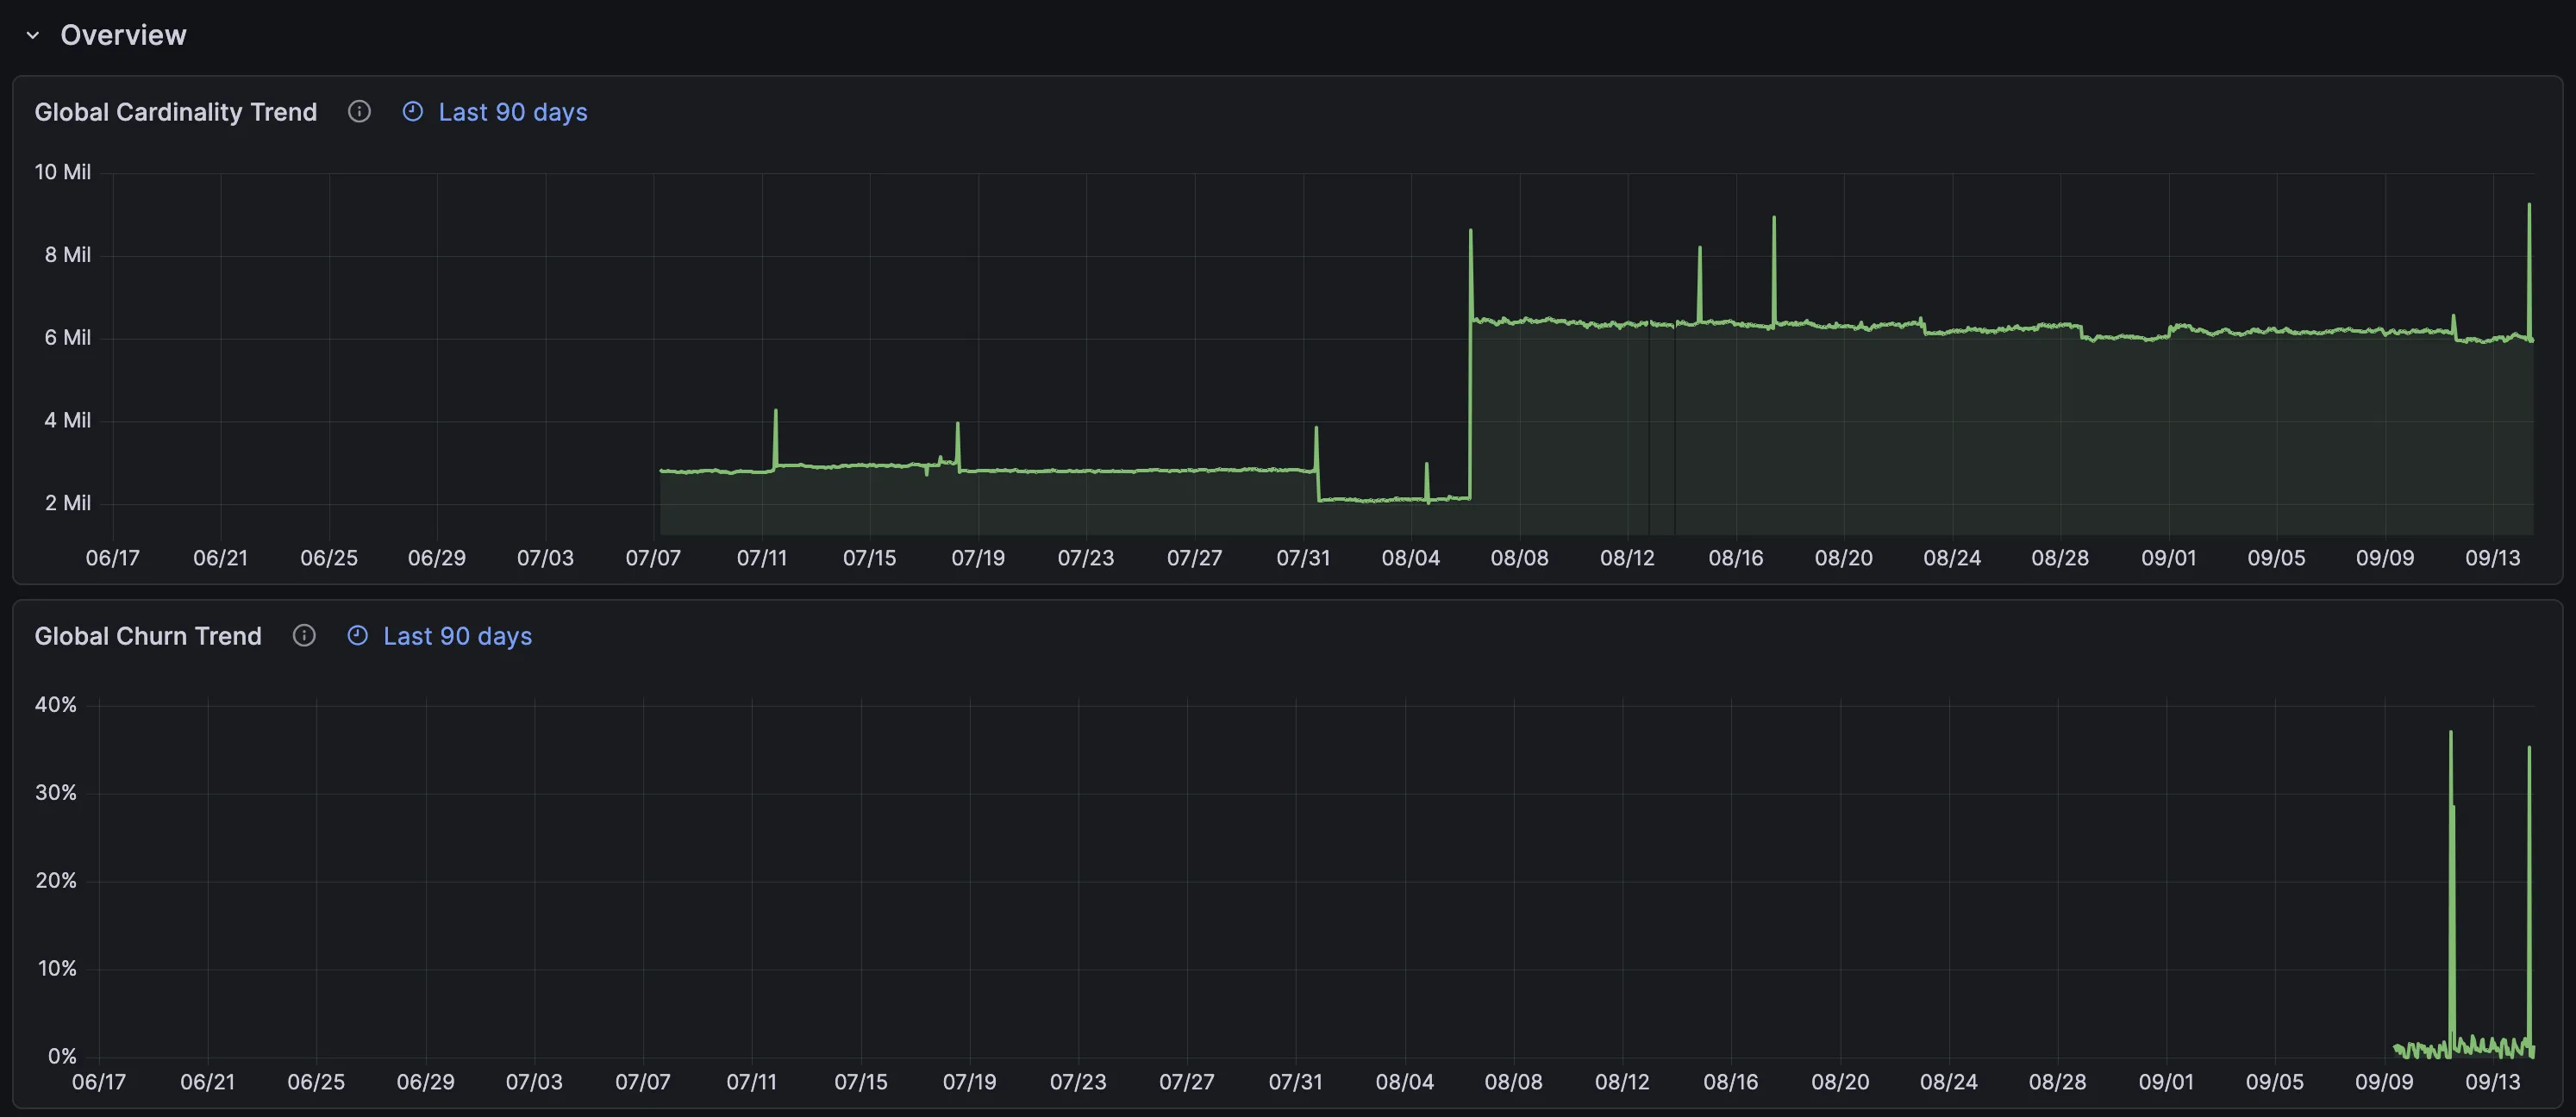
- New churn ratio metric: vmestimator can now estimate churn as well as cardinality. Set the new
churn_intervaloption on a stream, and vmestimator will expose acardinality_churn_ratiometric per group, with values from0(a stable series set) to1(the series were completely replaced). This makes it easier to find jobs that put high churn indexing pressure on storage. - Improves the Cardinality Estimations dashboard: The VictoriaMetrics - Cardinality Estimations is available in our Grafana playground and now shows churn alongside cardinality estimates. See the dashboards docs for details.
VictoriaLogs 1.53.0 is out: Faster latest logs queries in cluster mode
#
Caution: If you run v1.52.0, we recommend upgrading since that version could panic or drop logs with duplicate stream field names at ingestion, and panic when querying such logs written by earlier releases.
Endpoint changes: This release has two security-related changes that may break existing scripts or automation.
- The
/internal/force_merge,/internal/force_flush,/internal/log_new_streams, and/internal/partition/*HTTP endpoints now accept only the POST method Update any scripts that call these endpoints with GET. - Requests to
/select/vmalert/*path ending with/configor/reloadnow require the-httpAuth.*credentials.
- Faster latest logs queries in cluster mode: Queries that return the newest N logs, which the web UI runs by default, now run on each
vlstoragenode instead of going back and forth throughvlselect. Cluster users get noticeably faster results on large time ranges. - Adds separate key for log deletion: The new
-deleteAuthKeyflag protects the/delete/*endpoints of the deletion API with their own key, independent of-httpAuth.*. - Wait time in slow query logs: Each slow query log line emitted according to
-search.logSlowQueryDurationnow includeswaitDuration. It shows whether a query waited in the queue for a free concurrency slot or was expensive to run, so you know whether to add capacity or improve the query. - Added slow query logs on vlstorage nodes:
-search.logSlowQueryDurationnow also applies to vlstorage nodes. In a cluster, you can see which storage node was slow, not only that the overall query was slow. - Added listener for Unix domain sockets: VictoriaLogs can now accept HTTP requests on a local socket with
-httpListenAddr=unix:/path/to/socket. Sidecars and reverse proxies on the same host can reach it without a TCP port, and file permissions control access. See the Unix domain socket docs. - New fsync latency panel: The single-node, cluster, and vlagent Grafana dashboards have a new
Fsync avg durationpanel in the Troubleshooting section. Slow disks that delay writes to storage show up there before they cause ingestion problems. - New compression ratio over time panel: The single-node and cluster dashboards now show how the compression ratio changes over time. You can see how changes such as a new stream field or log parsing at ingestion time affect disk usage.
- Logchef integration: You can now use Logchef as another UI to query and explore your VictoriaLogs data.
- Web UI Improvements
- Gradual loading of the hits chart: For slow queries, the web UI loads the hits chart step by step and shows a progress indicator. You can narrow the time range as soon as the first data appears instead of waiting for the whole query to finish.
- Better stream fields sidebar: The
Stream fieldssidebar now lets you search field names and values, sort by hits or names, and pick anAny valueoption. Selected items are pinned to the top. Finding the right stream in large setups is much quicker. - Quicker field actions: In an expanded log entry,
Excludeis now right next to field values, so narrowing down noisy logs takes fewer clicks. Stream fields are also visually marked, and include/exclude actions on them automatically use stream filters. - Field names in the Group view: Each value now has its field name in front of it (except
_msg), so rows with many fields are easier to read. - Back button on the hits chart: After you zoom or pan the hits chart, one click takes you back to the previous time range.
- Auto-refresh moved to the Execute button: The auto-refresh settings are now in the Execute button dropdown, next to the action they affect. This frees up space in the header.
- Custom favicon color: In the settings, you can pick a color for the browser tab icon. This makes it easy to tell prod, staging, and test tabs apart.
- Cleaner hits chart controls: The
Stackedtoggle is now hidden whenGroup byis set tonone, because it has no effect there.
VictoriaLogs v1.52.1: the first LTS release for VictoriaLogs
#
This is our first LTS release for VictoriaLogs, bringing Enterprise users 12 months of support.
- If you run v1.52.0, we recommend upgrading since that version could panic or drop logs with duplicate stream field names at ingestion, and panic when querying such logs written by earlier releases.
- The misspelled
vl_udp_reqests_totalmetric is renamed tovl_udp_requests_total. Update any dashboards or alerts that use the old name.
Here are the highlights:
- Safer log deletion: The
/delete/run_taskendpoint of the deletion API now accepts onlyPOSTrequests, which blocks some SSRF-based deletion attacks. The Go builder is also upgraded to Go 1.26.8 for upstream security fixes. - No more lost logs on vlinsert shutdown: In cluster mode,
vlinsertnow drains buffered logs tovlstoragenodes on graceful shutdown instead of dropping them. The new-insert.drainTimeoutflag (default5s) limits how long it waits. - Even load when storage nodes are down: Data rerouted away from unavailable
vlstoragenodes is now spread evenly across healthy nodes. Before, nodes next to the failed one in the-storageNodelist could get much more data than the others. - Canceled queries actually stop: When a query is canceled or times out on
vlselect, the matching work onvlstorageis now stopped too, instead of wasting CPU and disk I/O. - Correct ordering for “latest logs” queries: Queries such as
| sort by (_time desc) limit Nnow return correct results when other pipes rewrite_time(for examplemath,replace,extract, orunpack_json). Before, they could fail with amissing _time fielderror or return logs out of order. - vlagent file collection fixes: The File Collector no longer panics when a log file is deleted, and it no longer fails at startup when it can’t read neighboring files. It sets the
filefield correctly with-fileCollector.extraFields. Incomplete last lines are dropped with a warning instead of being joined to the first line of the rotated file.
VictoriaTraces 0.12.0 is out: A new built-in UI for trace exploration
#

This release introduces a new built-in UI (VTUI) for exploring traces. You can now find a trace, drill into its spans, and see what’s slowing down your application without any dependency on an external visualization platform.
Try it out yourself in the playground: https://play-vtraces.victoriametrics.com/select/vmui/
This release also ships 2 bug fixes and 2 security changes.
vmanomaly 1.30.7 is out: Jump from a firing alert to its anomaly results
#
Before a stateful upgrade or rollback, check the directional compatibility matrix and run --dryRun to preview how persisted model state and on-disk artifacts will be migrated.
- Go from a firing alert to its data: Add an investigation link to your vmalert rules to open persisted anomaly results in the UI, with the configured model, queries, and incident time range already selected.
- Simplified model choices in the UI: Use the
server.ui_allowed_modelsparameter to choose which models appear in the UI model selectors and Auto tuning targets. This only curates what the UI shows; it doesn’t restrict which models can be executed through the API. - Activity and AI usage at a glance: Revision 10 of the self-monitoring dashboard (Grafana ID 22337) adds successful-run counts, corrected queries, per-model views and AI Copilot usage by instance, including tokens and estimated cost. Missing telemetry is shown as Unknown, and cost estimates exclude unpriced responses and tool/server compute.
- Reduced reader overhead: The reader does less work when parsing datapoints, preparing columns, and loading single-chunk Parquet data.
- More accurate alert rules: Alert rules generated from the UI now use a strict anomaly score threshold (
> 1by default instead of>= 1), so a score exactly at the threshold no longer fires. Preset version suffixes are now preserved in metric selectors. - Updated documentation for AI-assisted investigations: MCP server v0.4.2 bundles the v1.30.7 documentation and adds guidance for investigating saved incident results with AI assistants.
vmanomaly 1.30.6 is out: Searchable server queries in the UI and experimental hardened images
#
- Find and manage server queries more easily: The bundled vmanomaly UI is updated from v1.9.0 to v1.9.1. The Server tab in the Queries sheet now offers a searchable list with model filters, model badges, and consistent actions for individual queries or selected queries. Selected queries stay selected even when the active filter hides them, and the UI help lists keyboard shortcuts.
- Try the experimental hardened image: Docker Hardened Images are now available under the
v1.30.6-dhiandv1.30.6-enterprise-dhitags on Docker Hub and Quay, for both amd64 and arm64. Both tags point to the same image, which ships with fewer OS packages and no runtime shell or package manager. Standard tags, includinglatest, keep their existing base image. Thanks to Zakhar and Andrew Chubatiuk for their contributions.
The hardened image runs as a non-root user and has no runtime shell or package manager. Before switching, check the permissions of mounted files (such as configs and license files) and make sure the container user can write to the state directory used for state restoration.
- More stable estimates for intermittent data: Univariate Temporal Envelope models no longer produce implausible current-time estimates on intermittent data, in both batch and streaming learning. In such cases, predictions fall back to the learned median when valid observations are available. Explicit future forecasts keep their extrapolation behavior, and the existing model state remains loadable.
- Consistent scheduling across containers: Periodic schedulers now consistently use their configured timezone (UTC by default) for interval triggers and for ISO
start_fromvalues without an offset. ISOstart_fromvalues with an explicit offset keep their exact instant, so schedules no longer depend on the container’s local timezone. - Updated documentation for AI-assisted investigations: The MCP server v0.4.1 now includes the v1.30.6 documentation, so AI assistants get up-to-date guidance when helping you configure and investigate vmanomaly.
vmanomaly 1.30.5 is out: Multivariate investigation and per-query business policies in the UI
#
Are you running per-query business settings on v1.30.2-v1.30.4 with settings.n_workers > 1? Please upgrade to this version or greater.
This release fixes how query-level data ranges, detection directions, and minimum deviations are applied in multiprocessing mode. Explicit query settings now consistently take precedence over model defaults.
Fixes per-query business settings in multiprocessing mode: Query-level
data_range,detection_direction,min_dev_from_expected, andmin_rel_dev_from_expectedare now applied consistently whensettings.n_workers> 1. Explicit query policies take precedence over model-level fallbacks, and observations outside the configured range keep their out-of-range anomaly score.Investigate related signals together: The bundled UI v1.9.0 adds an experimental multivariate investigation workspace for multivariate models. You can compare aligned signals, inspect individual channels, and see a joint anomaly score for each group, for example, CPU and memory grouped by service or instance.
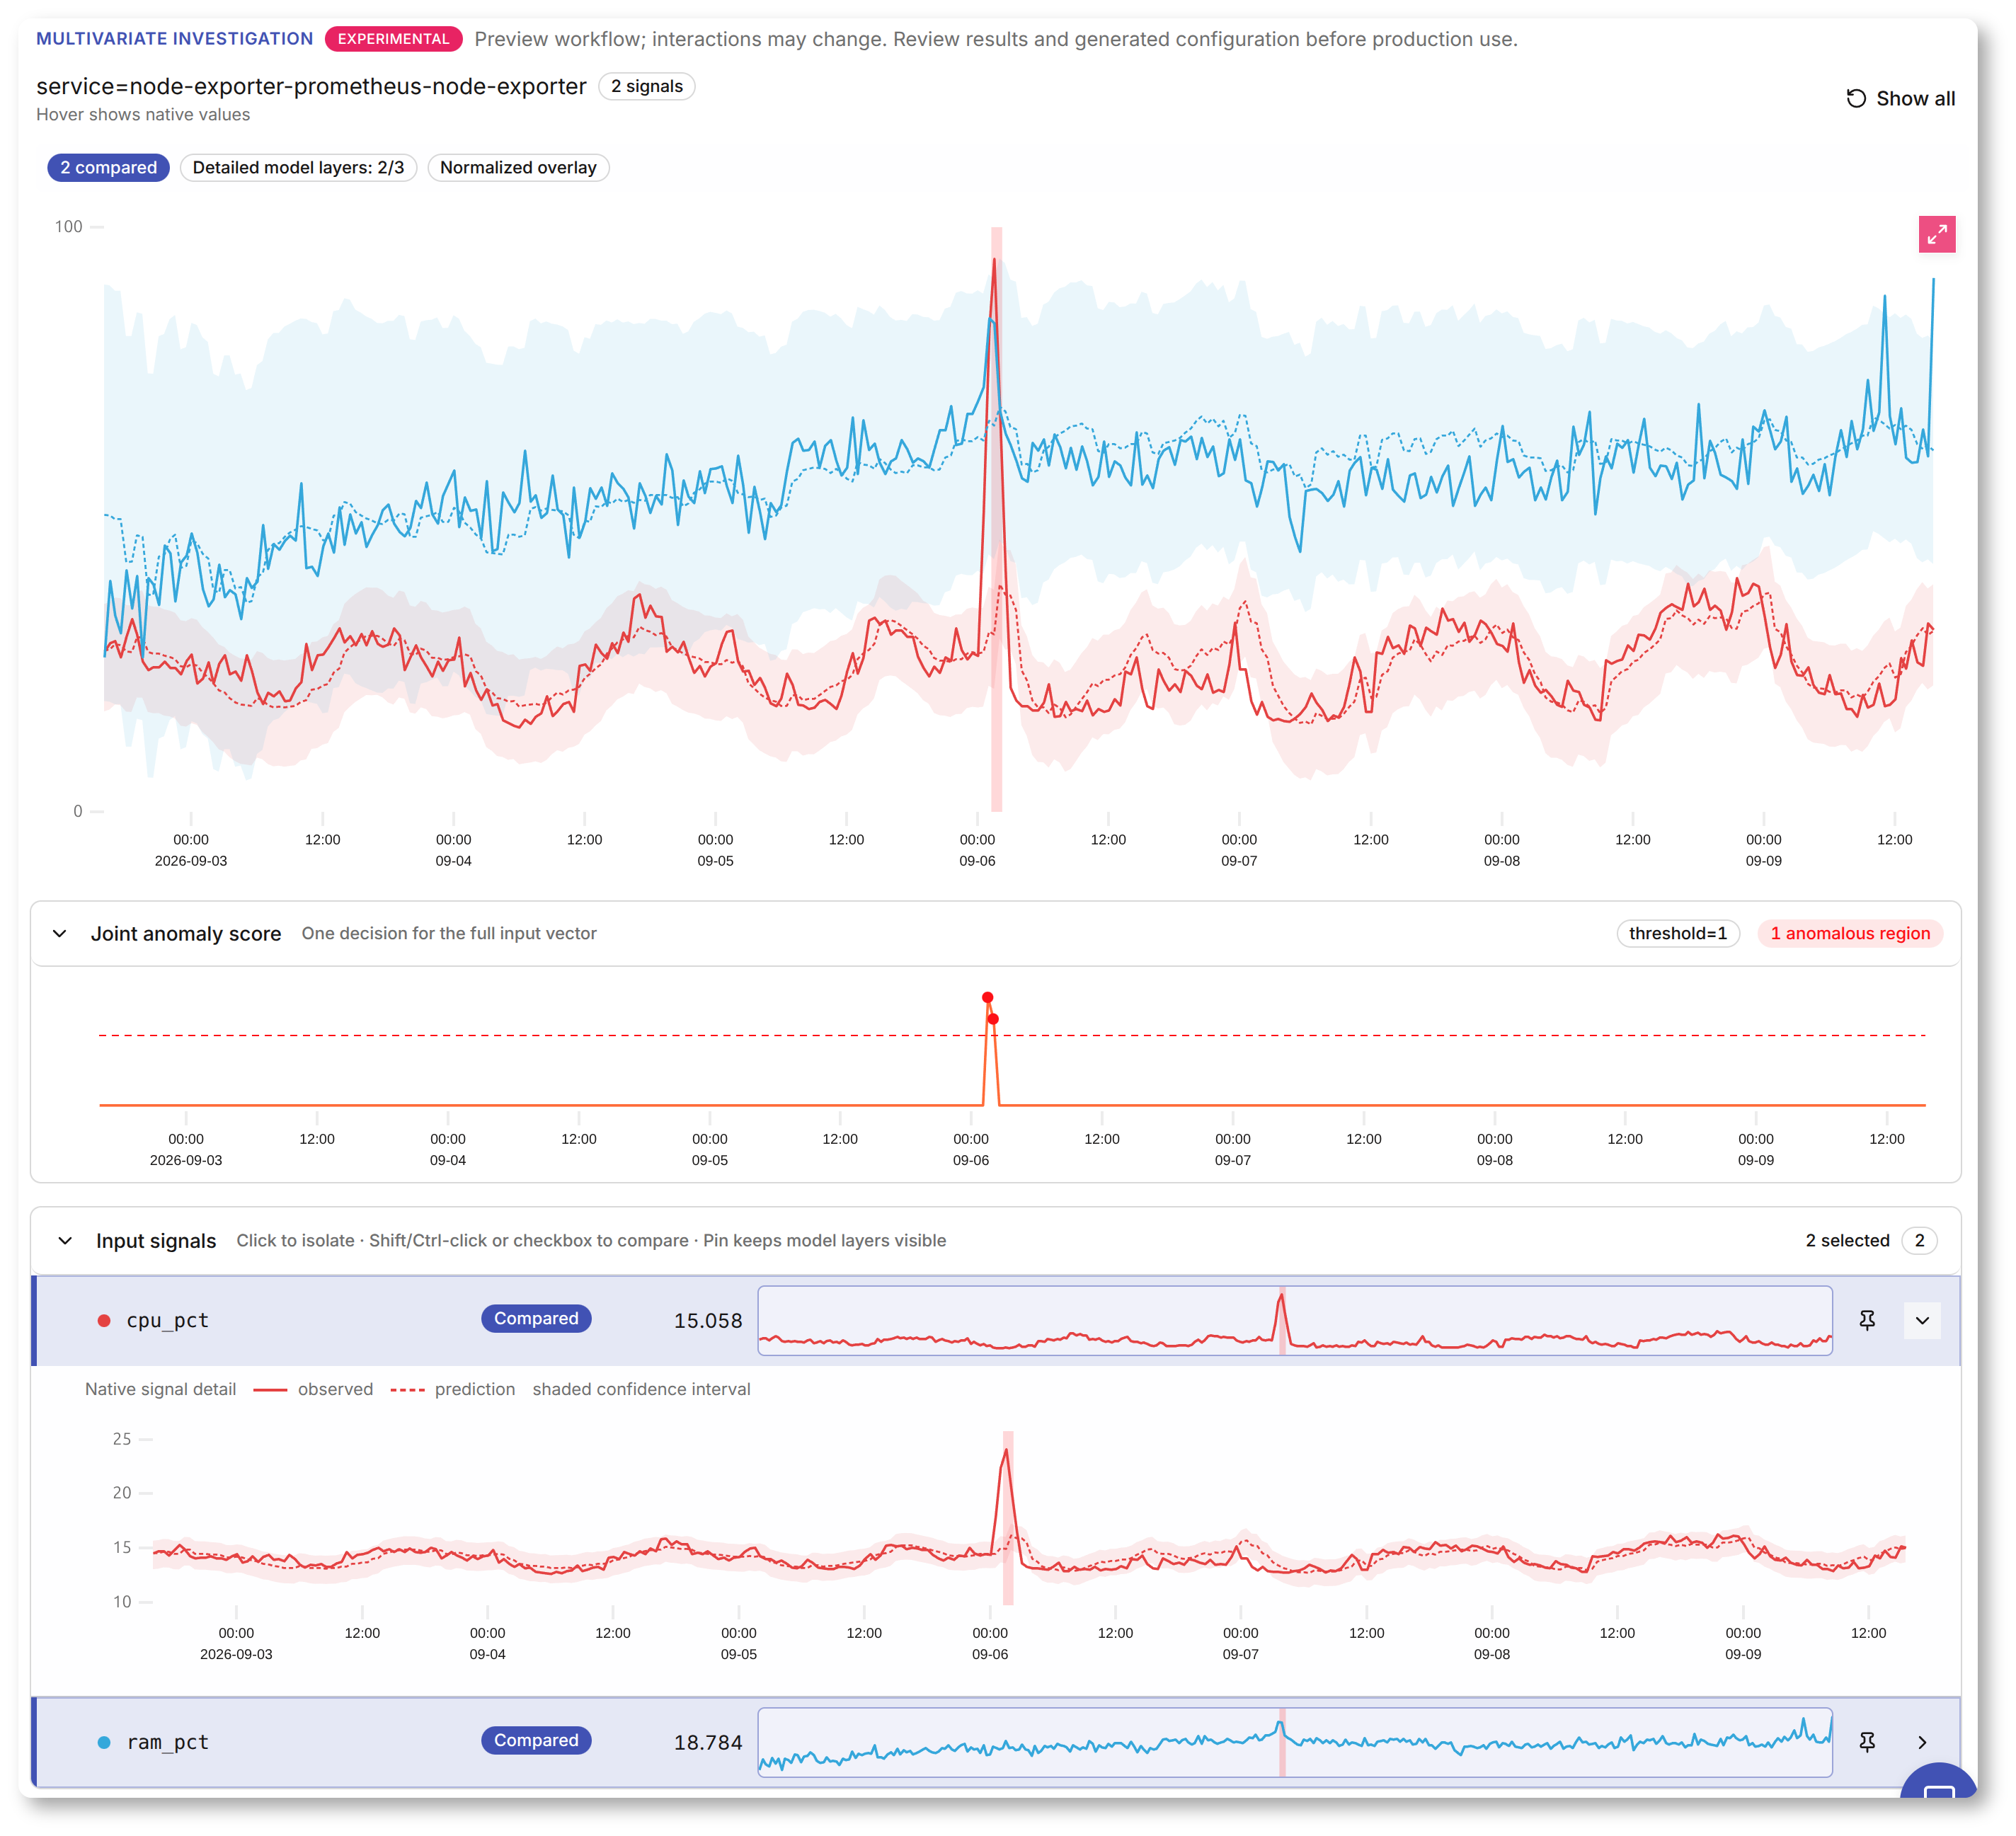
New multivariate investigation UI. Keep queries and business intent together: You can now name your queries, manage reusable query sets, and give each query its own data range, detection direction, and minimum deviations. Inheritance controls make it clear which values come from model defaults. See the query explorer docs, or try the new UX in the playgrounds.
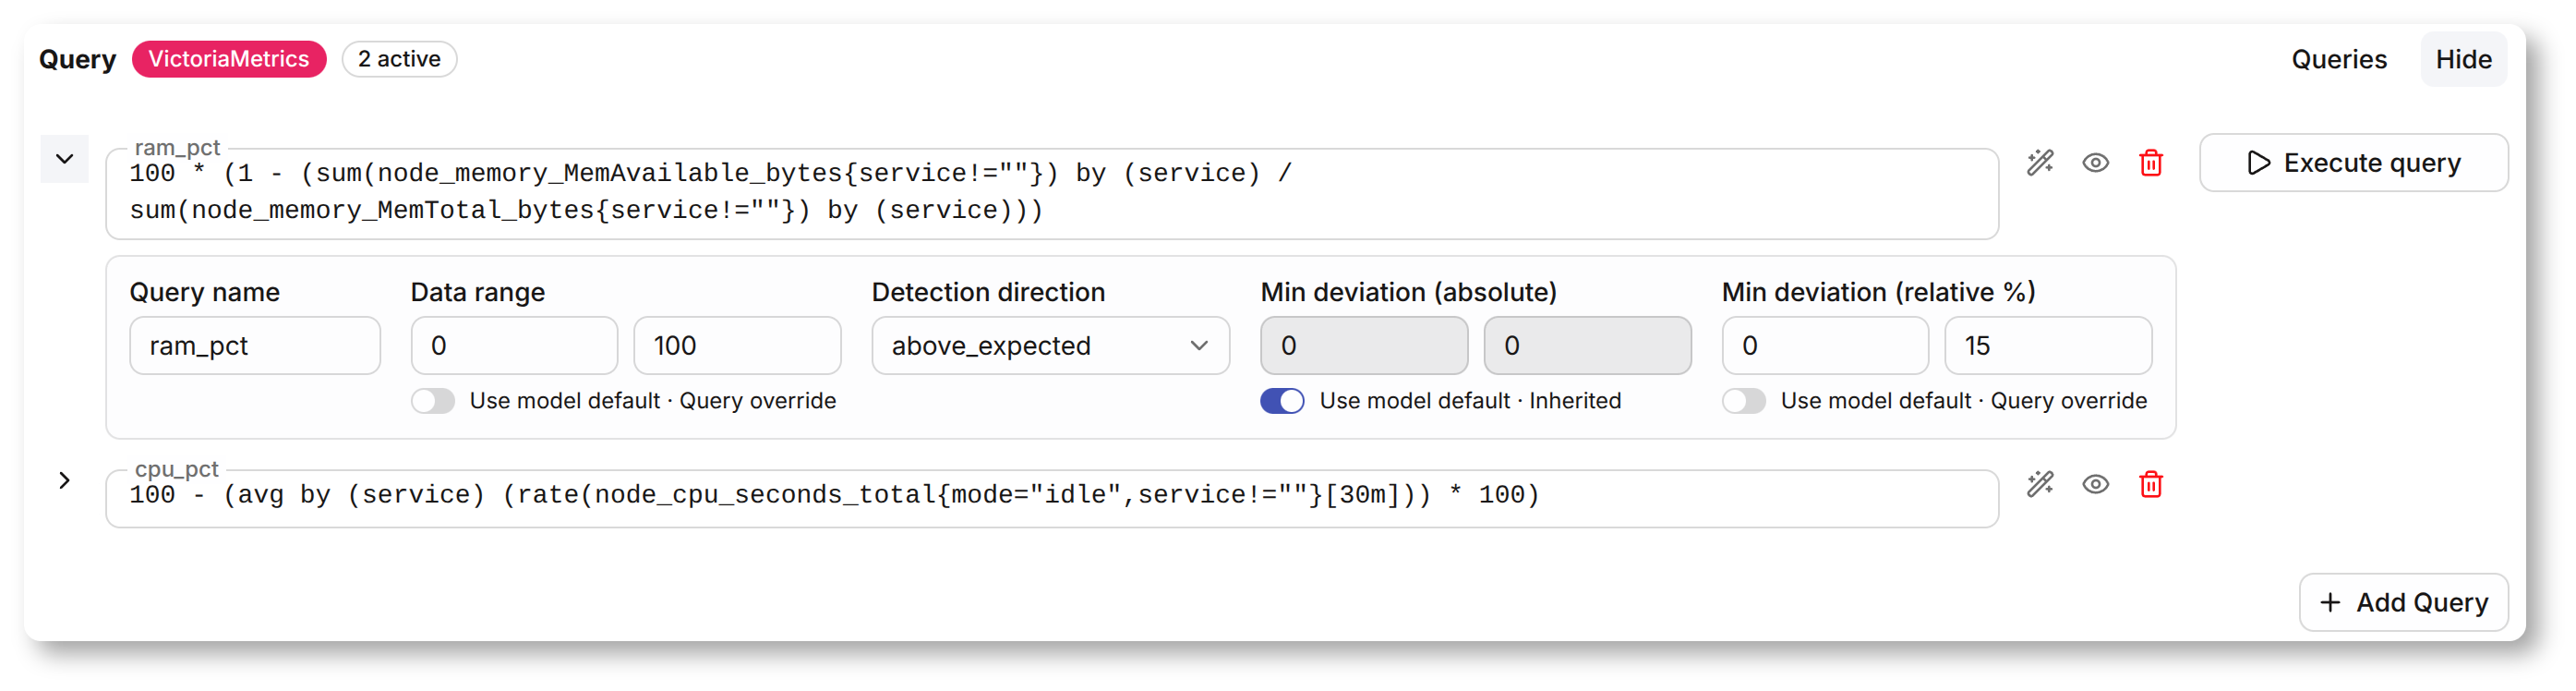
New UI for managing and saving queries. Reduce manual configuration with AI Copilot: AI Copilot can now propose complete named-query sets, along with their policies, for you to review and approve.
Shared autotune across queries: Shared autotune accepts named queries and evaluates multiple queries and aligned multivariate groups in a single study, returning one shared model configuration.
Improved visibility into AI usage: Copilot now shows reported tokens, the model used, and approximate costs where pricing is available. Duplicate context is reduced, context and output budgets are configurable, and new AI Copilot self-monitoring metrics track request size, reported tokens, finish reasons, and local budget refusals.
Ships with companion tooling updates: The vmanomaly MCP server v0.4.0 and the vmanomaly skills plugin v1.1.0 are released alongside this version.
Until next month
#
A busy month, but a good one: sharper tooling, faster queries, easier investigations, and traces now available in the cloud. We hope something in this update makes your observability setup a little smoother. Until next time.
Leave a comment below or Contact Us if you have any questions!
comments powered by Disqus
You might also like:
VictoriaMetrics 2026 Mid Year Roundup
Take a look at what we shipped in the first half of 2026 across VictoriaMetrics: metrics, logs, traces, and cloud,with improvements in performance, scalability, and usability.
VictoriaMetrics January 2026 Ecosystem Updates
January 2026 updates deliver quality of life improvements, performance optimizations, and tighter Kubernetes integration across the VictoriaMetrics Observability Stack.
Our latest updates across the VictoriaMetrics Observability ecosystem
The VictoriaMetrics ecosystem continues to evolve rapidly, and the latest updates bring meaningful improvements across metrics, logs, and traces. Read the announcement for details.