- Blog /
- GPU Observability with the OpenLIT Collector and the VictoriaMetrics observability stack
GPU Observability with the OpenLIT Collector and the VictoriaMetrics observability stack
Share:


This post is a joint effort by the OpenLIT and VictoriaMetrics teams. OpenLIT brings the OTel-native GPU collector for NVIDIA, AMD, and Intel hardware, while VictoriaMetrics provides the storage and query layer for the resulting metrics. We wrote it together to show how the two projects fit into a single, self-hosted observability pipeline, and to share the queries and rules that worked well for us along the way.
Most GPU monitoring tutorials do the same three things: install an NVIDIA Data Center GPU Manager (DCGM) exporter, scrape it with Prometheus, and draw a
temperature chart in Grafana. That tells you a GPU is hot. It does not tell you which CUDA kernel is hot, how many of
your cudaMalloc calls are wasted, or whether your $30k/month H100 fleet is actually doing work. This post wires the
OpenLIT OpenTelemetry GPU Collector into the
VictoriaMetrics observability stack and shows the MetricsQL queries and alerting rules that turn that telemetry into
decisions.
If you learn by doing, see the VictoriaMetrics/gpu-observability demo project that includes a docker-compose manifest for monitoring GPUs, alerting rules, and a Grafana dashboard.
This post is a companion to Observability for LLM Apps and Agents, which covers monitoring of LLMs and agents using VictoriaMetrics observability stack and OpenLIT.
The Problem: DCGM Tells You the GPU Is Hot, Not What It’s Doing
#
Most GPU monitoring blogs follow an identical template:
helm install dcgm-exporter- Point Prometheus at
:9400/metrics - Drag
DCGM_FI_DEV_GPU_TEMPinto Grafana - Set an alert at 85°C
- Ship it
But many of these posts tend to stop short of the questions that matter most when you are burning $30/hour per H100:
- Which CUDA kernel is responsible for the Streaming Multiprocessor (SM) utilization spike? DCGM cannot see kernels; it reads device counters, not the CUDA runtime.
- Are you wasting memory bandwidth with thousands of tiny
cudaMemcpycalls instead of a few large ones? - What does your AMD MI300X cluster look like in the same dashboard? DCGM is NVIDIA-only.
- How many kWh did training that model cost you? “Power draw in watts” is a gauge - without a recording rule converting it to a counter, you cannot say.
- Are your H100s idle 80% of the time? Every cost-optimization team wants to know, but it rarely converts to an alerting rule.
DCGM exporter is a solid NVML wrapper, but it inherits NVML’s limitations: hardware counters, NVIDIA only, no
CUDA-level introspection, and metric names (DCGM_FI_DEV_GPU_UTIL, DCGM_FI_PROF_SM_ACTIVE) that share no vocabulary
with the gen_ai.* traces OpenTelemetry collects from your LLM SDK. If you want to correlate “vLLM p99 latency spiked”
with “SM utilization dropped” you are doing it by hand.
The Fix: One OTel-Native Collector, Cross-Vendor, eBPF-Aware
#
The OpenLIT OpenTelemetry GPU Collector is a single Go binary that:
- Scans
/sys/bus/pci/devices/and routes each GPU to the right backend - NVIDIA via NVML, AMD via sysfs/hwmon, Intel via i915/Xe DRM. One tool, three vendors. - Emits metrics under the
OpenTelemetry semantic conventions for hardware -
hw.gpu.utilization,hw.gpu.power.draw,hw.gpu.energy.consumed- so they share labels and naming with the rest of your OTel stack. - Optionally enables eBPF CUDA tracing via uprobes on
libcudart.so:cudaLaunchKernel,cudaMalloc,cudaMemcpy. Turning kernel launches into histogram metrics keyed by kernel name. - Has no DCGM daemon, no Python, and no CUDA toolkit at runtime for the hardware-metric path. It is a static binary,
configured by
OTEL_*env vars.
You can run it with the following command:
docker run --gpus all \
  -e OTEL_SERVICE_NAME=gpu-fleet \
  -e OTEL_RESOURCE_ATTRIBUTES="deployment.environment=prod,team=ml-platform" \
  -e OTEL_EXPORTER_OTLP_ENDPOINT="http://otel-collector:4317" \
  -e OTEL_GPU_EBPF_ENABLED=true \
  --cap-add SYS_ADMIN --cap-add SYS_RESOURCE \
  ghcr.io/openlit/otel-gpu-collector:latest
This command will run the GPU exporter and direct its output to OpenTelemetry collector. The rest of this post is what you get when you point this stream at VictoriaMetrics.
Why VictoriaMetrics for GPU Telemetry
#
VictoriaMetrics is a good backend for this workload for a few concrete reasons:
| Concern | Why it matters for GPU metrics | VictoriaMetrics behavior |
|---|---|---|
| Cardinality | eBPF tracing emits one series per cuda.kernel.name. A training job can blow through 1k+ unique kernels. | Handles 10M+ active series on a single node, and scales further in cluster mode. Stream aggregation helps control cardinality while keeping the telemetry useful. |
| Retention | GPU telemetry often needs months of data to see utilization trends or regressions. | Commonly used as long-term storage thanks to strong compression and resource efficiency. |
| OTLP-native | Avoids an otelcol → remote_write → Prometheus shim. | Accepts OTLP/HTTP at /opentelemetry/v1/metrics directly. |
| Push-native | Historical telemetry or transformations. | No limits on backfill period or order, with retroactive evaluation for recording and alerting rules. |
The Stack
#
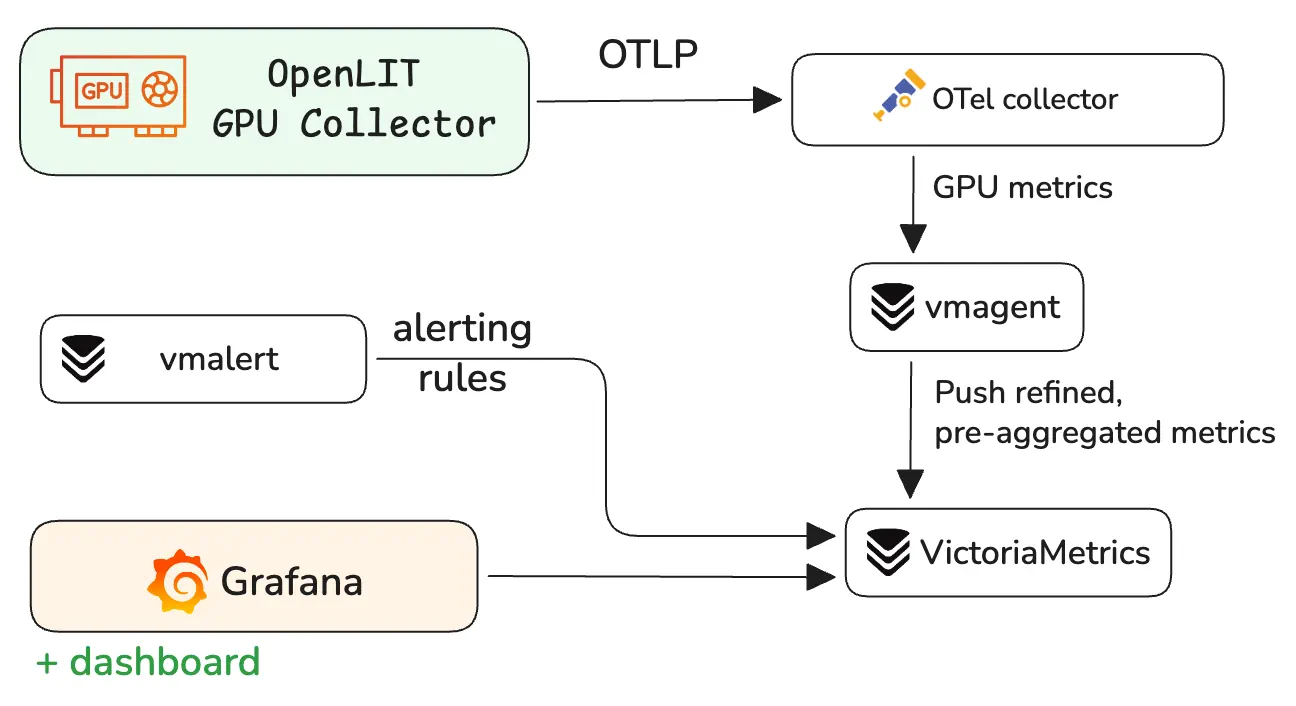
The demo project for this stack, including the full docker-compose file, configuration files, alerting rules and Grafana dashboard, is available on GitHub at VictoriaMetrics/gpu-observability:
services:
  # extract telemetry data from GPU devices
  otel-gpu-collector:
    image: ghcr.io/openlit/otel-gpu-collector:latest
    environment:
      OTEL_SERVICE_NAME: gpu-fleet
      OTEL_RESOURCE_ATTRIBUTES: "deployment.environment=prod,team=ml-platform"
      OTEL_EXPORTER_OTLP_ENDPOINT: "http://otelcol:4317"
      OTEL_GPU_EBPF_ENABLED: "true"
      OTEL_METRIC_EXPORT_INTERVAL: 10000
    cap_add: [ SYS_ADMIN, SYS_RESOURCE, BPF, PERFMON ]
    deploy:
      resources:
        reservations:
          devices:
            - { driver: nvidia, count: all, capabilities: [ gpu ] }

  # otel-gpu-collector => otelcol
  otelcol:
    image: otel/opentelemetry-collector-contrib:latest
    command: [ "--config=/etc/otelcol/config.yaml" ]
    volumes: [ "./otelcol.yaml:/etc/otelcol/config.yaml" ]
    ports: [ "4317:4317" ]

  # otelcol => vmagent
  # Optional, push directly to VictoriaMetrics if you don't need
  # metrics buffering or stream aggregation.
  vmagent:
    image: victoriametrics/vmagent:latest
    command:
      - "-opentelemetry.usePrometheusNaming" # convert OTel metric names to Prometheus-compatible names
      - "-remoteWrite.streamAggr.config=/etc/vm/aggr.yml" # apply stream aggregation
      - "-remoteWrite.url=http://victoriametrics:8428/api/v1/write" # forward to VictoriaMetrics
    volumes: [ "./stream-aggregation.yml:/etc/vm/aggr.yml" ]

  # vmagent => victoriametrics
  victoriametrics:
    image: victoriametrics/victoria-metrics:latest
    ports: [ "8428:8428" ]
    volumes: [ "vm-data:/victoria-metrics-data" ]

  # evaluates alerting and recording rules against victoriametrics
  vmalert:
    image: victoriametrics/vmalert:latest
    command:
      - "-datasource.url=http://victoriametrics:8428"
      - "-remoteWrite.url=http://victoriametrics:8428"
      - "-rule=/etc/vmalert/*.yml"
      - "-notifier.blackhole" # Replace "-notifier.blackhole" with an actual "-notifier.url=<alertmanager_url>"
    volumes: [ "./rules:/etc/vmalert" ]

  grafana:
    image: grafana/grafana:latest
    ports: [ "3000:3000" ]

volumes: { vm-data: { } }
That is the full stack. Bring it up on an instance with a GPU and metrics will land in VictoriaMetrics within seconds.
VictoriaMetrics/gpu-observability contains the full example with all config files like otelcol.yaml, stream-aggregation.yml, Grafana dashboard and alerting rules. See how to run it.
What You Get: Five Use Cases Beyond Device Counters
#
Please note, in the examples below we converted metric names to Prometheus-compatible names, so it is just easier to query
them. It is simply done by setting -opentelemetry.usePrometheusNaming on the VictoriaMetrics side
and it will automatically convert hw.gpu.power.draw to hw_gpu_power_draw_watts.
1. “Which CUDA kernel is eating my GPU?”
#
Set OTEL_GPU_EBPF_ENABLED=true and the collector will attach additional labels like cuda_kernel_name to collected metrics.
# Top-10 most frequently launched kernels across the fleet, by launch rate
topk(10,
  sum by (cuda_kernel_name) (
    rate(gpu_kernel_launch_calls_total[5m])
  )
)
For a vLLM deployment, you will see flash_attention_kernel, rms_norm_kernel, paged_attention_v2_kernel - the names
match the symbols compiled into your CUDA libraries.
2. “Is this model wasting GPU memory bandwidth?”
#
# Bytes moved per second by direction - host↔device traffic is the expensive kind
sum by (cuda_memcpy_kind) (
  rate(gpu_memory_copies_bytes_sum[5m])
)
cuda_memcpy_kind is one of HostToHost, HostToDevice, DeviceToHost, DeviceToDevice. A healthy training loop
pins data on the device and shows mostly DeviceToDevice. A pipeline thrashing the PCIe bus shows HostToDevice
dominating - a classic symptom of a dataloader that did not warm up pinned memory. The histogram of copy sizes
(gpu_memory_copies_bytes_bucket) tells you whether you have one big transfer or a thousand tiny ones;
the latter is almost always a bug.
3. “What is this GPU costing me in dollars, right now?”
#
GPUs are billed by the hour, but the value you extract is utilization:
# Dollars-per-hour wasted on idle SM time, per GPU
# Assumes an H100 at $2.80/hr; substitute your spot price.
(1 - avg_over_time(hw_gpu_utilization_ratio[1h])) * 2.80
Sum across the fleet:
# Total $/hr wasted, by team (from the team=… resource attribute)
sum by (team) (
  (1 - avg_over_time(hw_gpu_utilization_ratio[5m])) * 2.80
)
Plot that as a Grafana stat panel next to your GPU bill. It is the number that shows how much money is spent without doing useful work.
4. “How many kWh did this training run cost?”
#
hw_gpu_energy_consumed_joules_total is a counter in joules - the NVML nvmlDeviceGetTotalEnergyConsumption field,
exposed as an OTel Counter so it survives restarts cleanly. Convert it to kWh:
# kWh consumed in the last 24h, by host
sum by (host_name) (
  increase(hw_gpu_energy_consumed_joules_total[24h])
) / 3.6e6
Multiply by your data center’s $/kWh and you have a real sustainability number. Many blogs stop
at “here is power draw in watts.” A gauge of watts cannot tell you the total energy used. A counter of joules can.
5. “Is my hardware dying before warranty?”
#
ECC and PCIe replay errors are the canary. The collector emits them as hw_errors_total with error_type of
corrected,
uncorrected, or pcie_replay:
# Uncorrected ECC errors per hour - the "RMA this card" signal
sum by (hw_id, hw_name) (
  increase(hw_errors_total{error_type="uncorrected"}[1h])
)
A non-zero increase of uncorrected ECC errors is a card to take out of the pool. A rising rate of pcie_replay errors
on a
single PCI address means a flaky cable or slot.
Recording Rules and Alerts That Earn Their Keep
#
Generic “alert on GPU temp > 85” rules add little value. Modern data center cards thermal-throttle gracefully; the temperature alert fires after the SM clock has already dropped. The alerts below are the ones that map to either a cost decision or a hardware action.
See the example of alerting rules at rules/llm.yml:
groups:
  - name: gpu.recording
    interval: 30s
    rules:
      - record: team:gpu_utilization_ratio:avg5m
        expr: avg by (team, hw_name, gpu_index) (avg_over_time(hw_gpu_utilization_ratio[5m]))

  - name: gpu.alerts
    rules:
      - alert: GPUUnderutilized
        expr: team:gpu_utilization_ratio:avg5m < 0.10
        for: 1h
        labels: { severity: warning, category: cost }
        annotations:
          summary: "GPU {{ $labels.gpu_index }} for team {{ $labels.team }} is <10% utilized for 1h"

      - alert: GPUMemoryPressure
        expr: (hw_gpu_memory_usage_bytes / hw_gpu_memory_limit_bytes) > 0.95
        for: 5m
        labels: { severity: warning, category: capacity }

      - alert: GPUErrorRate
        expr: sum(rate(hw_errors_total[5m])) by (error_type) > 0
        for: 5m
        labels: { severity: critical, category: hardware }
        annotations:
          summary: "Non-zero error rate on {{ $labels.hw_id }} - {{ $labels.error_type }}"

      - alert: GPUKernelChurn
        expr: sum by (host_name) (rate(gpu_kernel_launch_calls_total[1m])) > 50000
        for: 10m
        labels: { severity: info, category: workload }
        annotations:
          summary: "{{ $labels.host_name }} >50k kernel launches/sec - check for kernel fusion opportunity"
The last one is the kind of alert that is only possible with eBPF. A workload that launches 50k kernels per second is
almost always one that should fuse them; the alert is a signal to send the ML engineers to look at torch.compile
settings.
Cardinality: The One Real Footgun
#
eBPF turns every CUDA kernel name into a label cuda_kernel_name. A PyTorch training job can produce hundreds of unique kernel
names per epoch, and with torch.compile generating bespoke kernels per shape, you can hit the thousands.
GPU exporter emits metrics
for total threads in grid/block per launch as histograms, and the number of buckets multiplies cardinality to even higher values.
Using stream aggregation we can reduce cardinality of these metrics
by aggregating cuda_kernel_name out:
# stream-aggregation.yml
- name: { __name__=~"gpu_kernel_grid_size_bucket|gpu_kernel_block_size_bucket" }
  match: '{cuda_kernel_name!=""}'
  interval: 1m
  without: [ cuda_kernel_name ]
  outputs: [ rate_sum ]
This aggregation rule will produce new gpu_kernel_grid_size_bucket:1m_without_cuda_kernel_name_rate_sum and
gpu_kernel_block_size_bucket:1m_without_cuda_kernel_name_rate_sum metrics without the cuda_kernel_name dimension,
but will correctly aggregate the buckets in a form suitable for calculating quantiles:
histogram_quantile(0.99, sum(gpu_kernel_grid_size_bucket:1m_without_cuda_kernel_name_rate_sum by(le))
The original metrics gpu_kernel_grid_size_bucket and gpu_kernel_block_size_bucket will be dropped, reducing the
total cardinality of the setup.
This is exactly what vmagent is used for in this stack. All metrics from the OpenTelemetry collector go through vmagent, get pre-aggregated and are pushed to VictoriaMetrics. However, this step is optional and if you don’t need to pre-aggregate metrics, simply push from OpenTelemetry directly to VictoriaMetrics.
How OpenLIT’s Collector Compares
#
| DCGM Exporter | nvidia-smi exporters | OpenLIT OTel GPU Collector | |
|---|---|---|---|
| NVIDIA hardware metrics | ✅ | ✅ (shell-out) | ✅ (NVML, no shell-out) |
| AMD hardware metrics | ❌ | ❌ | ✅ (sysfs/hwmon) |
| Intel hardware metrics | ❌ | ❌ | ✅ (i915/Xe + sysfs) |
| eBPF CUDA kernel tracing | ❌ | ❌ | ✅ (uprobes on libcudart.so) |
| Daemon dependency | nv-hostengine required | none | none |
| Python / CUDA toolkit at runtime | required | required | none |
| Host + process metrics in the same binary | ❌ | ❌ | ✅ (gopsutil) |
We built this because we kept running into the same wall ourselves - wanting to correlate gen_ai.completion.tokens
from an OpenLIT-instrumented LLM service with gpu.kernel.launch.calls from the same host, and discovering the two
metrics did not even share a label vocabulary. Is “vendor-neutral, OTel-native, eBPF-capable, single binary” overkill
for monitoring a homelab RTX 4090? Probably. Is it the right shape for a fleet of mixed H100s, MI300Xs, and Gaudi 3s?
We think so. What would you want to ask of your GPU fleet that the existing tutorials don’t address?
When to Use This Setup
#
- You run more than one GPU vendor. AMD’s device-metrics-exporter, Intel’s separate tooling, and DCGM exporter are three independent pipelines with three different metric schemas. One OTel-native collector collapses that.
- You instrument LLM apps with OpenTelemetry. GPU metrics under
hw.gpu.*join the same VictoriaMetrics database asgen_ai.*traces and metrics - same labels, same MetricsQL, same Grafana variable bindings. - You care about cost or sustainability. The
hw.gpu.energy.consumedcounter plus thehw.gpu.utilizationgauge is the minimum viable telemetry for both, and DCGM does not expose the OTel-shaped versions natively. - You want kernel-level visibility without rebuilding the world. eBPF uprobes attach to the standard CUDA runtime - no app changes, no recompilation, opt-in per host with one env var.
If you are running a single workstation with one consumer card and you just want a temperature chart, nvidia-smi and
a Grafana panel are fine. For everything past that, the gap between “hardware counters” and “what is my workload
actually doing” matters more than another temperature gauge.
Next Steps
#
- Check the demo project as an example
- Pull the collector:
docker pull ghcr.io/openlit/otel-gpu-collector:latest - Read the collector docs, including the eBPF section
- Browse the OTel hardware semantic conventions the metric names follow
- Read the companion post Observability for LLM Apps and Agents
FAQ
#
Does this replace DCGM exporter?
For most setups, yes. The OpenLIT collector covers the same NVML hardware surface DCGM exports - utilization, memory,
power, energy, clocks, ECC, PCIe replay - without the nv-hostengine dependency, and adds AMD, Intel, and eBPF on top.
If you depend on a DCGM-specific profiling metric (DCGM_FI_PROF_PIPE_TENSOR_ACTIVE and friends), keep DCGM around for
those - the two can run side by side.
Will eBPF tracing slow down my training job?
eBPF uprobes add roughly 1-2µs per traced CUDA call. For training workloads launching kernels at <10k/sec, that is well
under 1% overhead. For inference workloads at higher launch rates, profile before leaving it on in production. The
toggle is one env var (OTEL_GPU_EBPF_ENABLED).
Does this work on Kubernetes?
Yes - deploy the collector as a DaemonSet with the NVIDIA device plugin (or AMD/Intel equivalents) and mount /sys
read-only. For eBPF, the pod needs CAP_BPF + CAP_PERFMON (or privileged: true on older kernels). The OTel resource
attributes pick up k8s.node.name, k8s.pod.name, and so on automatically when you set
OTEL_RESOURCE_ATTRIBUTES_FROM=k8s.*.
Why VictoriaMetrics over Prometheus? Prometheus works fine. VictoriaMetrics has more cardinality headroom (an honest concern once eBPF is on), native OTLP ingest, and stream aggregation for label management - all useful for GPU-fleet-scale workloads. Use whichever your platform team already runs.
Does the collector work without GPUs? Yes. On a GPU-less host, it still exports CPU, memory, disk, filesystem, and network metrics via gopsutil. GPU discovery retries every 30 seconds, so adding a card later does not require a restart.
Leave a comment below or Contact Us if you have any questions!
comments powered by Disqus
You might also like:
Observability for LLM Apps and Agents: OpenLIT SDK + VictoriaMetrics observability stack
See practical examples on monitoring LLM applications and Agents with OpenLIT and VictoriaMetrics observability stack. See real examples of the deployment manifests, alerting rules and Grafana dashboard.
Vibe coding tools observability with VictoriaMetrics Stack and OpenTelemetry
Learn how to add observability to Vibe Coding Tools using OpenTelemetry and the VictoriaMetrics Stack. This guide explains how to configure popular vibe coding tools to export their metrics telemetry and get insights about your vibe coding sessions.
AI Agents Observability with OpenTelemetry and the VictoriaMetrics Stack
Learn how to add observability to AI agents using OpenTelemetry and the VictoriaMetrics Stack. This guide explains how to instrument popular LLM frameworks and visualize metrics, logs, and traces in Grafana.