- Blog /
- Observability for LLM Apps and Agents: OpenLIT SDK + VictoriaMetrics observability stack
Observability for LLM Apps and Agents: OpenLIT SDK + VictoriaMetrics observability stack
Share:


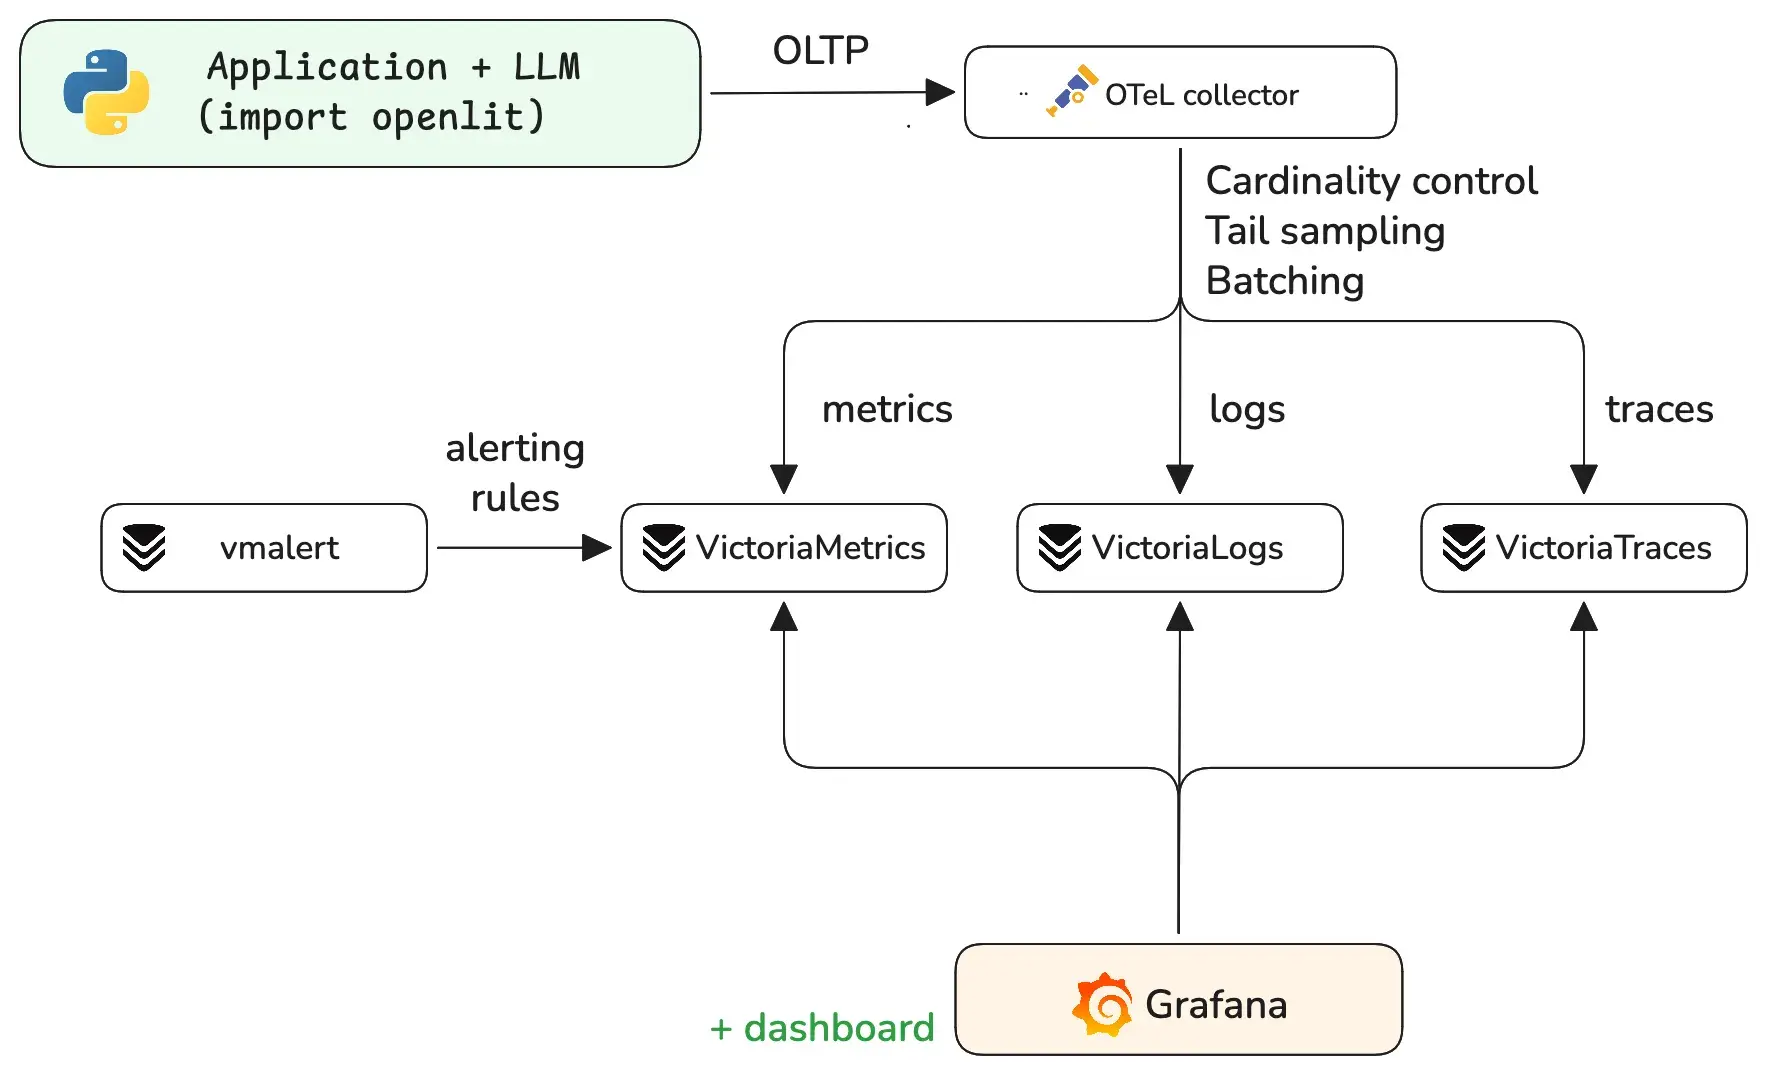
This post is a joint effort by the OpenLIT and VictoriaMetrics teams. OpenLIT brings the OTel-native instrumentation for LLMs and agents, while VictoriaMetrics provides the storage and query layer for the resulting metrics, traces, and logs. We wrote it together to show how the two projects fit into a single, self-hosted observability pipeline, and to share the patterns and queries that worked well for us along the way.
Many “LLM observability with OpenTelemetry” tutorials stop at a single chat.completions span. That works for a
demo, but it leaves gaps once an agent fans out into 30 tool calls, two vector-DB queries, three handoffs, and a
90-second tail latency you need to attribute. This post wires the OpenLIT SDK (50+ instrumentations, OTel GenAI
semantic conventions, one line of code) into the full VictoriaMetrics observability stack and shows query examples
that turn agent telemetry into decisions. The whole pipeline is self-hosted and vendor-neutral: one trace from “user
typed a question” to “GPU SM utilization” and back.
If you learn by doing, see the VictoriaMetrics/ai-observability demo project that includes a docker-compose manifest for monitoring an LLM application, alerting rules, and a Grafana dashboard.
The Problem: Most LLM Observability Posts Stop at One Chat Call
#
Search “LLM observability OpenTelemetry” and you get a familiar set of posts:
- OTel blog: An Introduction to Observability for LLM-based applications - one OpenAI call to Jaeger.
- Grafana Labs: A complete guide to LLM observability with OTel and Grafana Cloud - OpenLIT + Grafana Cloud, single-call shape.
- SigNoz: LangChain Observability with OpenTelemetry - a trip-planner demo, one agent, no alerting.
The closest neighbor to what we are about to build is the VictoriaMetrics team’s own post - AI Agents Observability with OpenTelemetry and the VictoriaMetrics Stack. It shows how to instrument applications using OpenLIT, OpenLLMetry, and OpenInference, and covers an OpenAI-based example application.
What most of these posts leave out:
- A real agent trace with fan-out, tool calls, handoffs, and recursion - not a single
chat.completionsspan. - OTel GenAI semantic conventions explained as queries you can run -
invoke_workflow,invoke_agent, andexecute_toolactually mapped to alerts. - One trace that spans application code → LLM provider → vector DB → vLLM on a GPU host. Many setups treat these as four separate dashboards you check side by side.
- alerting rules for the things that actually break in production: cost runaway, recursion, rate-limit storms, agent infinite loops, and eval-score regressions.
- A fully self-hosted, OSS, vendor-neutral pipeline that keeps the data plane on infrastructure you control. Hosted options like Langfuse, Helicone, Arize, Datadog, and LangSmith each route some telemetry through their own services.
We’re here to fill those gaps.
The Stack
#
Three things to call out before the code:
- All three storage tiers are OTLP-native.
VictoriaMetrics,
VictoriaTraces, and
VictoriaLogs all accept OTLP/HTTP at
/opentelemetry/v1/{metrics,traces,logs}. One collector pipeline, three exporters, zero translation shims. - OpenLIT is OTel-native, not a wrapper. It emits the official
gen_ai.*semantic conventions plus a few vendor extensions for things the spec hasn’t standardized yet (such as cost in USD). - The entire stack runs self-hosted, without relying on a cloud account, external proxy, or SaaS data plane.
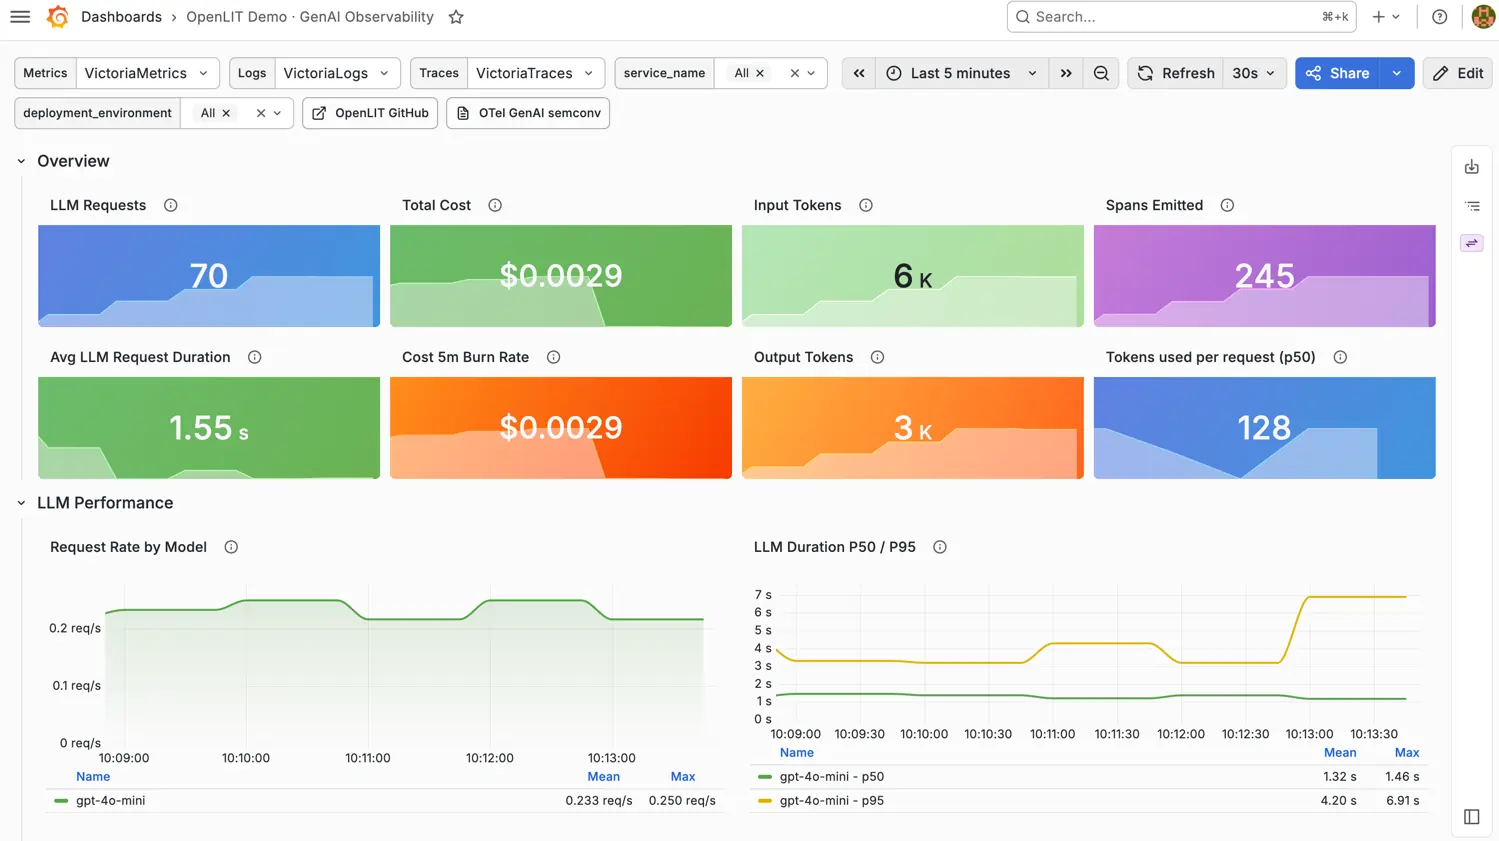
You can find a ready-to-run example of the whole stack, together with a Grafana dashboard that visualizes the core signals at VictoriaMetrics/ai-observability. Follow the Quick Start to get started.
Instrumenting App in One Line
#
OpenLIT’s SDK auto-instruments over 50 libraries - LLM providers (OpenAI, Anthropic, Bedrock, Vertex AI, Mistral, Cohere, Groq, Together, vLLM, Ollama), agent frameworks (LangGraph, CrewAI, AG2, Agno, Pydantic AI, OpenAI Agents SDK, Claude Agent SDK, Strands, Smolagents, Google ADK, Letta, AutoGen via AG2), vector DBs (Pinecone, Chroma, Qdrant, Milvus, Astra), browser/MCP tooling (browser_use, Crawl4AI, Firecrawl, MCP), and GPU/inference (vLLM, Transformers).
Python:
import openlit

openlit.init(
    otlp_endpoint="http://otelcol:4318",
    application_name="openlit_demo",
    environment="prod",
    capture_message_content=True,
)
TypeScript:
import Openlit from "openlit";

Openlit.init({
    otlpEndpoint: "http://otelcol:4318",
    applicationName: "demo",
    environment: "prod",
});
Now run your existing CrewAI / LangGraph / OpenAI Agents code unchanged. Every LLM call, tool invocation, vector lookup, and agent handoff lands in the pipeline tagged with OTel GenAI attributes.
See an example of a Python application instrumented with the OpenLIT SDK.
What “One Line” Actually Buys You
#
A single OpenLIT-instrumented agent run produces a trace tree shaped like below (the operation names match the OTel GenAI agent semconv):
invoke_workflow      crew_kickoff                                  18.4s   $0.42
├── invoke_agent     researcher_agent.execute_task                  9.1s   $0.21
│   ├── chat          openai gpt-4o                                 2.3s   $0.04
│   ├── execute_tool  pinecone.query  (k=10)                        0.18s
│   ├── execute_tool  firecrawl.scrape                              1.4s
│   ├── chat          openai gpt-4o                                 4.8s   $0.16
│   └── execute_tool  python_repl                                   0.3s
├── invoke_agent     critic_agent.execute_task                      4.2s   $0.13
│   └── chat          anthropic claude-3-5-sonnet                   4.1s   $0.13
└── invoke_agent     writer_agent.execute_task                      5.1s   $0.08
    └── chat          openai gpt-4o-mini                            4.9s   $0.08
Every span carries:
gen_ai.operation.name:{invoke_workflow, invoke_agent, execute_tool, chat, embeddings, vectordb, retrieval, create_agent}gen_ai.provider.name,gen_ai.request.model,gen_ai.response.modelgen_ai.usage.input_tokens,gen_ai.usage.output_tokens,gen_ai.usage.cache_read.input_tokensgen_ai.tool.name,gen_ai.tool.call.idgen_ai.agent.name,gen_ai.workflow.name,gen_ai.conversation.idgen_ai.usage.cost(OpenLIT extension, in USD) - derived from a pricing table the SDK fetches at init timeerror.type:{rate_limited, timeout, authentication, server_error, ...}on failures
Five Use Cases Worth Setting Up
#
Please note, it is recommended converting metric names to Prometheus-compatible names, so it is just easier to query
them. In this example, it is simply done by setting -opentelemetry.usePrometheusNaming on the VictoriaMetrics side
and it will automatically convert gen_ai.usage.cost to gen_ai_usage_cost_USD_sum.
1. Which team is burning my OpenAI budget right now?
#
OpenLIT emits a cumulative cost counter gen_ai_usage_cost_USD_sum sliced by provider, model, and attached resource
attributes (team, service.name). Convert it to dollars-per-hour:
# Live $/hr per team
sum by (team) (
  increase(gen_ai_usage_cost_USD_sum[1h])
)

# Same number, sliced by provider and model
sum by (gen_ai_provider_name, gen_ai_request_model) (
  increase(gen_ai_usage_cost_USD_sum[1h])
)
Set
OTEL_RESOURCE_ATTRIBUTES="team=<team_name>"at process start to attachteamlabel to emitted telemetry
2. Is my agent in an infinite loop?
#
One of the most common production failure modes in agentic systems is recursion - a planner that keeps calling the same tool because the tool’s response confuses it. Track it with the number of operations executed per minute:
# Tool calls per minute - anything > 100 is suspicious
increase(
  gen_ai_client_operation_duration_seconds_count[1m]
)
3. Which tool keeps failing and dragging my p99 with it?
#
Tool reliability is the dark matter of agent latency. A 2% tool error rate compounds across 10 tool calls into a much larger workflow failure rate.
OpenLIT captures tool executions as execute_tool spans with attributes such as gen_ai.tool.name, duration, and error
status. In VictoriaTraces, you can group and filter these spans to identify:
- tools with the highest error rates
- tools contributing the most latency
- workflows that repeatedly fail on the same tool
Traces can be converted to metrics or fire alerts via the integration of VictoriaTraces with vmalert. For example, the following vmalert recording rule generates metrics for p50 and p99 latency of tool calls:
- record: tool:call_duration_seconds:record
  expr: '`span_attr:gen_ai.tool.name`: != "" | stats by(`span_attr:gen_ai.tool.name`) quantile(0.5, duration) p50, quantile(0.99, duration) p99'
4. Is my prompt cache actually working?
#
Anthropic and OpenAI prompt caching can cut costs by 50-90%. Many teams enable it once, then never check whether it is
hitting. OpenLIT propagates gen_ai.usage.cache_read.input_tokens from the provider response:
# Cache hit rate as a fraction of input tokens
sum(rate(gen_ai_client_token_usage_sum{gen_ai_token_type="cache_read"}[5m]))
/
sum(rate(gen_ai_client_token_usage_sum{gen_ai_token_type="input"}[5m]))
A drop from 0.8 to 0.2 overnight usually means somebody changed the system prompt and broke the cache prefix. That is a real production alert.
5. Did our model regression actually ship?
#
OpenLIT’s evals module runs server-side hallucination, toxicity, and bias scoring through the OpenLIT platform. With
collect_metrics=True, the instrumented app can also export those scores as OpenTelemetry metrics.
# 7-day average hallucination score, per model
avg_over_time(
  gen_ai_evaluation_score{evaluator="hallucination"}[7d]
)
When the average for claude-3-5-sonnet doubles in a day, something in the upstream model changed, or your retrieval
started returning garbage. Either way, you want to know before the support tickets arrive. Grafana Cloud’s hosted
AI Observability is one
of the few tools that treats eval scores as a first-class metric today, and it is a SaaS offering. The OpenLIT +
VictoriaMetrics setup gives you a self-hosted equivalent.
Alerting Rules That Earn Their Keep
#
Generic “alert when latency > 1s” rules don’t fit LLM workloads well, since latency varies widely with prompt length. The rules below map to actions you can actually take.
See the example of alerting rules at rules/llm.yml:
groups:
  - name: ai-health
    interval: 30s
    rules:
      - record: team:ai_usage_cost:1h
        expr: sum by (team) (increase(gen_ai_usage_cost_USD_sum[1h]))

      - alert: LLMCostRunaway
        expr: team:ai_usage_cost:1h > 100   # $100/hr, set per-team
        labels: { severity: critical, category: cost }
        annotations:
          summary: "Team {{ $labels.team }} burning ${{ $value | printf \"%.0f\" }}/hr"

      - alert: ProviderErrorSpike
        expr: |
          sum by (gen_ai_provider_name) (
            rate(gen_ai_client_operation_duration_seconds_count{error_type!=""}[5m])
          )
          /
          sum by (gen_ai_provider_name) (
            rate(gen_ai_client_operation_duration_seconds_count[5m])
          ) > 0.05
        for: 5m
        labels: { severity: warning, category: provider }

      - alert: RateLimitStorm
        expr: |
          sum by (gen_ai_provider_name) (
            rate(gen_ai_client_operation_duration_seconds_count{error_type="rate_limited"}[1m])
          ) > 10
        for: 2m

      - alert: TTFTRegression
        expr: |
          histogram_quantile(0.95, sum by (le, gen_ai_provider_name) (
            rate(gen_ai_server_time_to_first_token_seconds_bucket[10m])))
          /
          histogram_quantile(0.95, sum by (le, gen_ai_provider_name) (
            rate(gen_ai_server_time_to_first_token_seconds_bucket[10m] offset 1w)))
          > 1.5
        for: 30m
        annotations:
          summary: "{{ $labels.gen_ai_provider_name }} p95 TTFT 50%+ slower than last week"

  - name: agents
    rules:
      - alert: AgentInfiniteLoop
        expr: |
          sum by (gen_ai_workflow_name) (
            rate(gen_ai_client_operation_duration_seconds_count[5m])
          ) > 100
        for: 5m
        labels: { severity: warning, category: agent }
        annotations:
          summary: "Workflow {{ $labels.gen_ai_workflow_name }} >100 tool calls/sec - likely recursion"

      - alert: CacheHitRateDropped
        expr: |
          (sum(rate(gen_ai_client_token_usage_sum{gen_ai_token_type="cache_read"}[15m]))
           / sum(rate(gen_ai_client_token_usage_sum{gen_ai_token_type="input"}[15m])))
          < 0.3
        for: 30m
        labels: { severity: info, category: cost }

      - alert: HallucinationRateClimbing
        expr: |
          avg_over_time(gen_ai_evaluation_score{evaluator="hallucination"}[1h])
          >
          avg_over_time(gen_ai_evaluation_score{evaluator="hallucination"}[7d] offset 1d) * 1.5
        for: 1h
Several of these alerts are hard to reproduce on hosted LLM observability tools, which often don’t expose the underlying metric API or meter it separately.
Cardinality: The Conversation-ID Footgun
#
The single biggest mistake in LLM observability setups is putting gen_ai.conversation.id, gen_ai.response.id,
user.id, or gen_ai.tool.call.id on metrics labels. With 1M conversations a day, every one becomes a new time
series.
The rule:
- Metrics labels: bounded vocabulary only -
provider,model,operation,agent_name,workflow_name,tool_name,team,service,error_type. These have small, fixed sets of values. - Span attributes/log fields: everything high-cardinality lives here. You query traces by
conversation.idin VictoriaTraces, not by scanning metric series.
Scrub high-cardinality keys from the metrics pipeline at the collector layer. See the example of OpenTelemetry Collector configuration at otelcol.yaml:
processors:
  attributes/metrics:
    actions:
      - { key: gen_ai.conversation.id, action: delete }
      - { key: gen_ai.response.id,     action: delete }
      - { key: gen_ai.tool.call.id,    action: delete }
      - { key: user.id,                action: delete }

  tail_sampling:
    decision_wait: 30s
    policies:
      - { name: errors,        type: status_code,        status_code: { status_codes: [ ERROR ] } }
      - { name: expensive,     type: numeric_attribute,  numeric_attribute: { key: gen_ai.usage.cost, min_value: 0.1, max_value: 1000000 } }
      - { name: slow-runs,     type: latency,            latency: { threshold_ms: 10000 } }
      - { name: cheap-sample,  type: probabilistic,      probabilistic: { sampling_percentage: 5 } }

  batch:
    send_batch_size: 10000
    timeout: 10s

exporters:
  otlp_http/vm-metrics: { metrics_endpoint: http://victoriametrics:8428/opentelemetry/v1/metrics }
  otlp_http/vm-logs: { logs_endpoint: http://victorialogs:9428/insert/opentelemetry/v1/logs }
  otlp_http/vm-traces: { traces_endpoint: http://victoriatraces:10428/insert/opentelemetry/v1/traces }

service:
  pipelines:
    metrics: { receivers: [ otlp ], processors: [ attributes/metrics, batch ], exporters: [ otlp_http/vm-metrics ] }
    logs: { receivers: [ otlp ], processors: [ batch ],                     exporters: [ otlp_http/vm-logs ] }
    traces: { receivers: [ otlp ], processors: [ tail_sampling, batch ],      exporters: [ otlp_http/vm-traces ] }
The tail-sampling policy keeps 100% of expensive runs, 100% of slow runs (>10s), 100% of errored runs, and 5% of cheap chat completions. For a typical agent workload that drops trace volume by 80-95% while keeping every interesting trace.
Run the Full Stack with one command
#
The whole observability stack is easy to run with a single docker compose file:
services:
  otelcol:
    image: otel/opentelemetry-collector-contrib:latest
    command: [ "--config=/etc/otelcol/config.yaml" ]
    volumes: [ "./otelcol.yaml:/etc/otelcol/config.yaml" ]
    ports: [ "4318:4318" ]

  victoriametrics:
    image: victoriametrics/victoria-metrics:latest
    command: [ "-opentelemetry.usePrometheusNaming", "-vmalert.proxyURL=http://vmalert:8880" ]
    ports: [ "8428:8428" ]
    volumes: [ "vm-data:/victoria-metrics-data" ]

  victoriatraces:
    image: victoriametrics/victoria-traces:latest
    ports: [ "10428:10428" ]
    volumes: [ "vt-data:/victoria-traces-data" ]

  victorialogs:
    image: victoriametrics/victoria-logs:latest
    ports: [ "9428:9428" ]
    volumes: [ "vl-data:/victoria-logs-data" ]

  grafana:
    image: grafana/grafana:latest
    ports: [ "3000:3000" ]
    environment:
      - GF_INSTALL_PLUGINS=victoriametrics-logs-datasource
    volumes:
      - grafanadata:/var/lib/grafana

volumes: { vm-data: { }, vt-data: { }, vl-data: { }, grafanadata: { } }
Once up, this stack is ready to accept metrics, logs and traces via otelcol, and visualize them in Grafana (admin:admin).
VictoriaMetrics/ai-observability also contains Grafana dashboard, alerting rules and a Python application to generate telemetry via OpenLIT SDK. See how to run it.
How OpenLIT + VictoriaMetrics Compares to Hosted Tools
#
| Langfuse | Helicone | Arize Phoenix | Datadog LLM Obs | OpenLIT + VictoriaMetrics | |
|---|---|---|---|---|---|
| OTel-native ingest | ✅ (compat) | ❌ (proxy) | ✅ (OpenInference) | ❌ (proprietary SDK) | ✅ (GenAI semconv) |
| Self-hostable | ✅ open-core | ❌ SaaS only | ✅ | ❌ | ✅ fully OSS |
| Agent framework coverage | LangChain-heavy | Limited | OpenInference set | Growing | 50+ incl. CrewAI, LangGraph, OpenAI Agents, Pydantic AI, Claude Agent SDK, Strands, Agno, Letta, MCP |
| Traces + Metrics + Logs in one stack | Separate UI | ❌ | ❌ | ✅ ($$$) | ✅ (VictoriaMetrics + VictoriaTraces + VictoriaLogs) |
| Query language MetricsQL/PromQL | ❌ (own DSL) | ❌ | ❌ | Datadog DSL | ✅ |
| Cost model | $0-$249/mo + scale | $0-$79/mo + scale | OSS + paid AX | $$$ enterprise | OSS, your infra |
| Data leaves your network | Optional | Always | Optional | Always | Never |
OpenLIT is built this way because every team we talked to was already running an OTel collector and a Prometheus-compatible TSDB. Why install a parallel agent and a parallel UI for the LLM data when a single line of code can land it in the system you already operate? Is the OTel-native, bring-your-own-backend approach the right tradeoff for a 3-engineer startup that just needs a hosted dashboard? Probably not. Langfuse Cloud’s free tier is a good fit there. Is it the right tradeoff for a regulated enterprise that cannot send prompts to a third-party SaaS, or for a platform team running 200+ services on shared infra? We think so. What would you want from your agent observability that hosted tools don’t surface today?
When to Reach for This Setup
#
- You already run an OTel collector. Adding
openlit.init()is essentially free; adding a SaaS proxy is a procurement cycle. - You operate multi-agent or multi-framework apps. For CrewAI + LangGraph + Pydantic AI + MCP tools, the OTel GenAI semconv is the schema that reconciles them, and OpenLIT speaks it natively.
- You care about cost attribution. Per-team, per-tenant, per-agent, per-tool, and per-model dollar accounting requires a TSDB you control. Most hosted LLM tools show you cost in their UI; fewer let you alert on it.
- You correlate LLM with infrastructure. Pair this with the OpenLIT GPU collector and a single trace spans your app, your vLLM endpoint, and your H100’s SM utilization.
- You want eval signals as alerts. Hallucination, toxicity, and bias scores piped from OpenLIT’s evals module into vmalert close the loop between offline test suites and production reality.
- You care about cost efficiency and scalability. Together with VictoriaMetrics observability stack, each signal can be scaled independently in the simplest way, making long-term support easy and predictable.
If you are prototyping a single chatbot and just want a hosted dashboard, Langfuse Cloud or Helicone will save you the docker-compose. Once a real product meets real failure modes, this stack is built for the gap between a polished hosted UI and the alert that pages you because an agent is stuck in a recursion loop costing $80/hr.
FAQ
#
Why not just use Langfuse / Helicone / LangSmith? Use whichever fits - they are good products. The OpenLIT + VictoriaMetrics case is for teams that (a) already run an OTel collector, (b) need self-hosting for compliance, or (c) want LLM telemetry in the same backend as their infra metrics, so a single MetricsQL query can correlate “vLLM TTFT spiked” with “node memory pressure climbed.”
How does OpenLIT compare to OpenLLMetry / Traceloop? Both are OTel-native and emit GenAI semantic conventions. OpenLIT covers more agent frameworks (Claude Agent SDK, Strands, Agno, browser_use, MCP, OpenAI Agents SDK, Pydantic AI, Letta) and ships built-in evals and guardrails in the same SDK. OpenLLMetry is leaner and has a cleaner separation between the SDK and the platform. Both work with the VictoriaMetrics stack identically - pick based on coverage and ergonomics.
Do I need VictoriaTraces and VictoriaLogs, or can I use Tempo / Loki? Tempo and Loki work fine. The VictoriaMetrics stack offers one operational model - same configuration patterns, same query-language family, same upgrade story. For teams already running Tempo/Loki, the only swap is the OTLP exporter endpoint in the collector config.
Does this work in Kubernetes?
Yes. Deploy the OTel collector as a DaemonSet (per-node) plus a gateway Deployment (for tail sampling). The OpenLIT SDK
picks up k8s.namespace.name, k8s.pod.name, and k8s.container.name automatically via OTel’s k8sattributes
processor. vmagent, vmsingle, vmalert, VictoriaTraces, and VictoriaLogs all have official Helm charts.
What about prompt/response capture for forensics?
Set capture_message_content=True in openlit.init() and the prompt and completion stream into VictoriaLogs alongside
the span. Query them in LogsQL by trace_id to pull up the exact text behind any trace you find in a dashboard. Disable
this in environments where logging prompt content is a compliance violation; OpenLIT also ships PII redaction guards if
you need to capture-but-scrub.
Leave a comment below or Contact Us if you have any questions!
comments powered by Disqus