- Blog /
- VictoriaMetrics Components: Getting Started
VictoriaMetrics Components: Getting Started
Share:


This article introduces the key components of VictoriaMetrics and kick off the series of articles to explain how to use these components effectively. It’s an ongoing series:
VictoriaMetrics is a top-tier monitoring solution known for its speed and low-resource consumption. It includes components for monitoring, alerting, data visualization, querying, scraping, incremental backups, and more.
For a deeper look at how VictoriaMetrics components work, check out the completed internals series here:
- How VictoriaMetrics Agent (vmagent) Works
- How vmstorage Handles Data Ingestion
- How vmstorage Processes Data: Retention, Merging, Deduplication,…
- When Metrics Meet vminsert: A Data-Delivery Story
- How vmstorage’s IndexDB Works?
- How vmstorage Handles Query Requests From vmselect
- Inside vmselect: The Query Processing Engine of VictoriaMetrics
VictoriaMetrics Cluster
#
A VictoriaMetrics cluster is made up of three main components: vminsert, vmselect, and vmstorage.
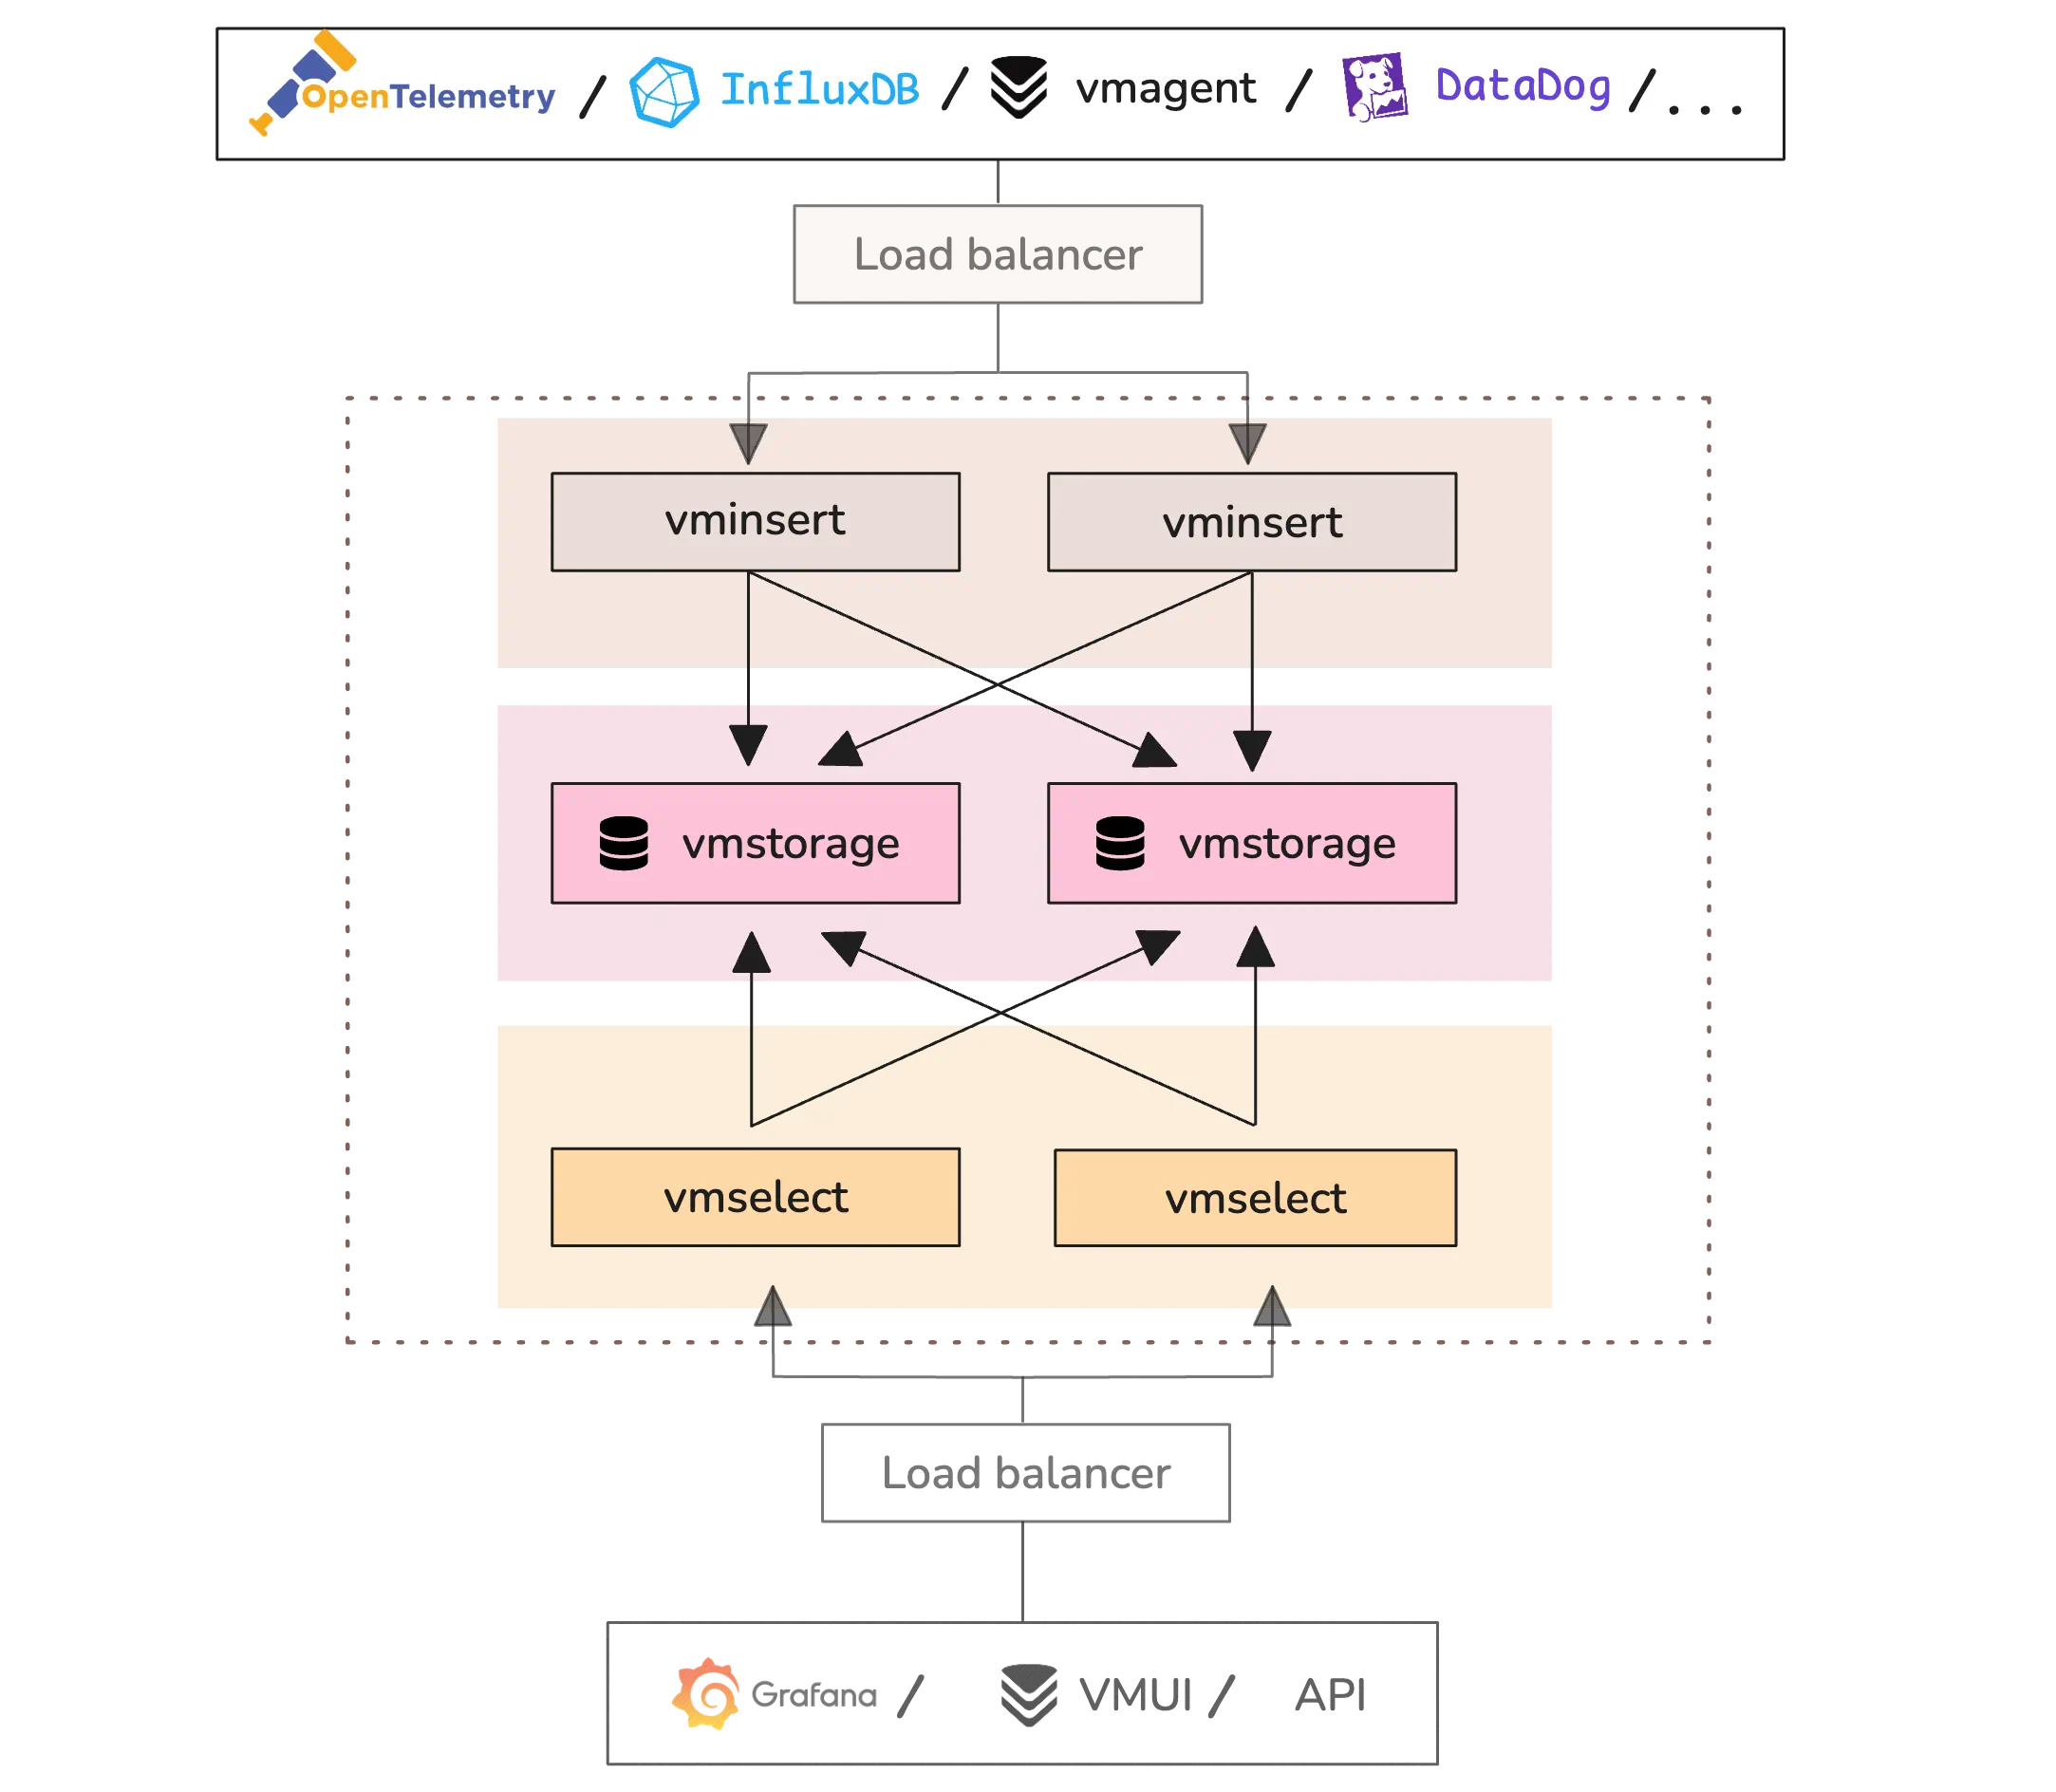
Each component runs as an independent service. The system follows a shared-nothing architecture where components communicate over the network but do not share memory or disk. For example, vmstorage-1 and vmstorage-2 operate independently and have no knowledge of each other.
Each service can be scaled horizontally. You can add more vmstorage nodes to store more data or more vmselect nodes to handle more queries.
vminsert: Data Ingestion
#
vminsert serves as the data ingestion frontend for vmstorage. It accepts metrics in various formats from many sources, including Prometheus remote write, InfluxDB line protocol, OpenTSDB, Graphite, Datadog, New Relic, and OpenTelemetry.
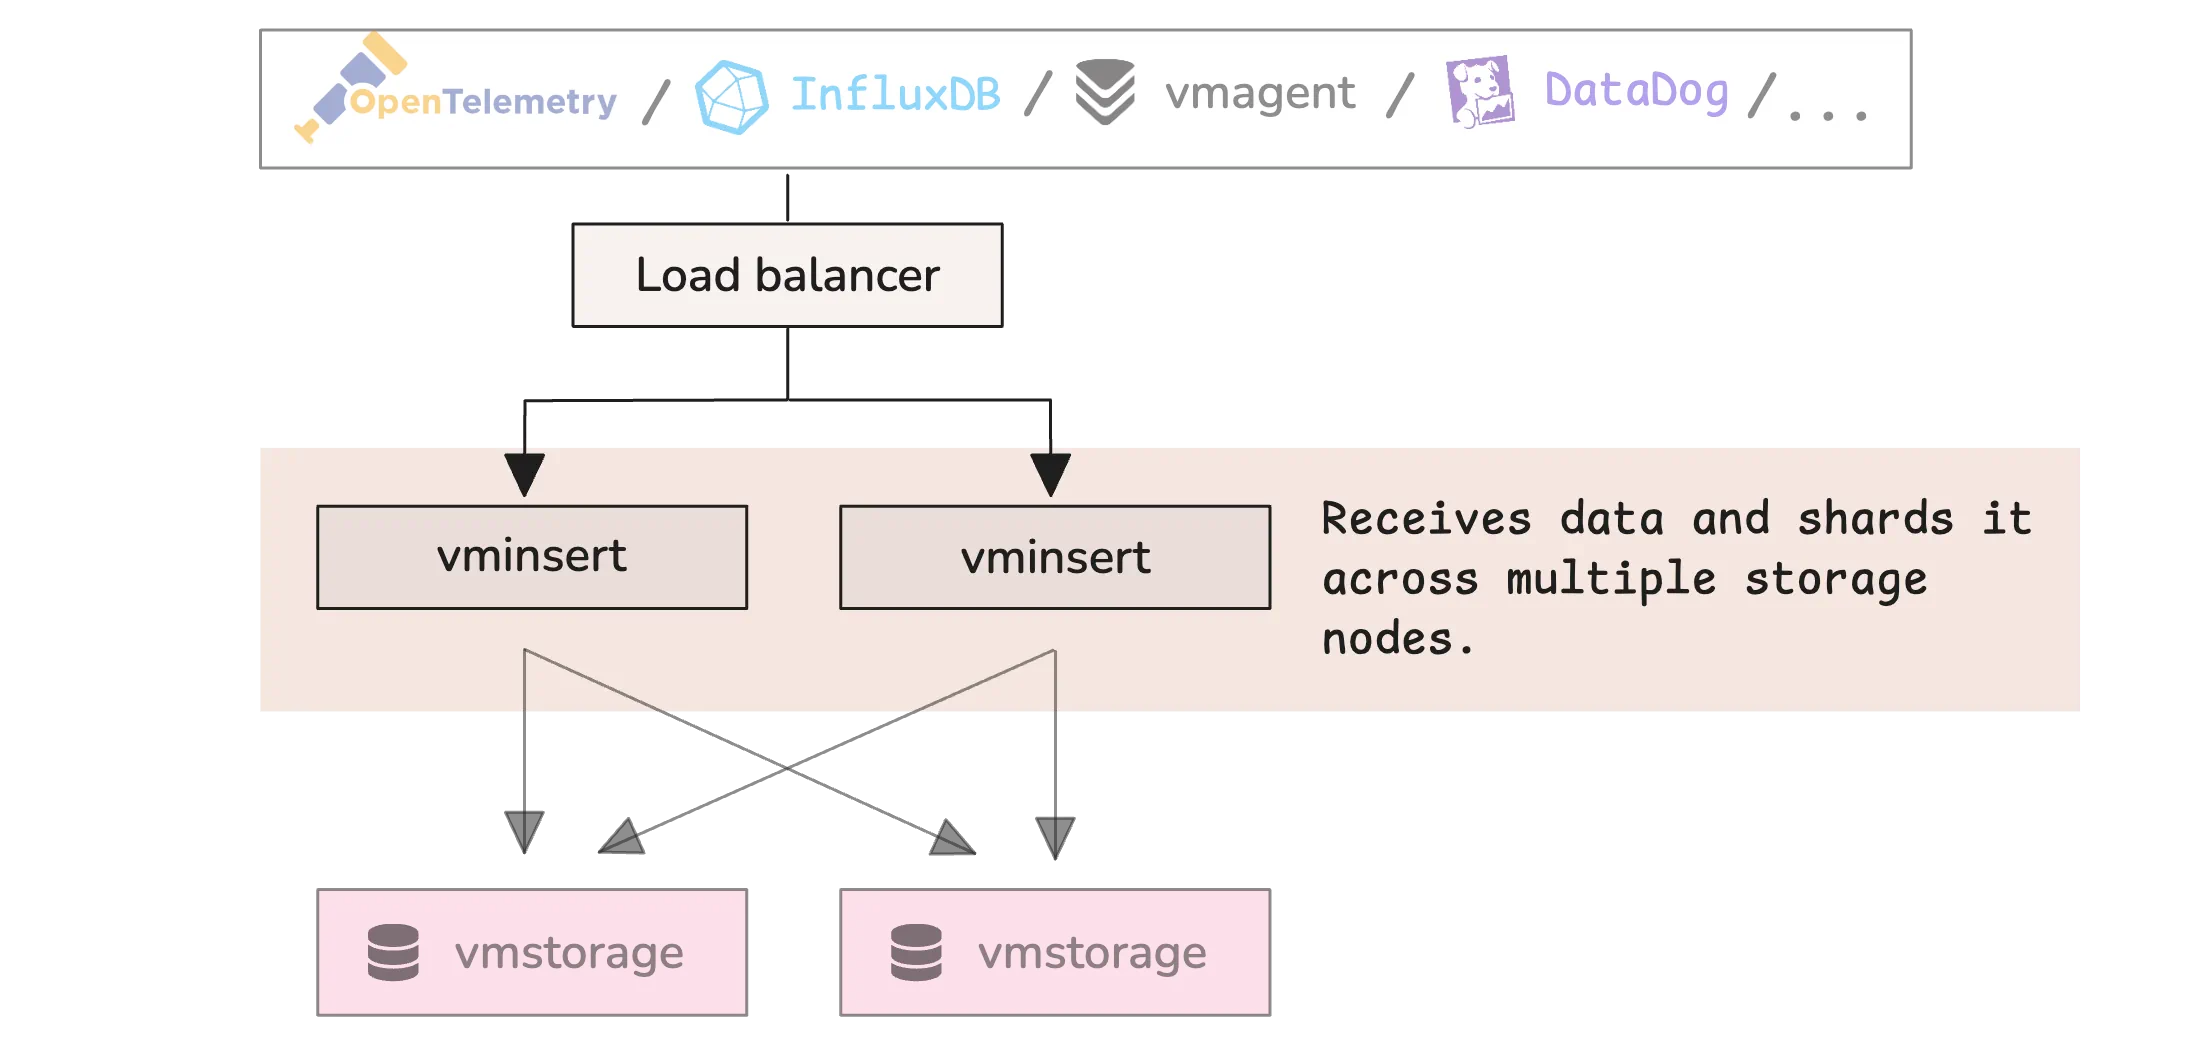
It parses incoming data based on the specific protocol and applies relabeling rules to transform or filter metrics before storing them. The metrics are buffered and sent in batches to different vmstorage nodes.
The main role of vminsert is to distribute data efficiently. It uses consistent hashing on metric names and labels to shard data across vmstorage nodes. In addition to sharding, it supports data replication to improve durability and availability.
If a vmstorage node becomes unavailable, vminsert reroutes the data to healthy nodes. This keeps ingestion running without interruption, even if part of the cluster goes down. It favors availability over strict consistency in such cases.
For scalability, you can run multiple vminsert instances. These can be added behind a load balancer like vmauth to support higher ingestion rates without affecting other components.
vmstorage: Data Storage
#
vmstorage has two main responsibilities:
- It receives and stores incoming data from
vminsertnodes. - It serves query requests from
vmselectnodes.
vmstorage saves data to disk using a highly optimized format. It combines in-memory and on-disk storage, organizing data into parts of different sizes to improve both write and read performance. Each vmstorage node requires a dedicated data directory, set using the -storageDataPath parameter. This is where all time series data is stored.
Data retention is automatically managed using the -retentionPeriod flag. This defines how long data is kept before it is removed, helping to control disk usage over time.
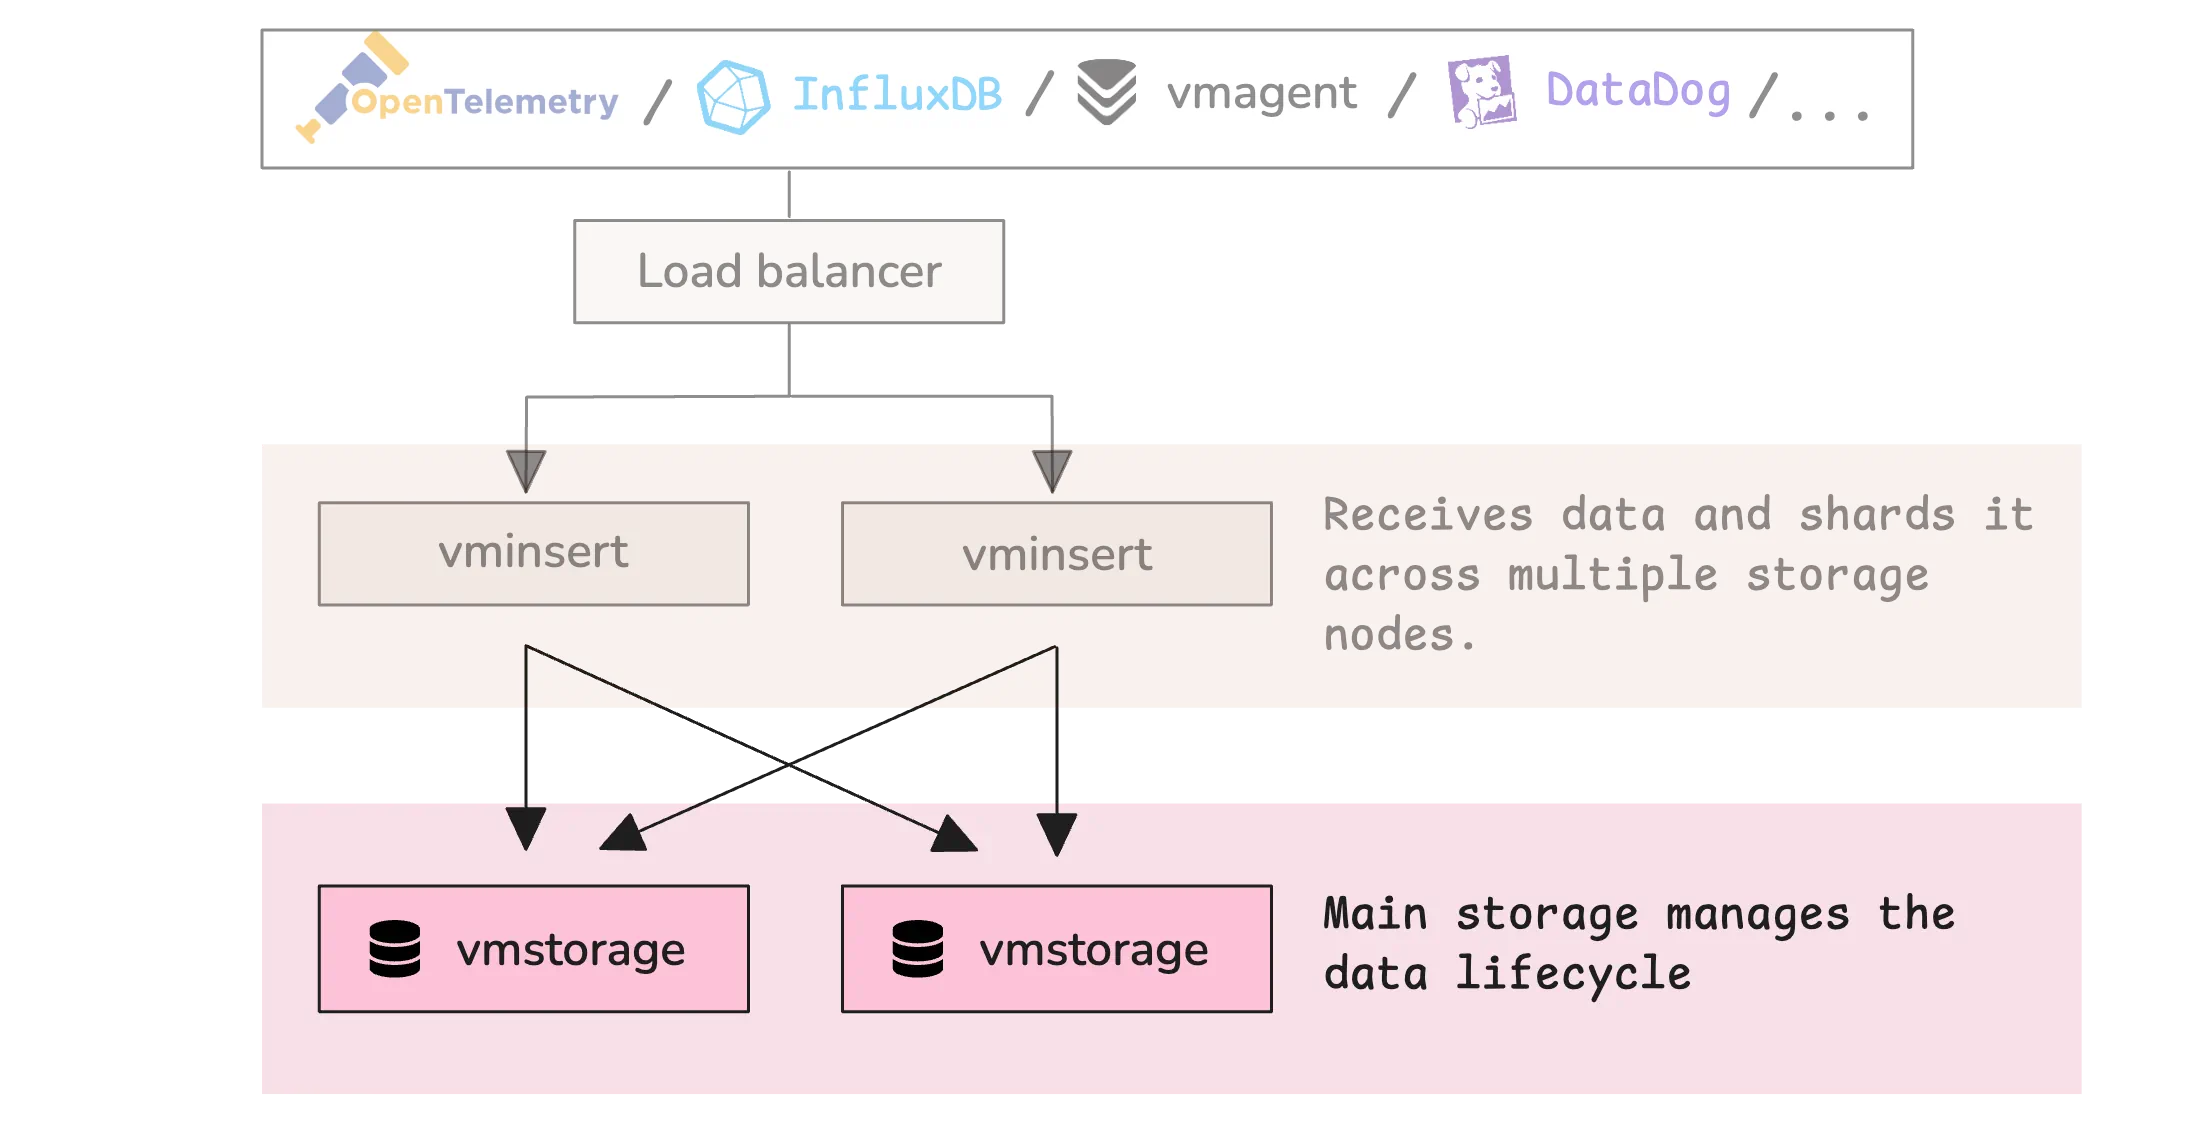
Beyond storing data, vmstorage manages internal resources. It maintains memory caches for frequently accessed data, runs background tasks, and monitors system metrics like disk space to ensure stable performance.
If available disk space becomes critically low, vmstorage can switch to read-only mode. This prevents data corruption while still allowing queries to be served.
vmselect: Data Retrieval
#
vmselect is the query processing component in the VictoriaMetrics cluster architecture. It acts as the frontend for all read operations, handling client queries and coordinating with vmstorage nodes to retrieve and process data.
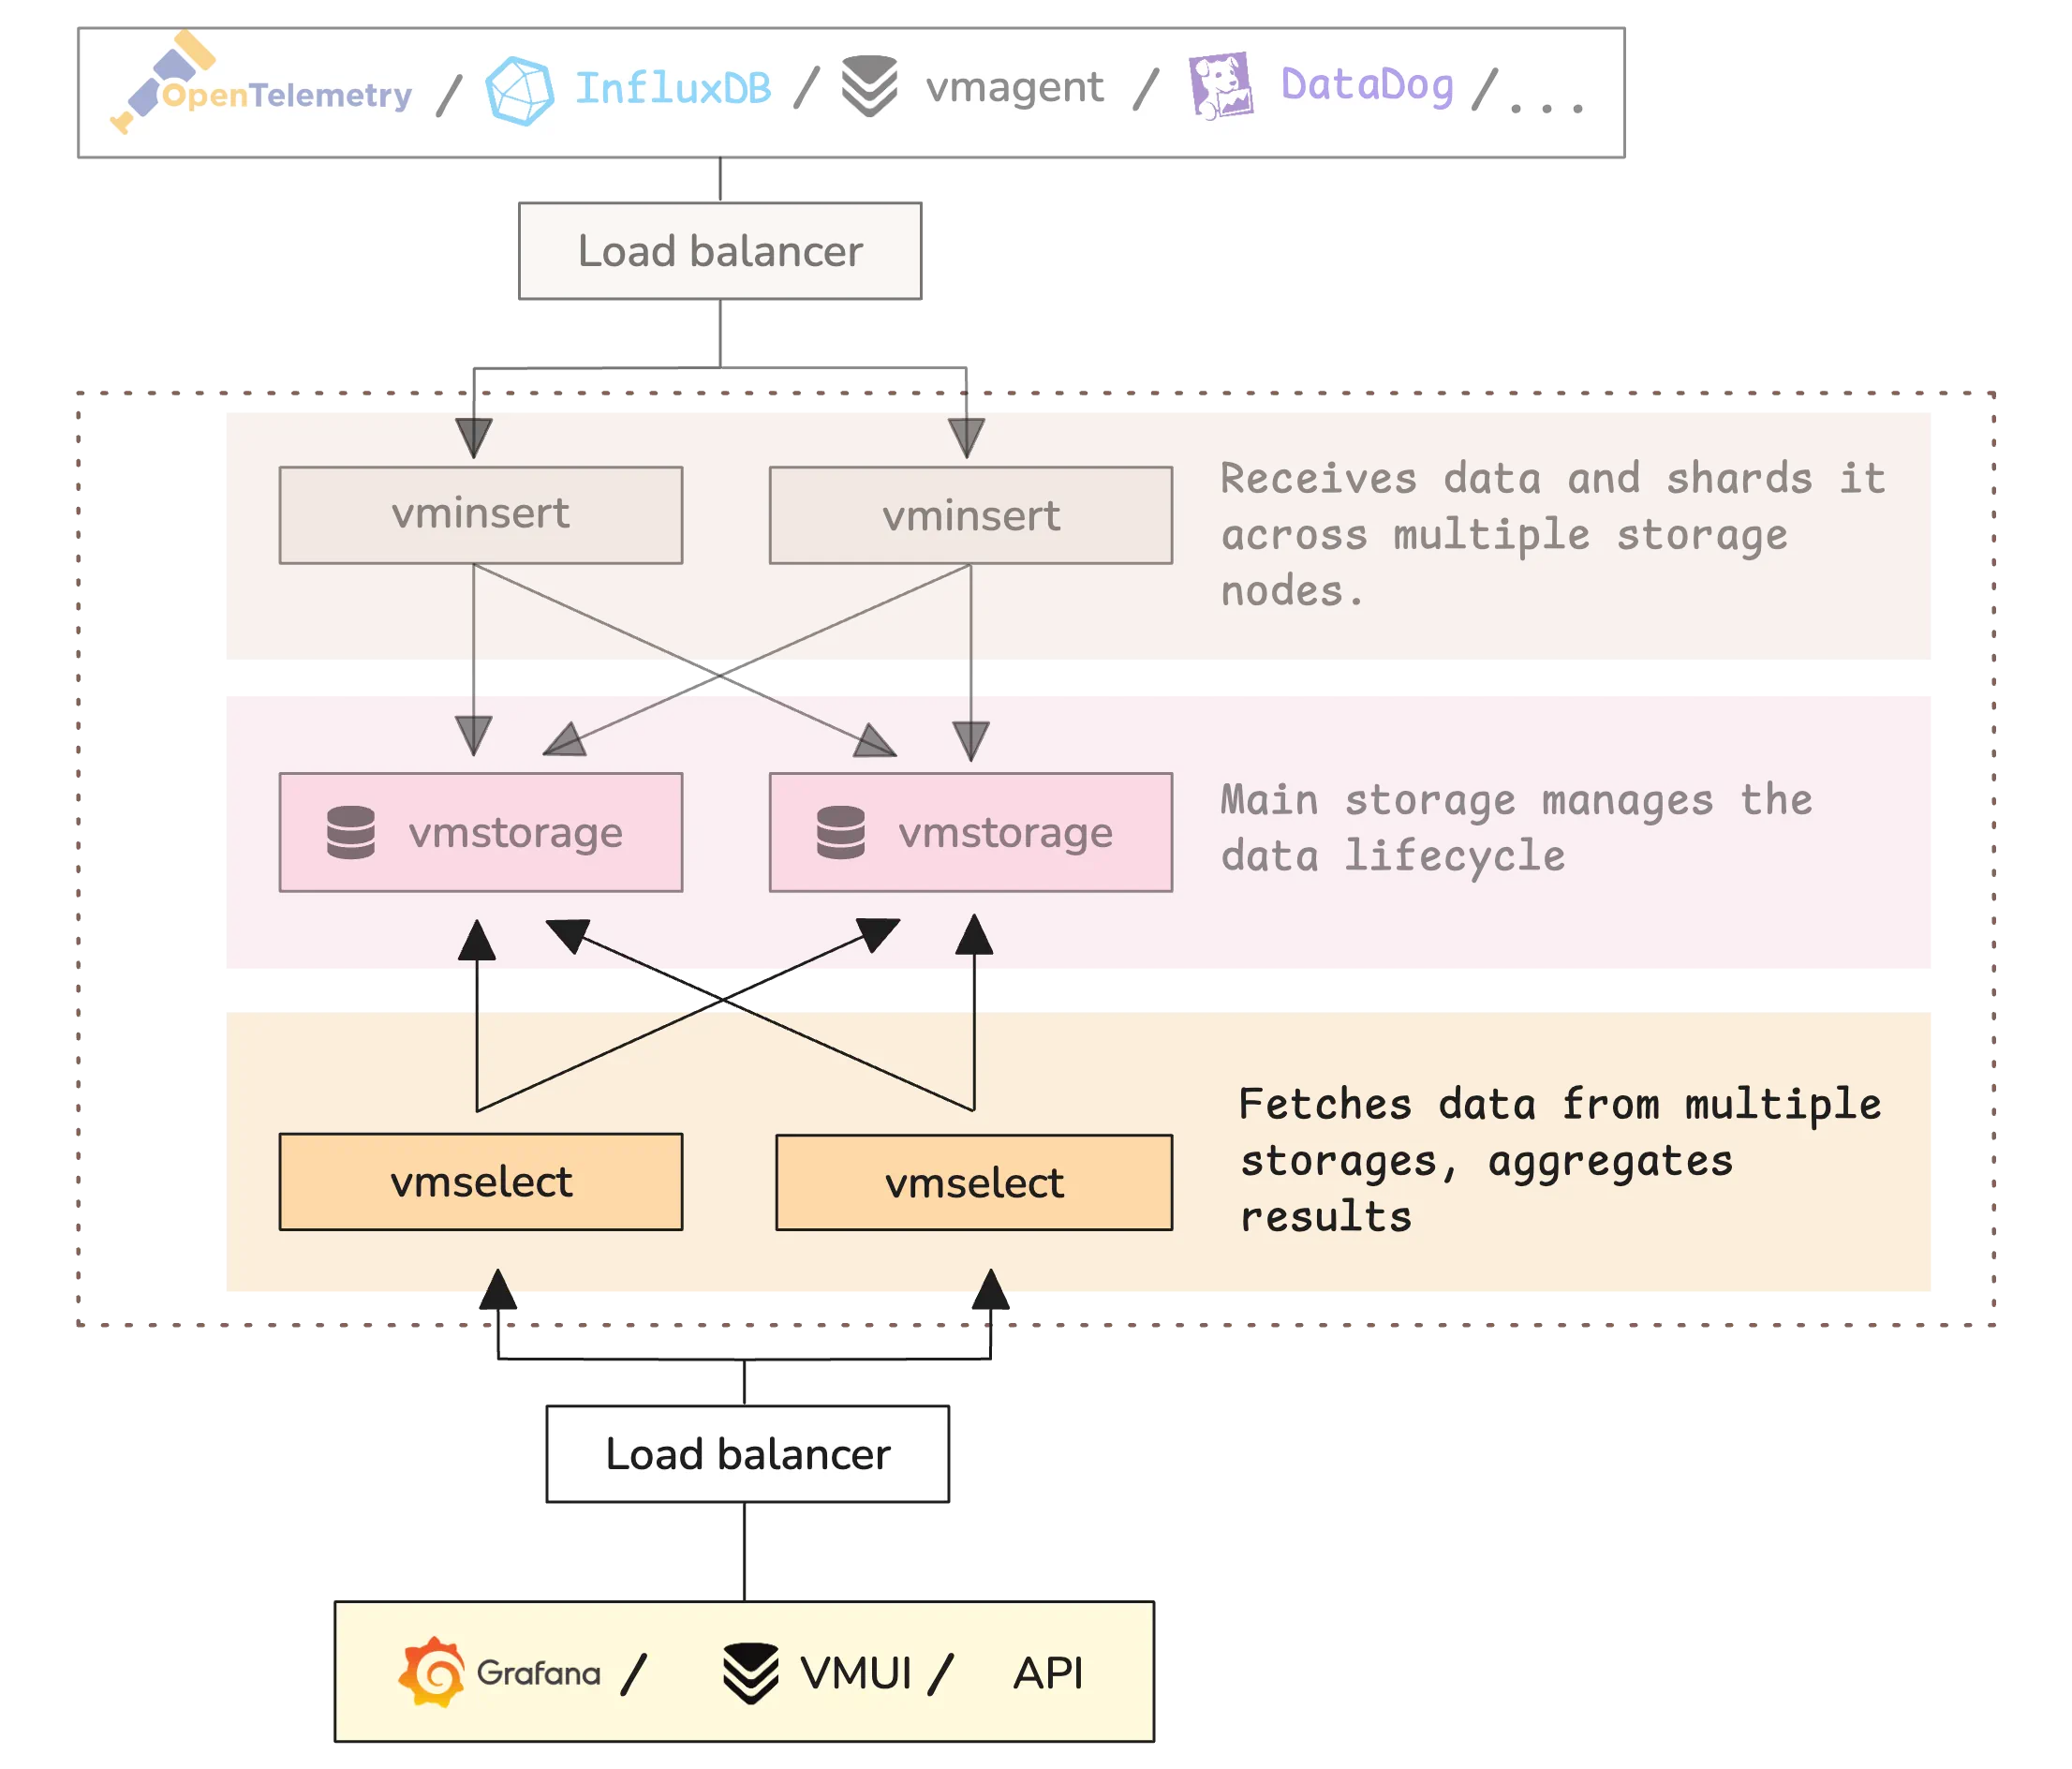
When a client sends a query, vmselect breaks it down to identify the exact metrics requested. It sends these requests to all vmstorage nodes, waits for the responses, merges the results, and applies any required aggregation, rollup functions, etc. After processing, it returns a single, unified response to the client.
vmselect also includes a built-in web interface called “vmui” that helps users explore data visually, troubleshoot queries, and understand how collected metrics affect system performance.
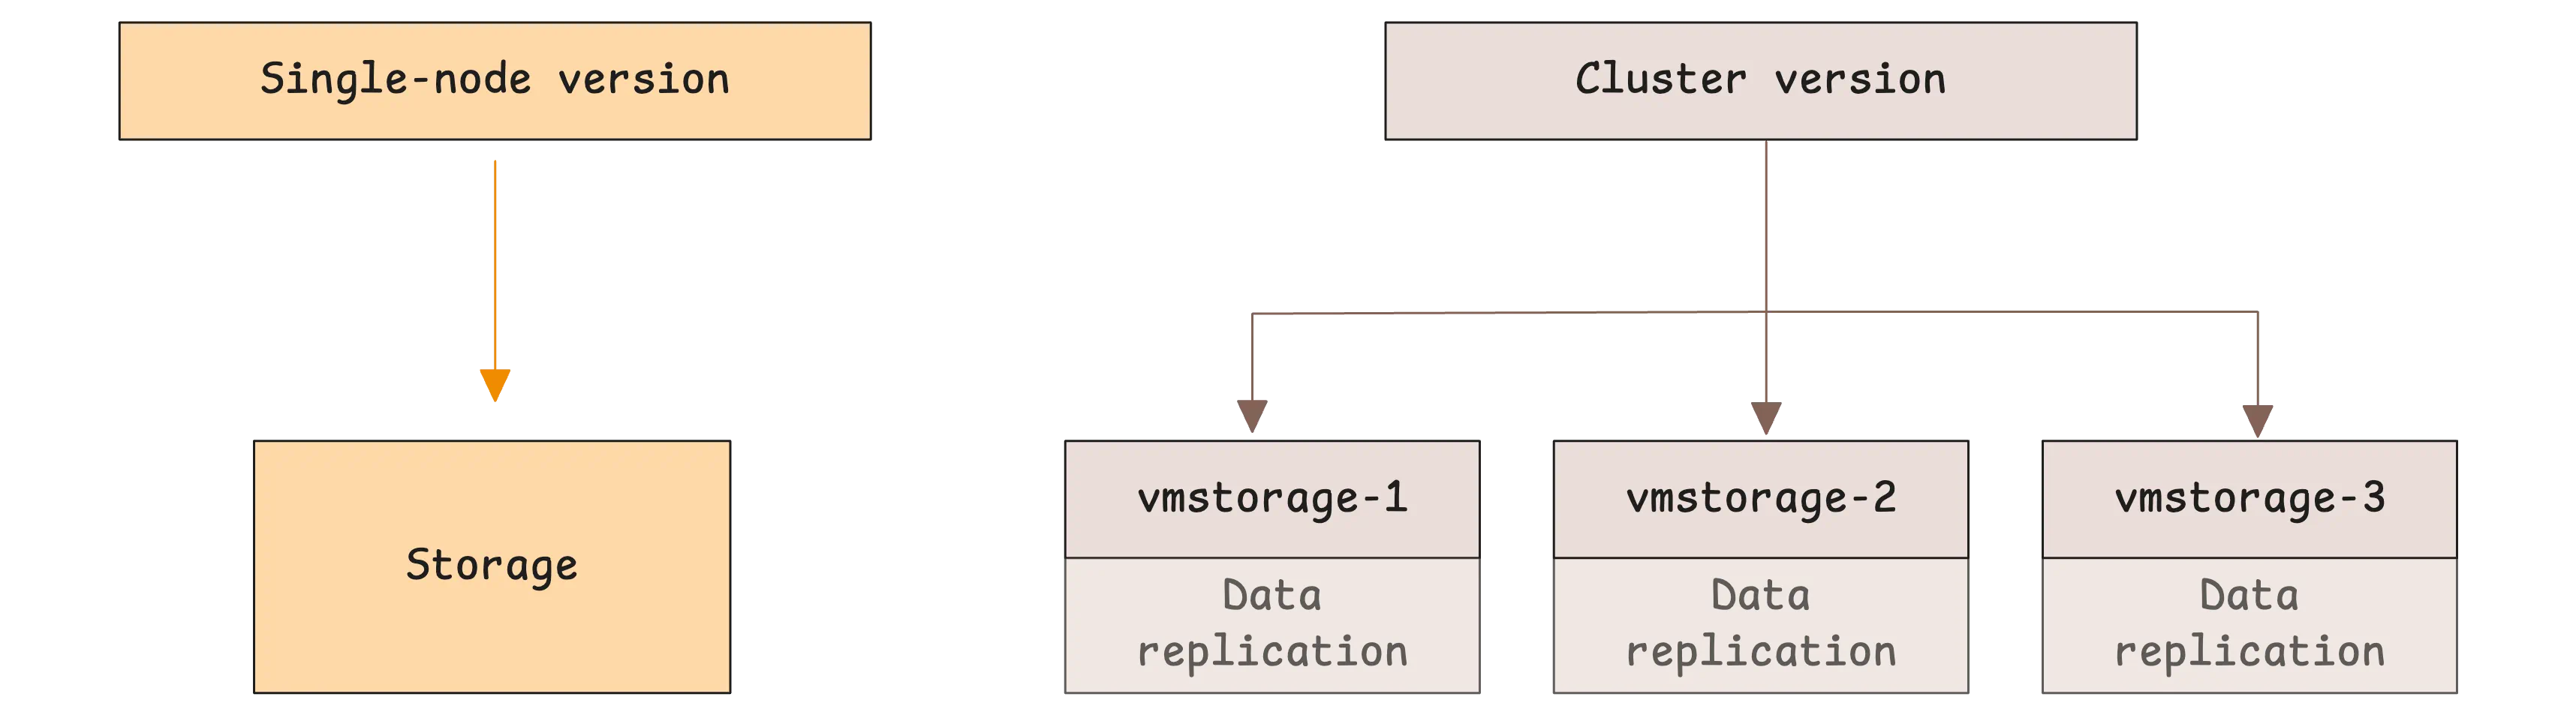
Single-node VictoriaMetrics
#
Unlike the cluster version, which splits responsibilities across multiple components (vminsert, vmstorage, and vmselect), the single-node version performs all these tasks within one process.
Single-node VictoriaMetrics is designed for vertical scaling instead of horizontal scaling. It scales by adding more CPU, memory, disk space, and IO capacity to a single machine. Performance tests show that it scales almost linearly with these resources.
In many small to medium-sized environments, the single-node version can outperform the cluster setup because it:
- avoids network overhead between internal components, which can reduce CPU and memory usage for the same workload
- is easier to set up and manage, requiring less configuration and maintenance
Still, it comes with some limitations:
- It depends on the durability of the storage defined by the
-storageDataPathflag, while the cluster version supports replication across multiple nodes for better availability - It does not support multi-tenancy, a feature in the cluster version that isolates users or organizations
If your resources are limited and high availability is not a top priority, the single-node version is often the better choice.
It can handle tens of millions of active time series and ingest millions of samples per second on suitable hardware. Again, with the same workload, it typically runs faster and uses fewer resources than the cluster version.
Single-Node VictoriaMetrics Can Achieve High Availability
A single-node VictoriaMetrics setup can also achieve high availability—similar to the cluster version—by running two identically configured VictoriaMetrics instances in separate data centers. See High Availability for more details.
vmagent: Metrics Collection Agent
#
vmagent serves as both a metrics collector and router. It can actively scrape Prometheus-compatible targets (like exporters) and receive metrics pushed via various protocols including Prometheus remote_write, InfluxDB line protocol, Graphite, OpenTSDB, Datadog, and more.
This flexibility means it can integrate with virtually any metrics-producing system:
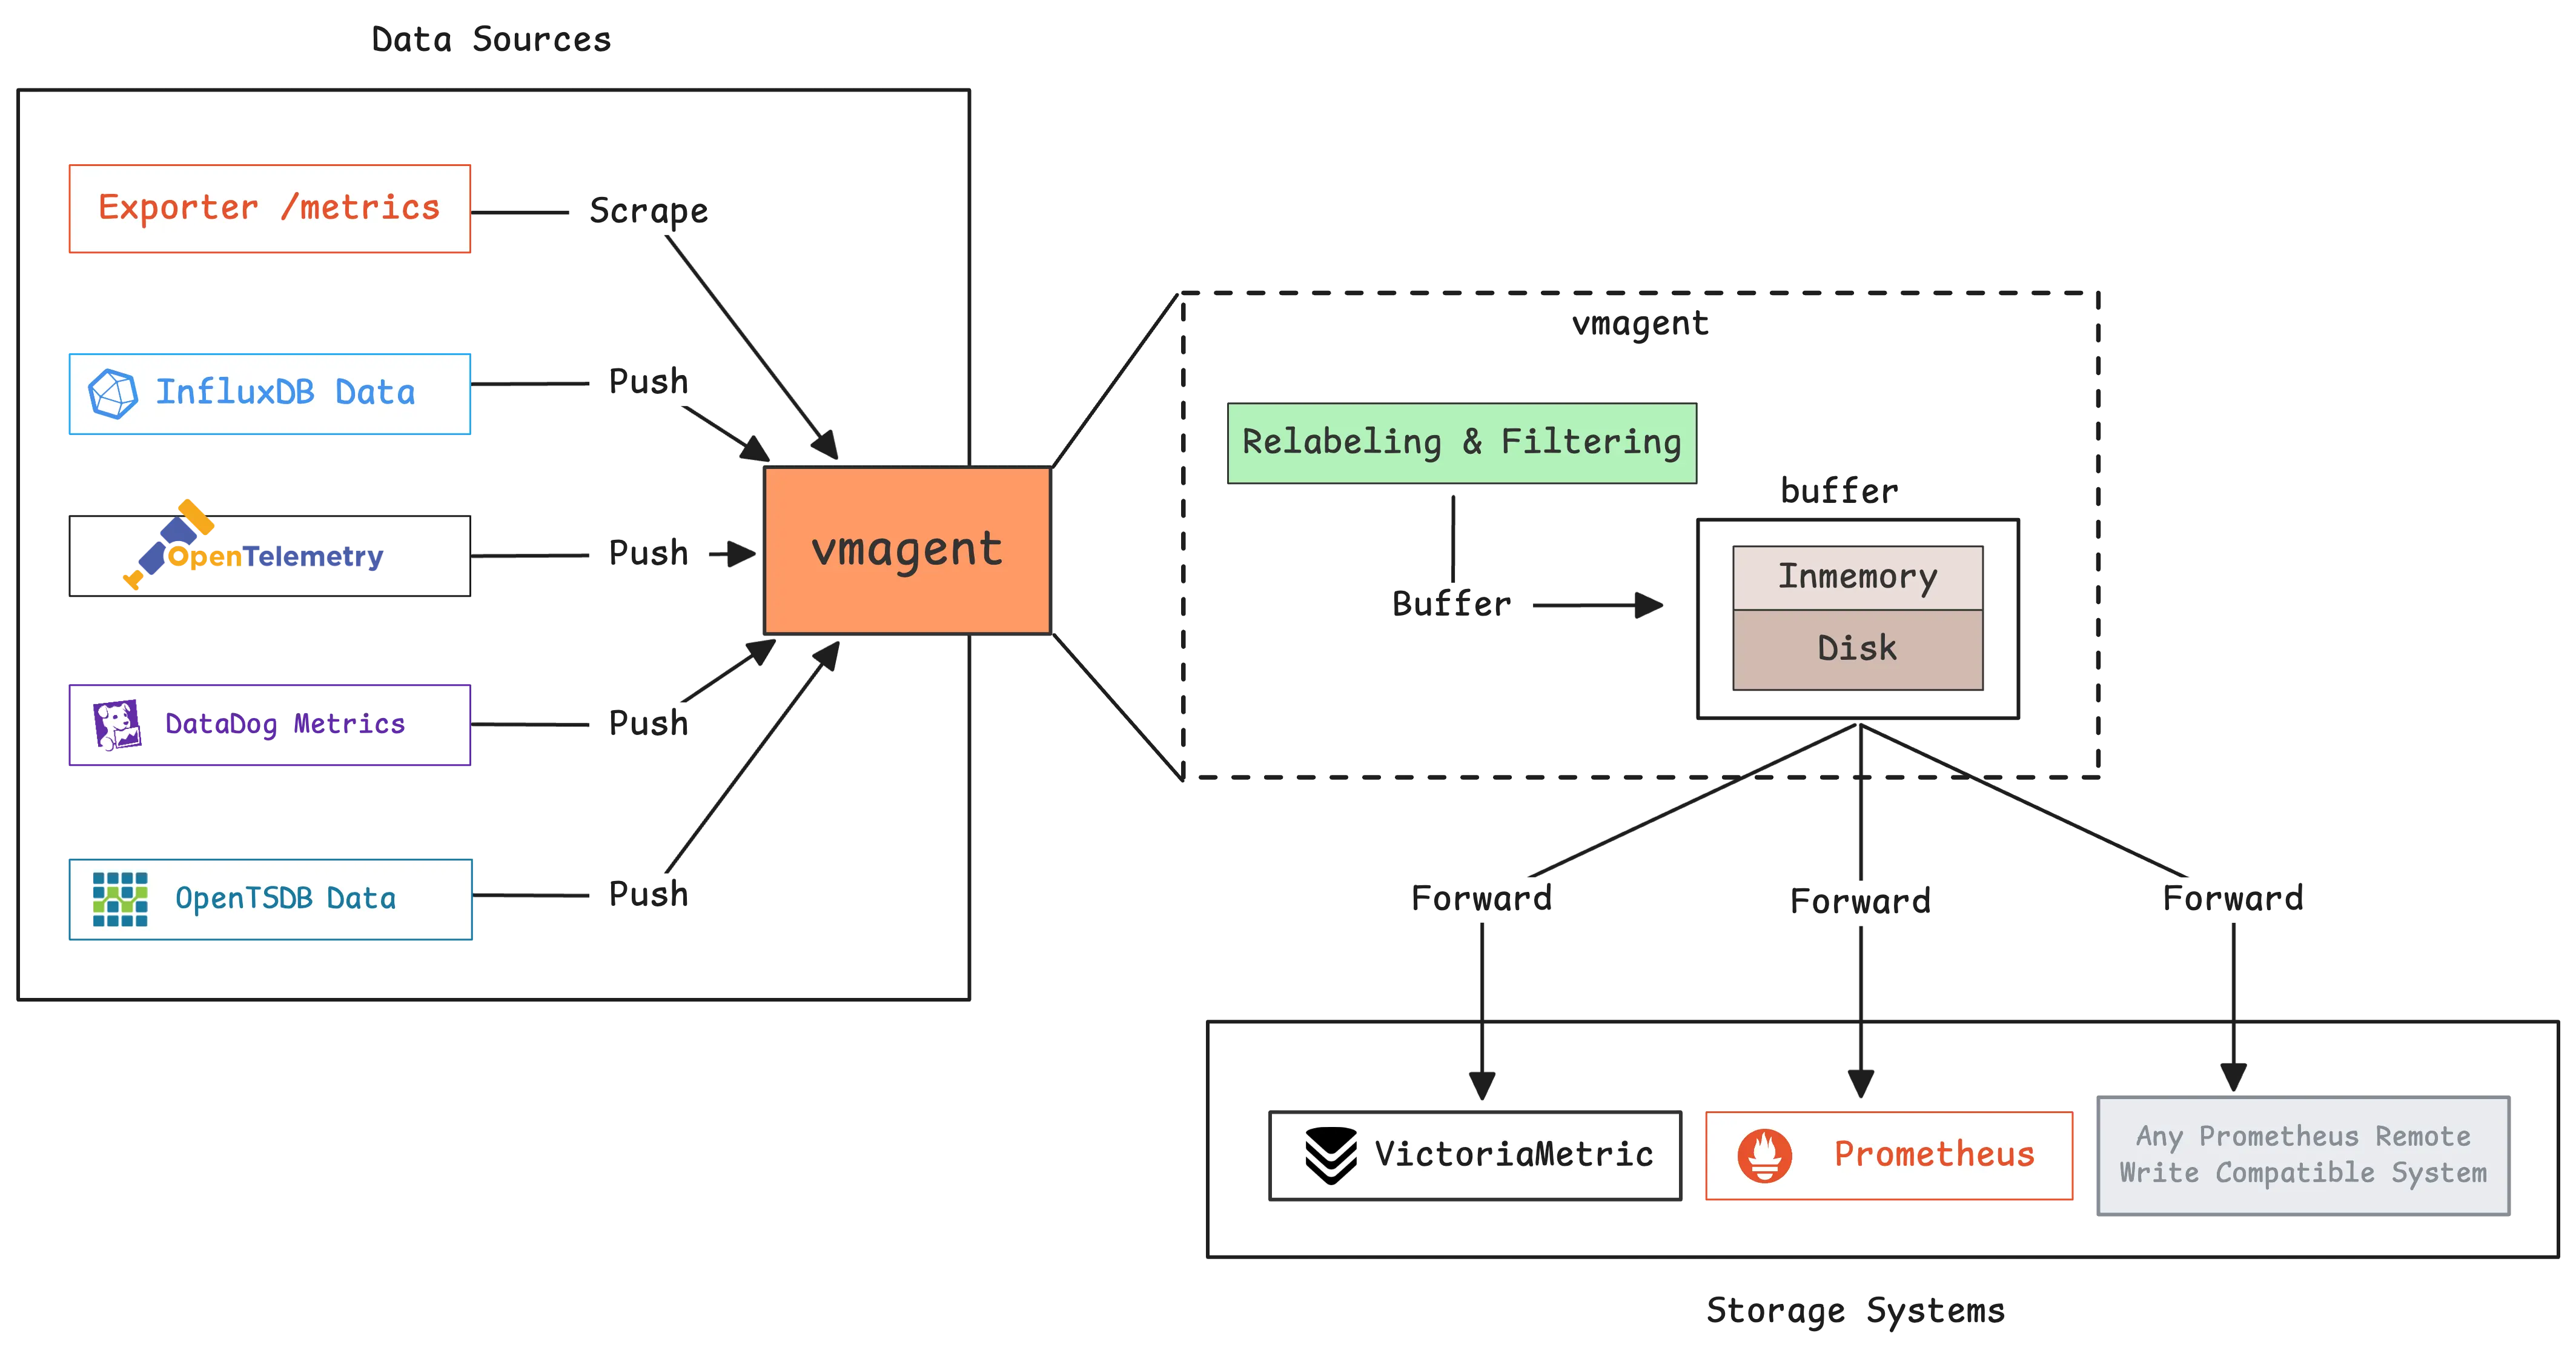
One of the key strengths of vmagent is its ability to process metrics before sending them. With its relabeling system, it can add, change, or remove labels from metrics. This helps clean up the data, organize metadata, filter out unwanted metrics, and route specific metrics to different storage targets.
vmagent is built for reliability. If remote storage becomes unavailable, it stores the metrics on disk and sends them later when the connection is back.
To support replication and fault tolerance, vmagent can send the same metrics to more than one storage system at the same time. It can also split metrics across multiple storage systems.
For enterprise setups, vmagent supports integration with cloud message systems like Kafka and Google PubSub. This lets metrics move through existing messaging infrastructure.
This is just a quick look at what vmagent can do. For full details, see the vmagent documentation.
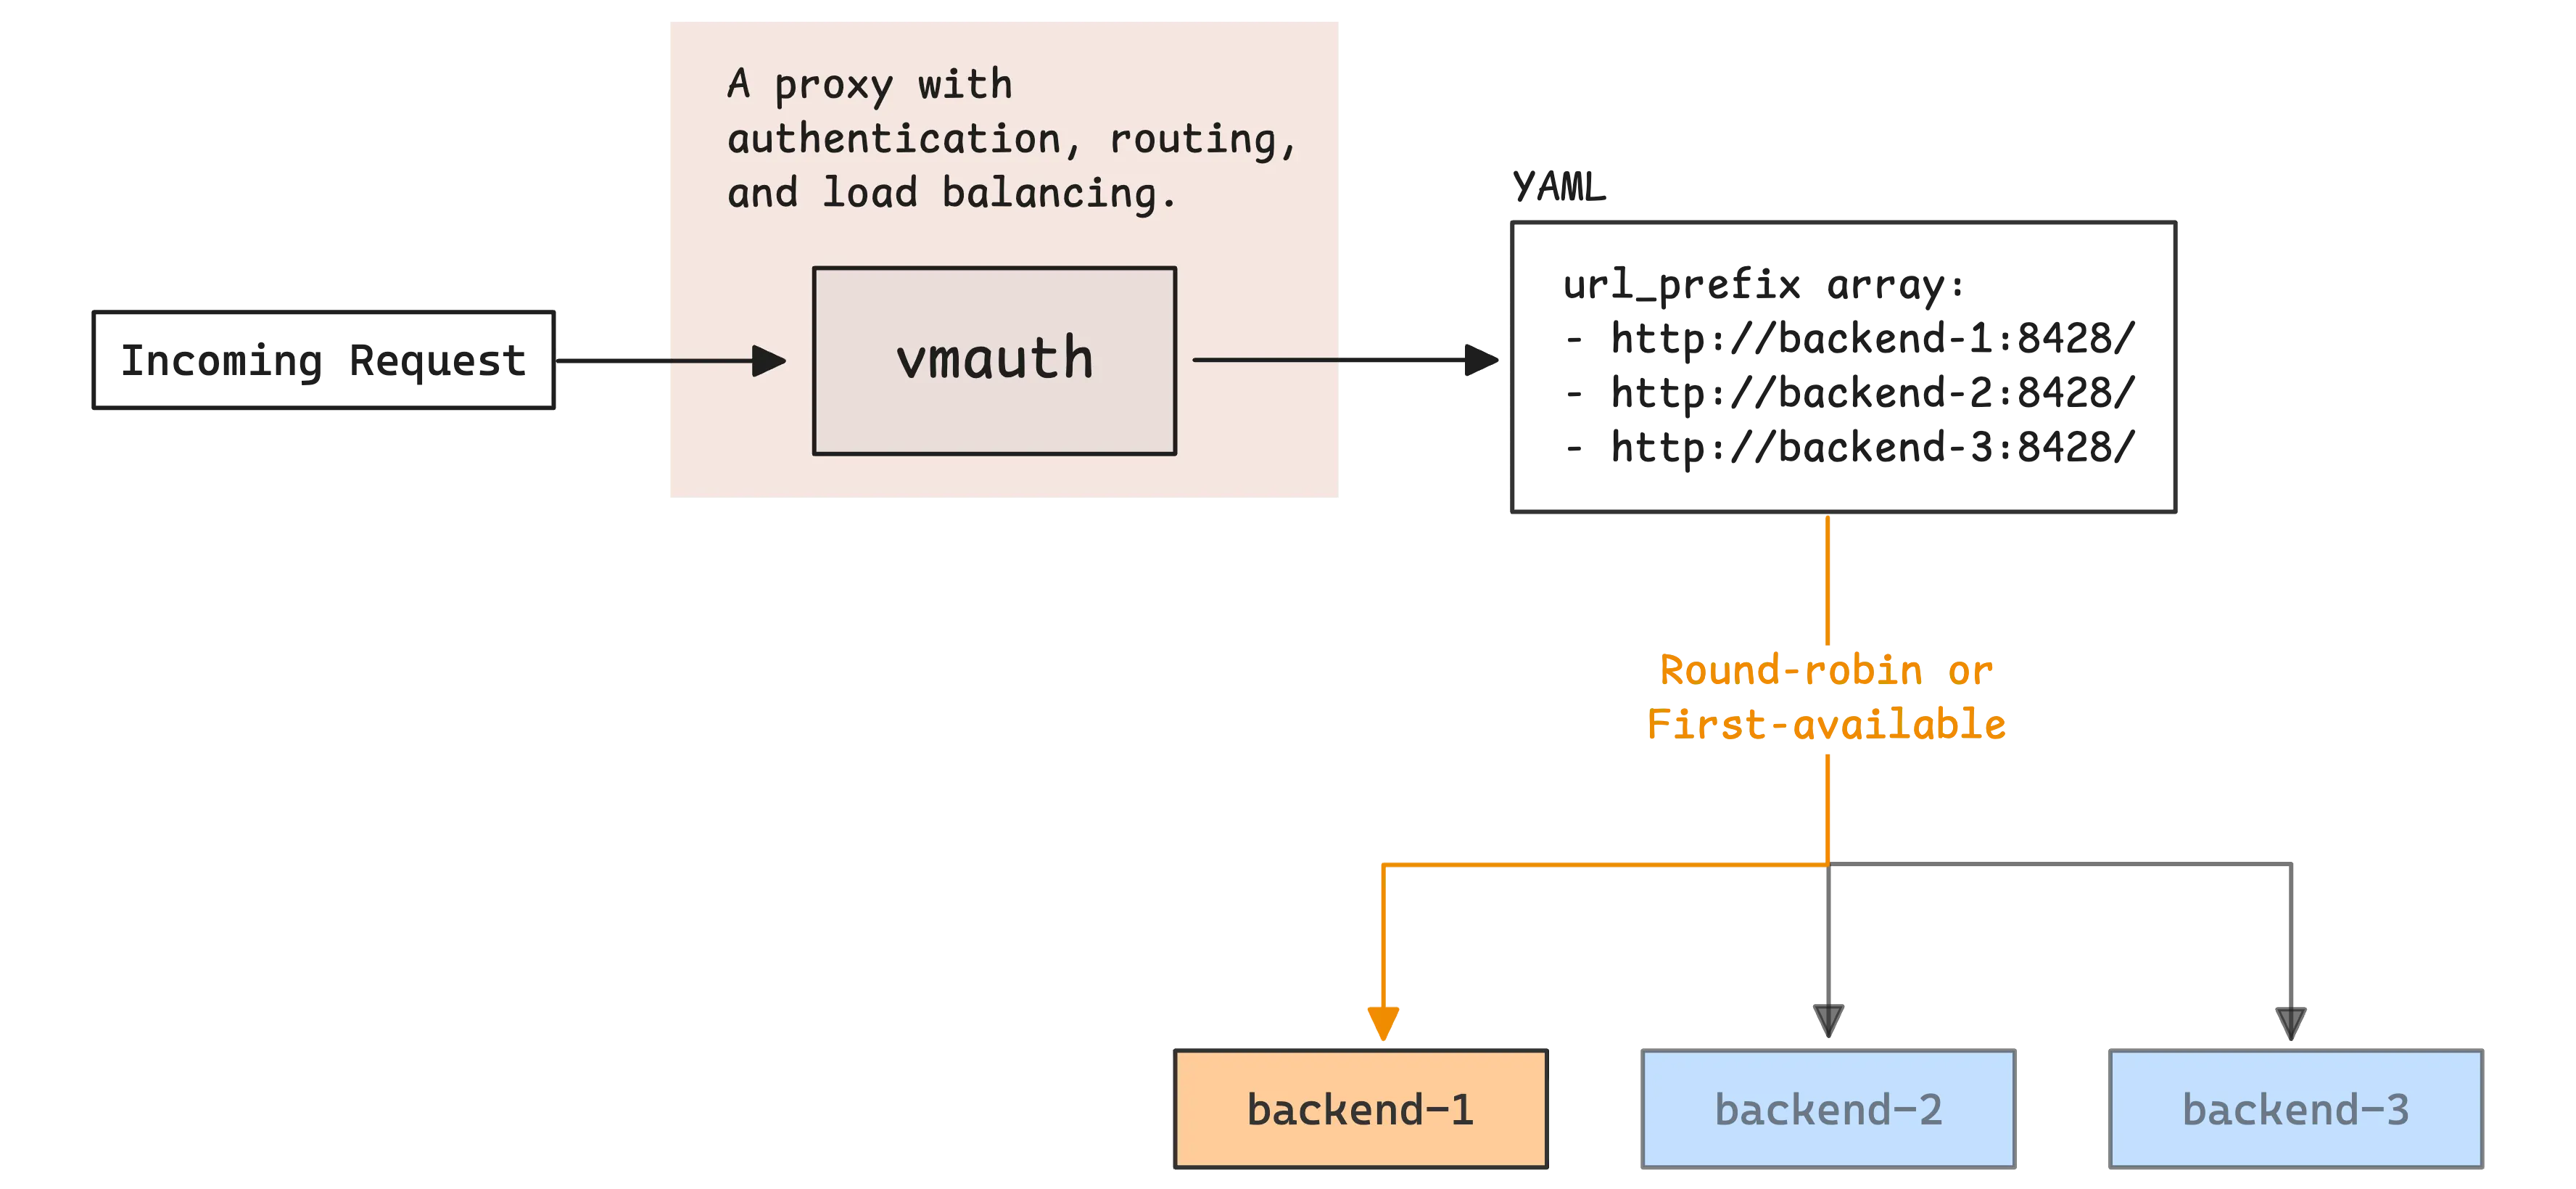
vmauth: Proxy with Load Balancing, Routing and Authentication
#
vmauth is an HTTP proxy in the VictoriaMetrics ecosystem. It helps with:
- Load balancing:
vmauthcan distribute requests across multiple backend services like VictoriaMetrics nodes orvminsertinstances. It supports several strategies such as round-robin, least-loaded, or first available.
- Authentication and authorization:
vmauthchecks user credentials (tokens, basic auth, bearer tokens) against a configuration file. It controls which users can access which resources. - Request routing: It routes incoming HTTP requests to the correct backend services. Routing decisions can be based on:
- Authentication credentials
- Request paths
- HTTP headers
- Query parameters
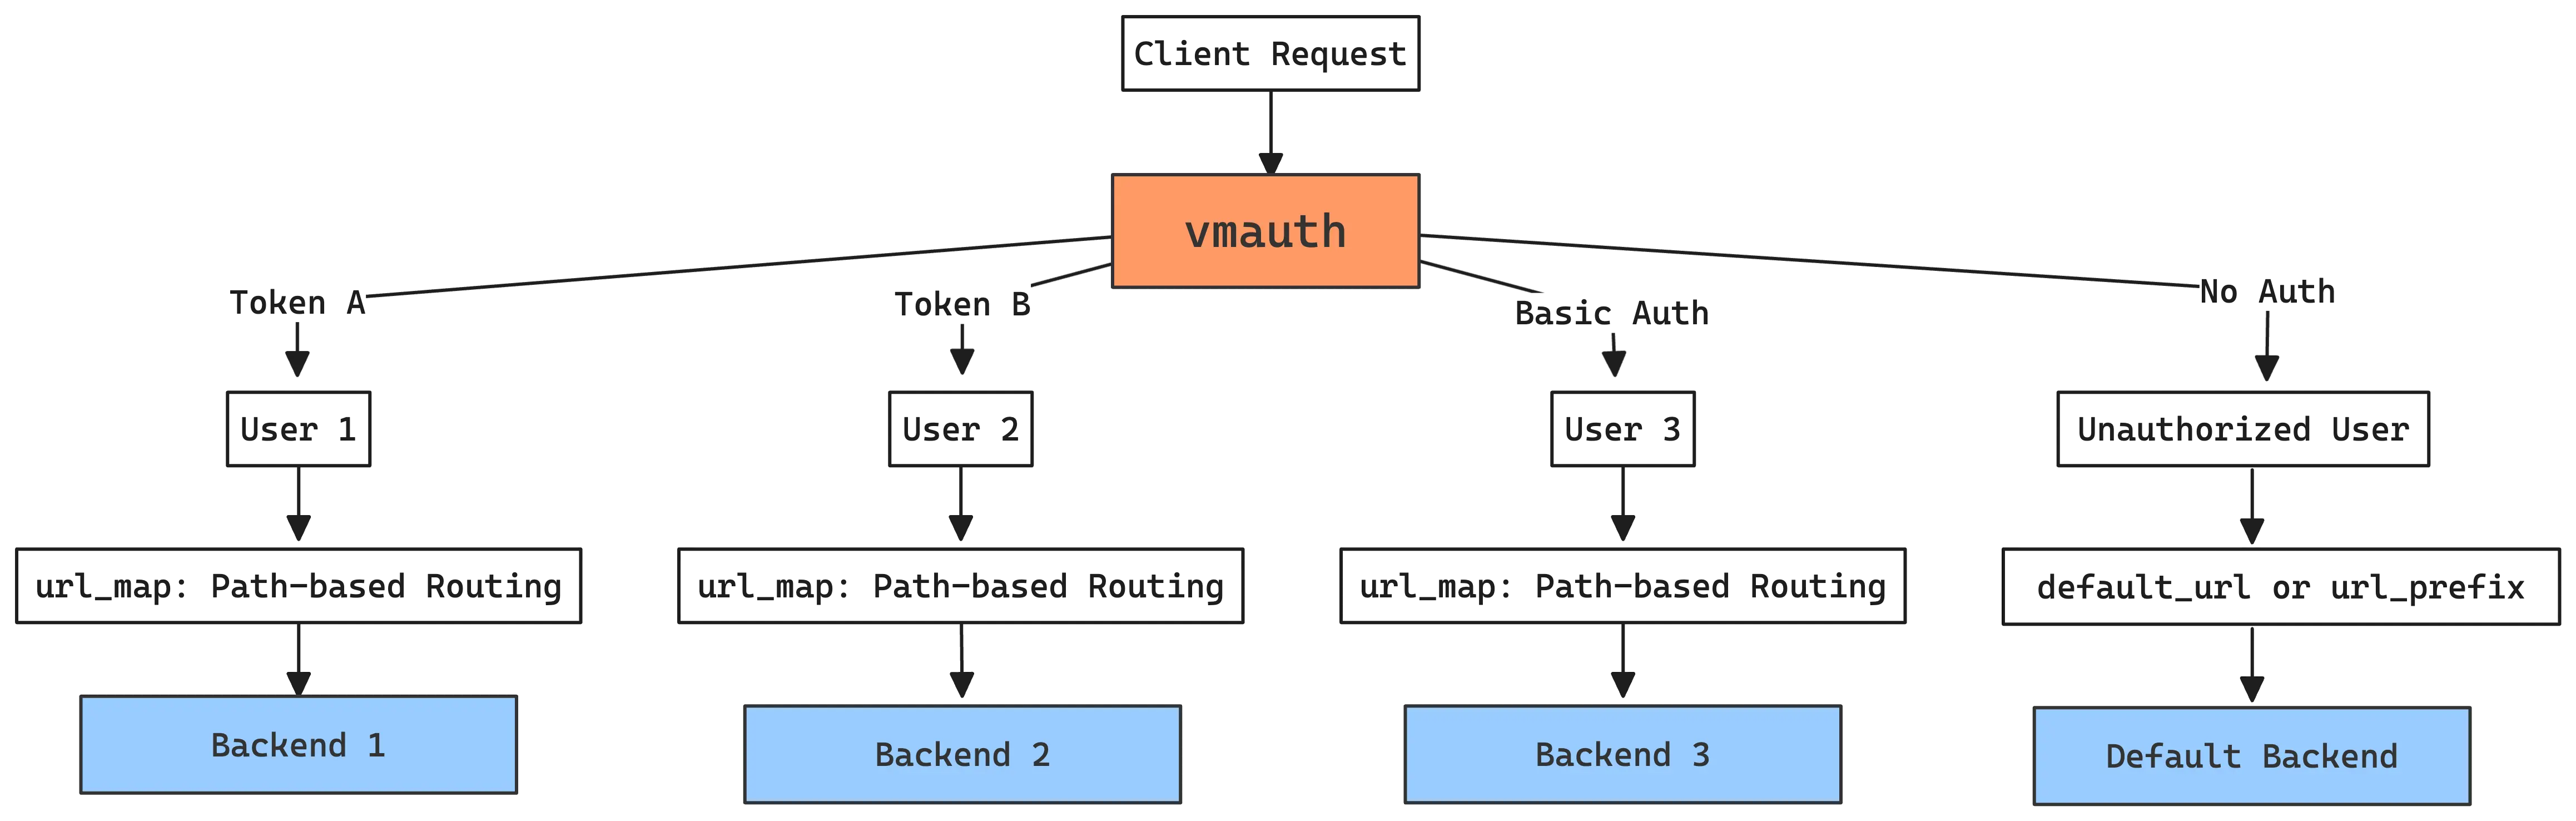
- High availability proxy:
vmauthcan automatically fail over to standby backends if the primary ones become unavailable. - TLS termination: It can accept HTTPS connections from clients and forward them to backends over HTTP.
vmbackup: Backup Storage Incrementally
#
vmbackup creates backups from either single-node or cluster versions of VictoriaMetrics by using instant snapshots.
You do not need to stop your storage system to run a backup. The data remains available during the backup process.
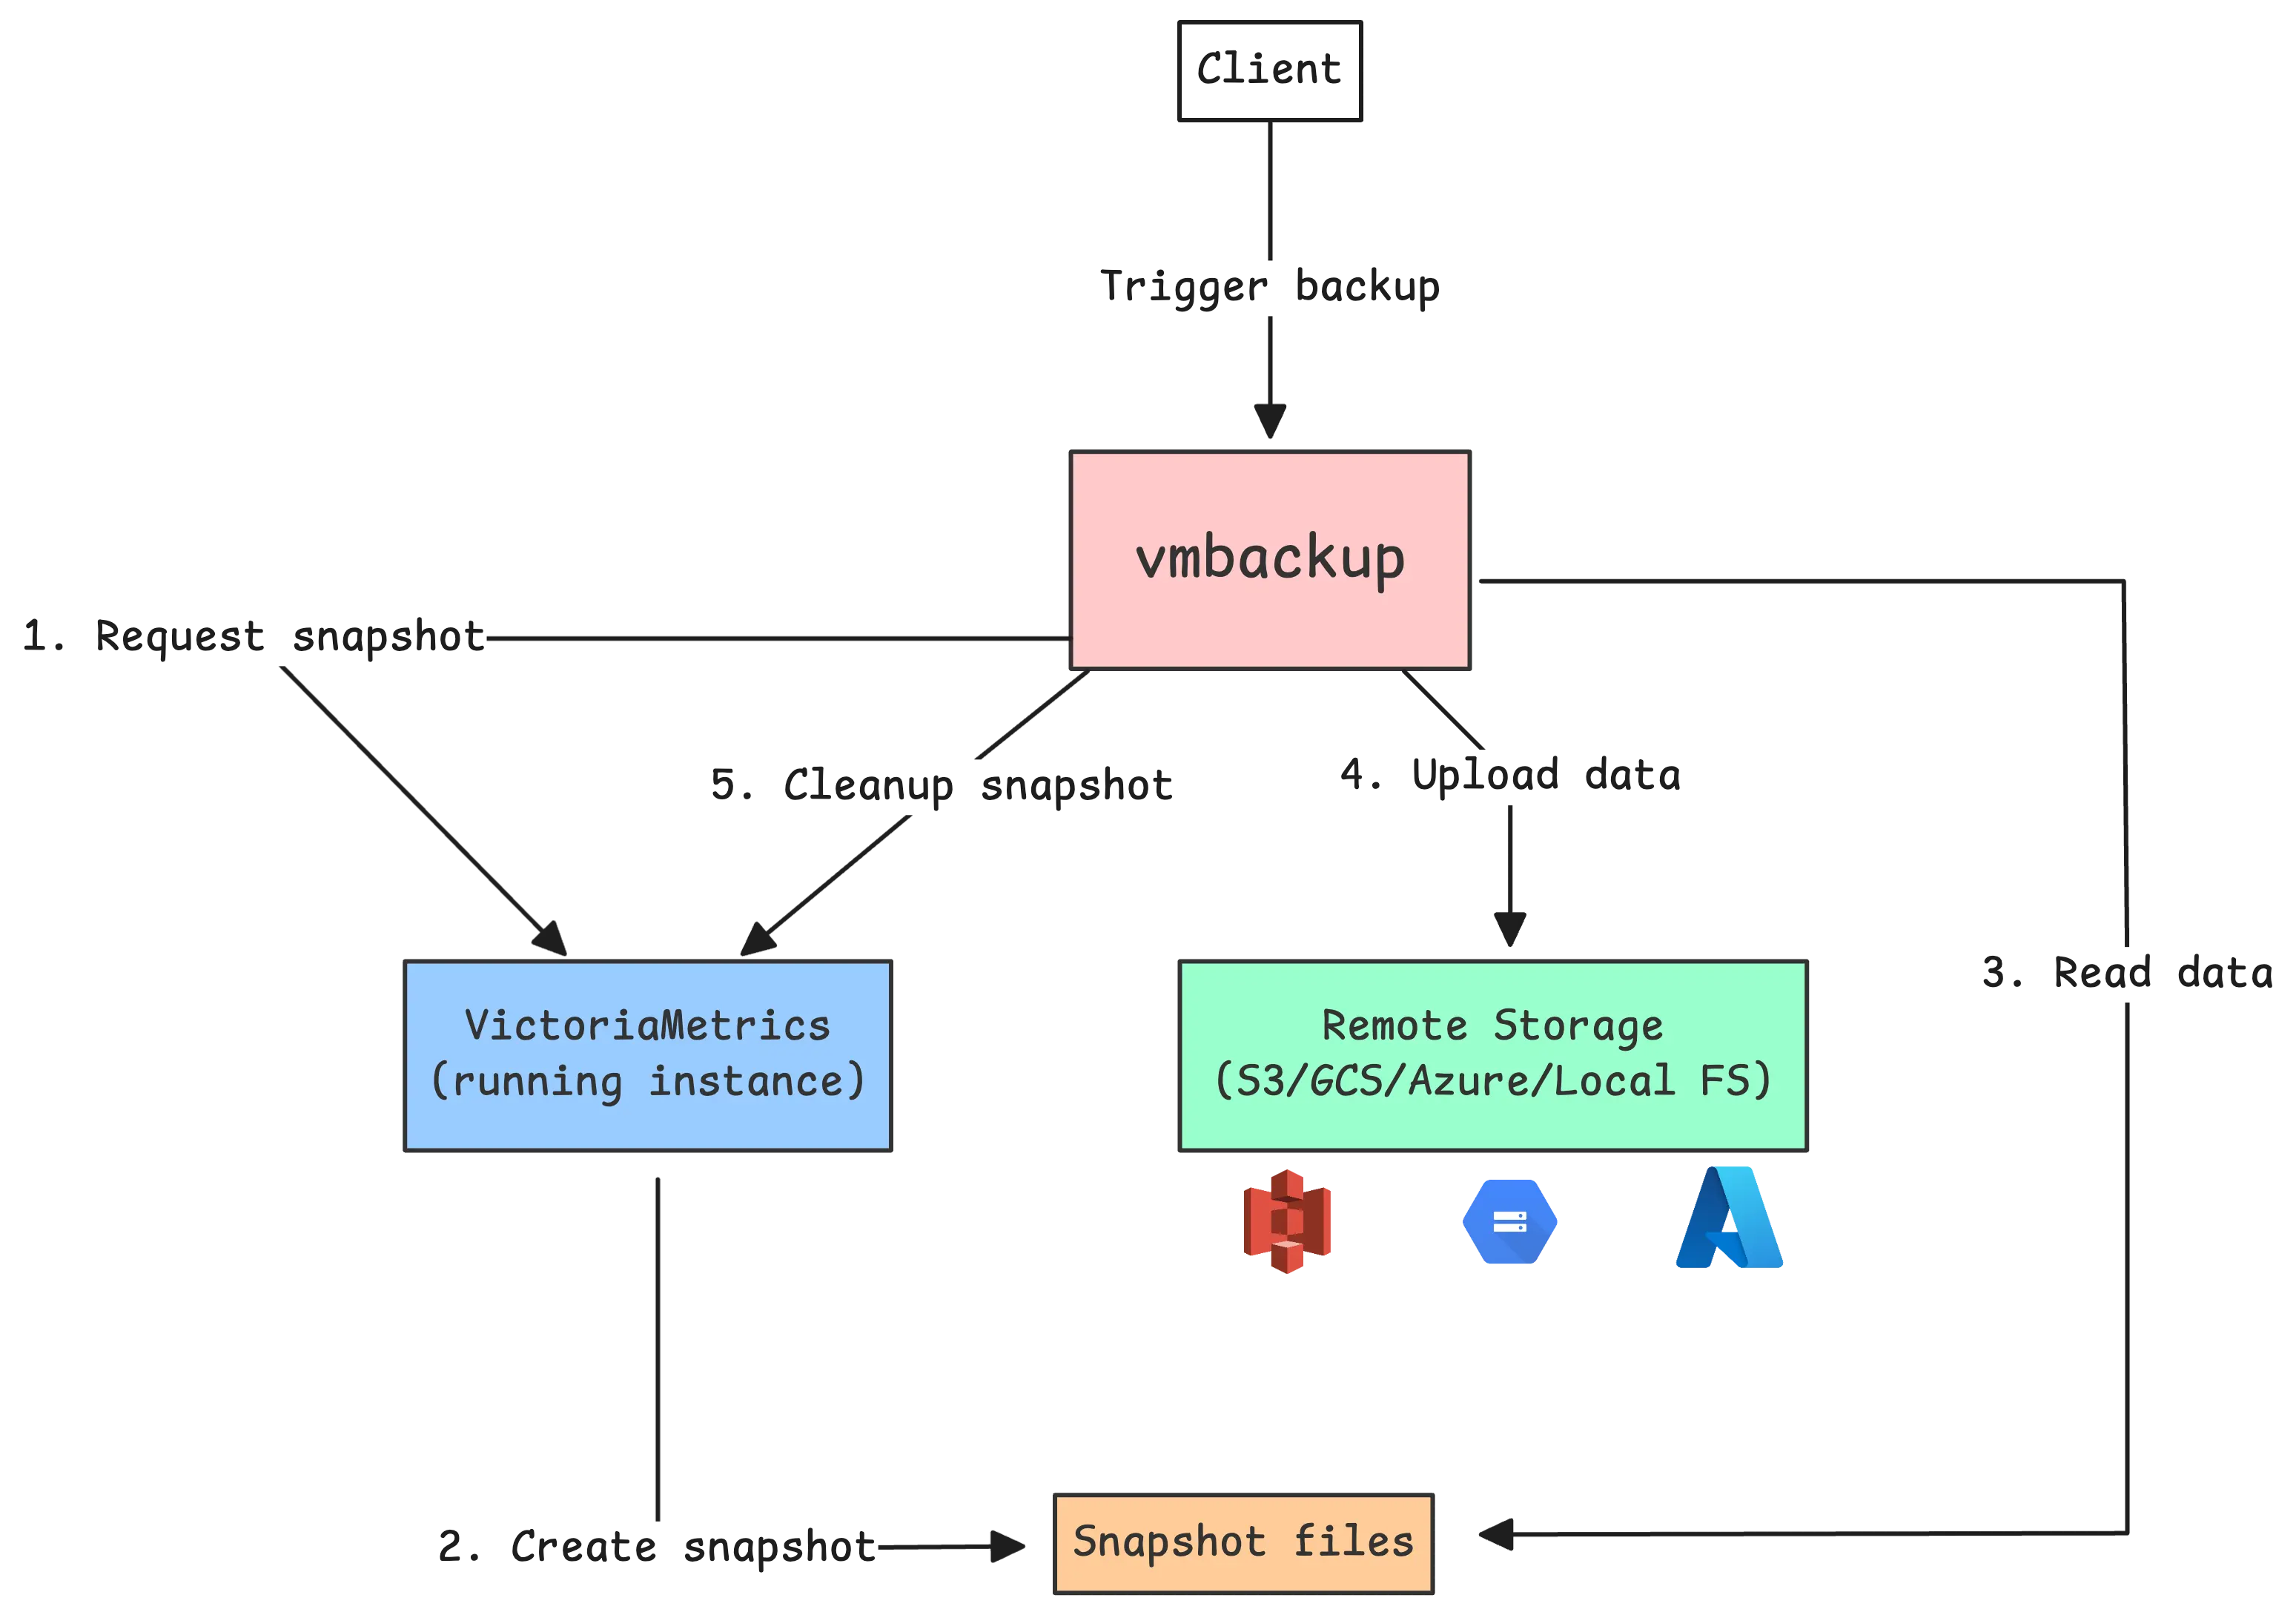
It supports full and incremental backups. If you point vmbackup to a destination that already contains a previous backup, it will automatically run an incremental backup. Only new or changed data is uploaded.
This helps save bandwidth and speeds up backup times, which is especially useful for large datasets. vmbackup supports a variety of storage options:
- Google Cloud Storage (GCS)
- Amazon S3
- Azure Blob Storage
- Any S3-compatible system like MinIO or Ceph
- Local filesystem
This gives you flexibility in how and where you store your backup data.
vmbackup is also fault-tolerant. If a backup is interrupted, you can restart it with the same parameters and it will resume from where it stopped.
To fully automate the backup process, VictoriaMetrics provides a companion tool called vmbackupmanager. It manages backup schedules and retention policies for hourly, daily, weekly, and monthly backups using a rotation model similar to traditional backup systems.
vmbackupmanager (Enterprise): Automate Backup Rotation
#
While vmbackup is useful for creating one-time backups, vmbackupmanager (Enterprise) solves the full backup lifecycle for time-series databases. It automates the entire process using a backup rotation model that is familiar to system administrators and database teams.
For teams managing VictoriaMetrics deployments, vmbackupmanager removes the need to build and maintain custom scripts or cron jobs. It takes care of:
- scheduling backups
- creating snapshots
- performing incremental backups
- verifying backup integrity
- cleaning up old backups based on retention rules
For important backups that must be preserved, vmbackupmanager offers a locking feature. You can mark backups as “locked” so they are not deleted by the retention policy.
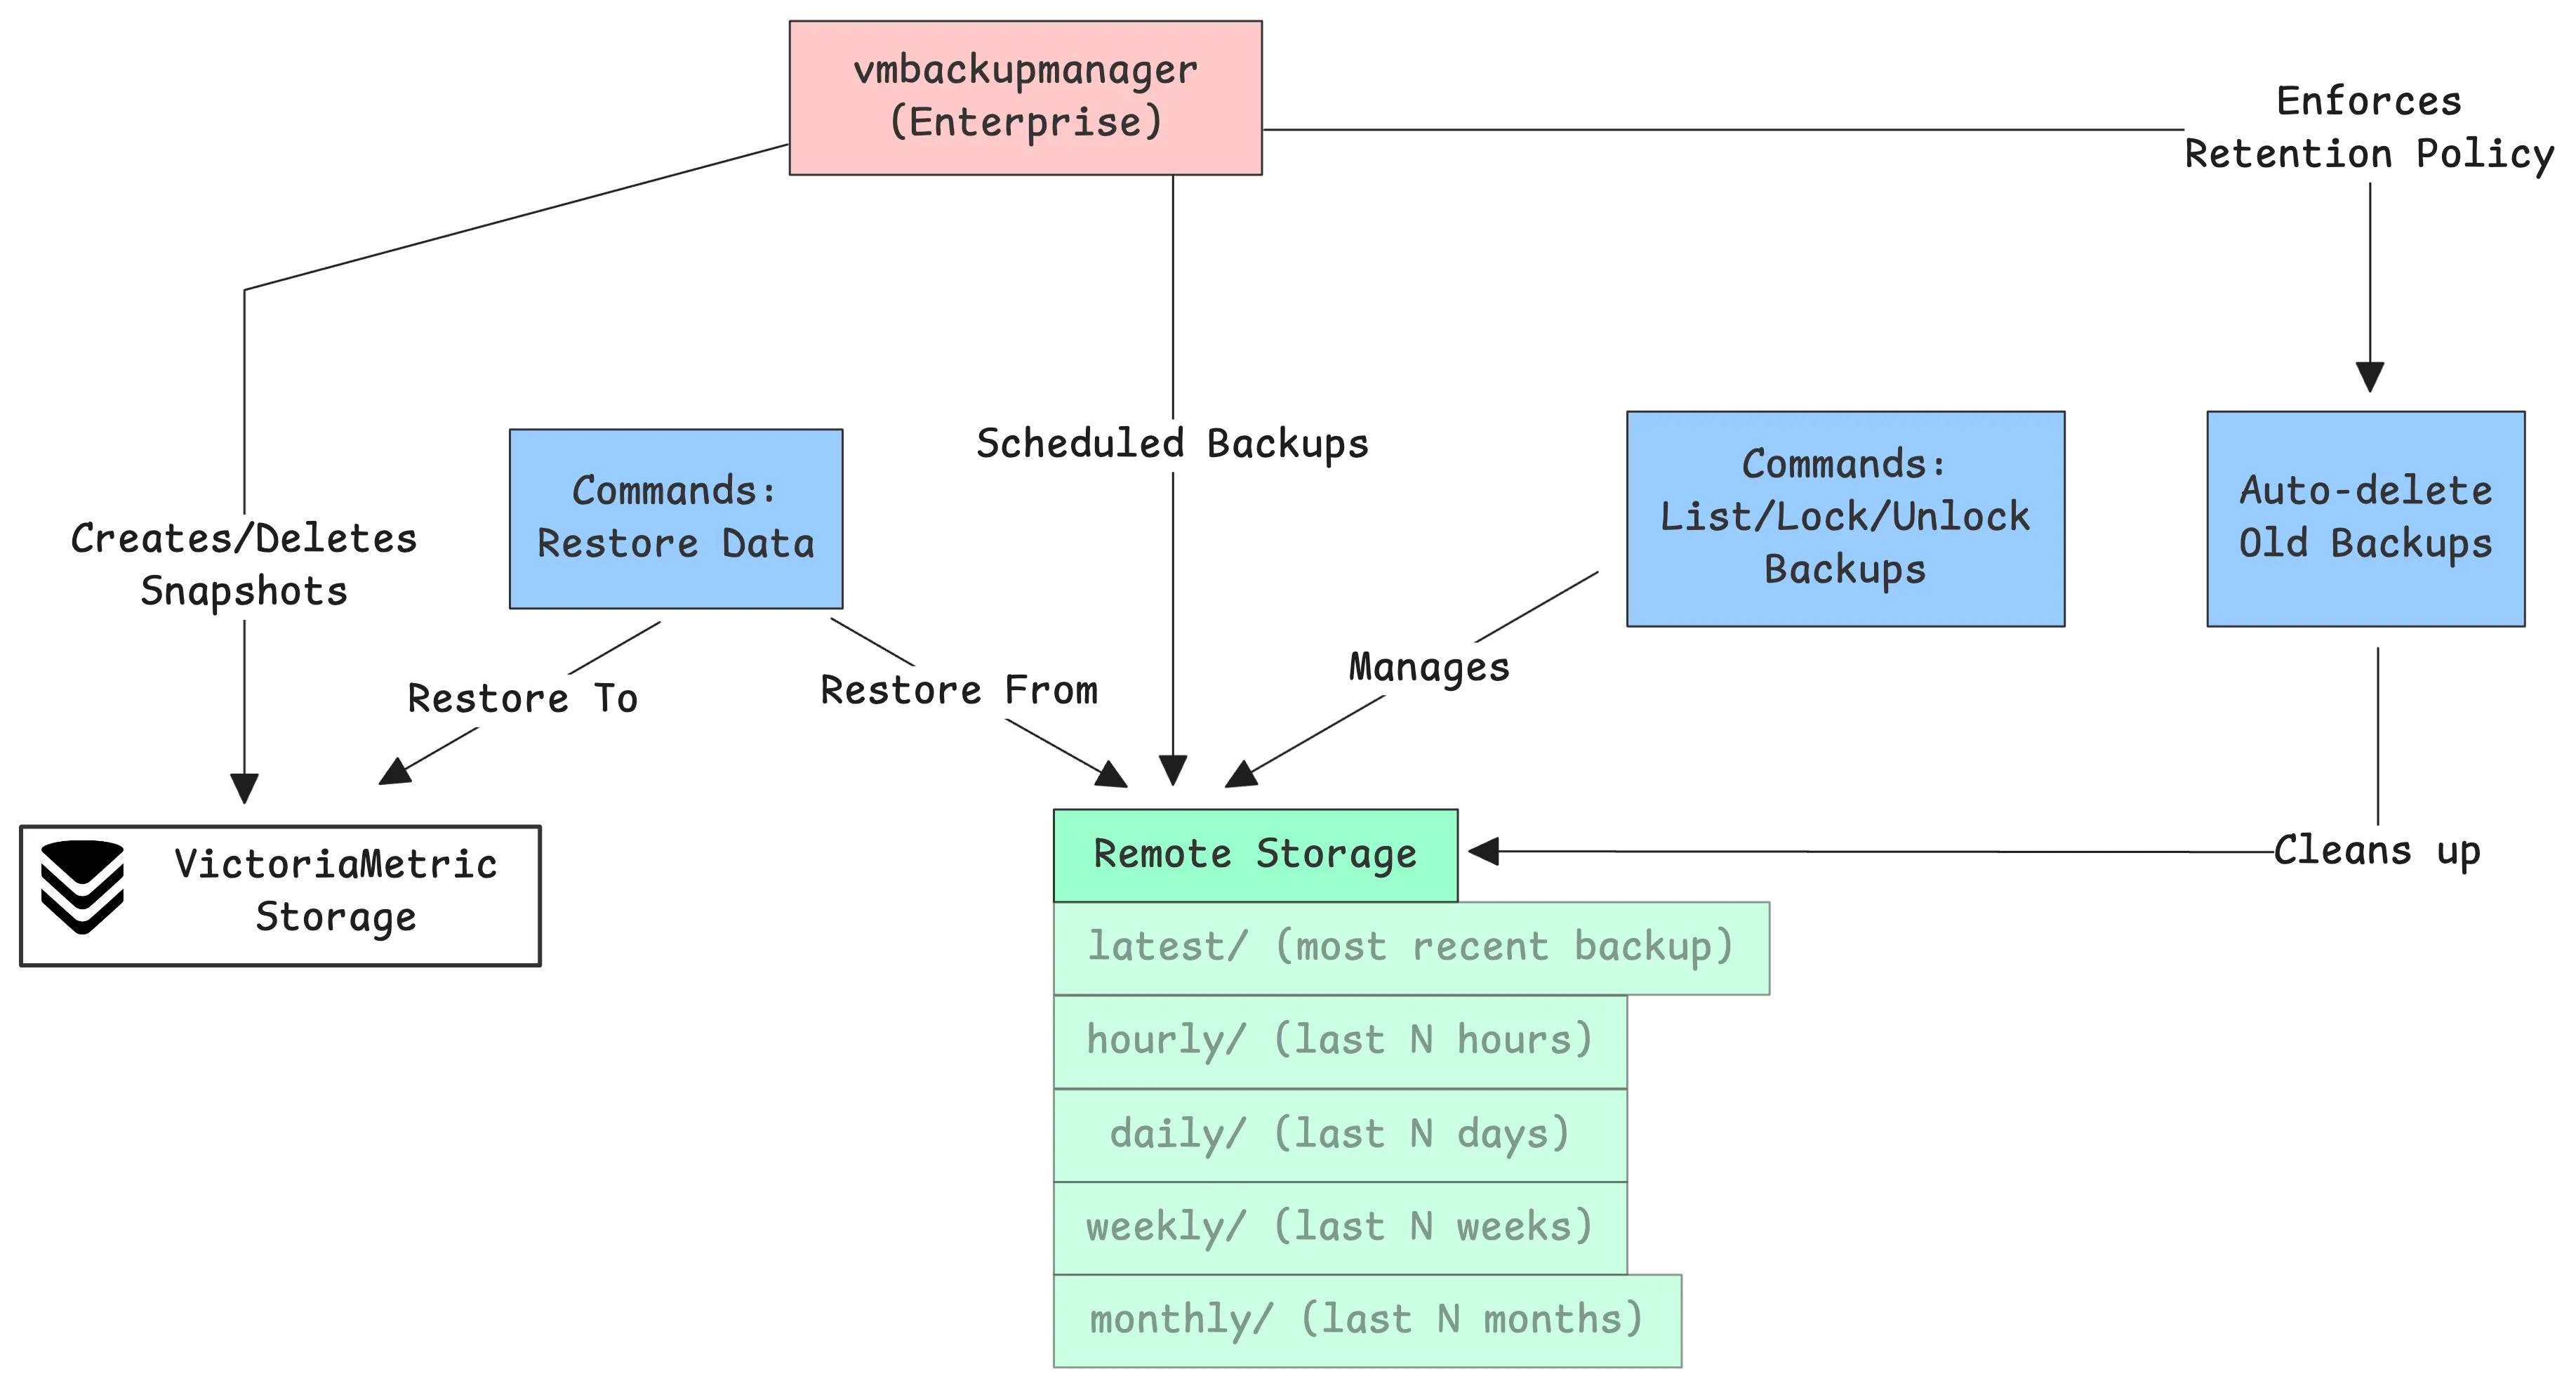
vmbackupmanager also supports built-in restore. You can define a “restore mark” to select the backup you want to recover, and the system will handle the restore process automatically.
vmrestore: Restore from Backup
#
vmrestore restores backups created by vmbackup to a VictoriaMetrics instance.
It is important to run vmrestore only when the VictoriaMetrics server is stopped. The tool needs exclusive access to the data directory to ensure a reliable and consistent restore process.
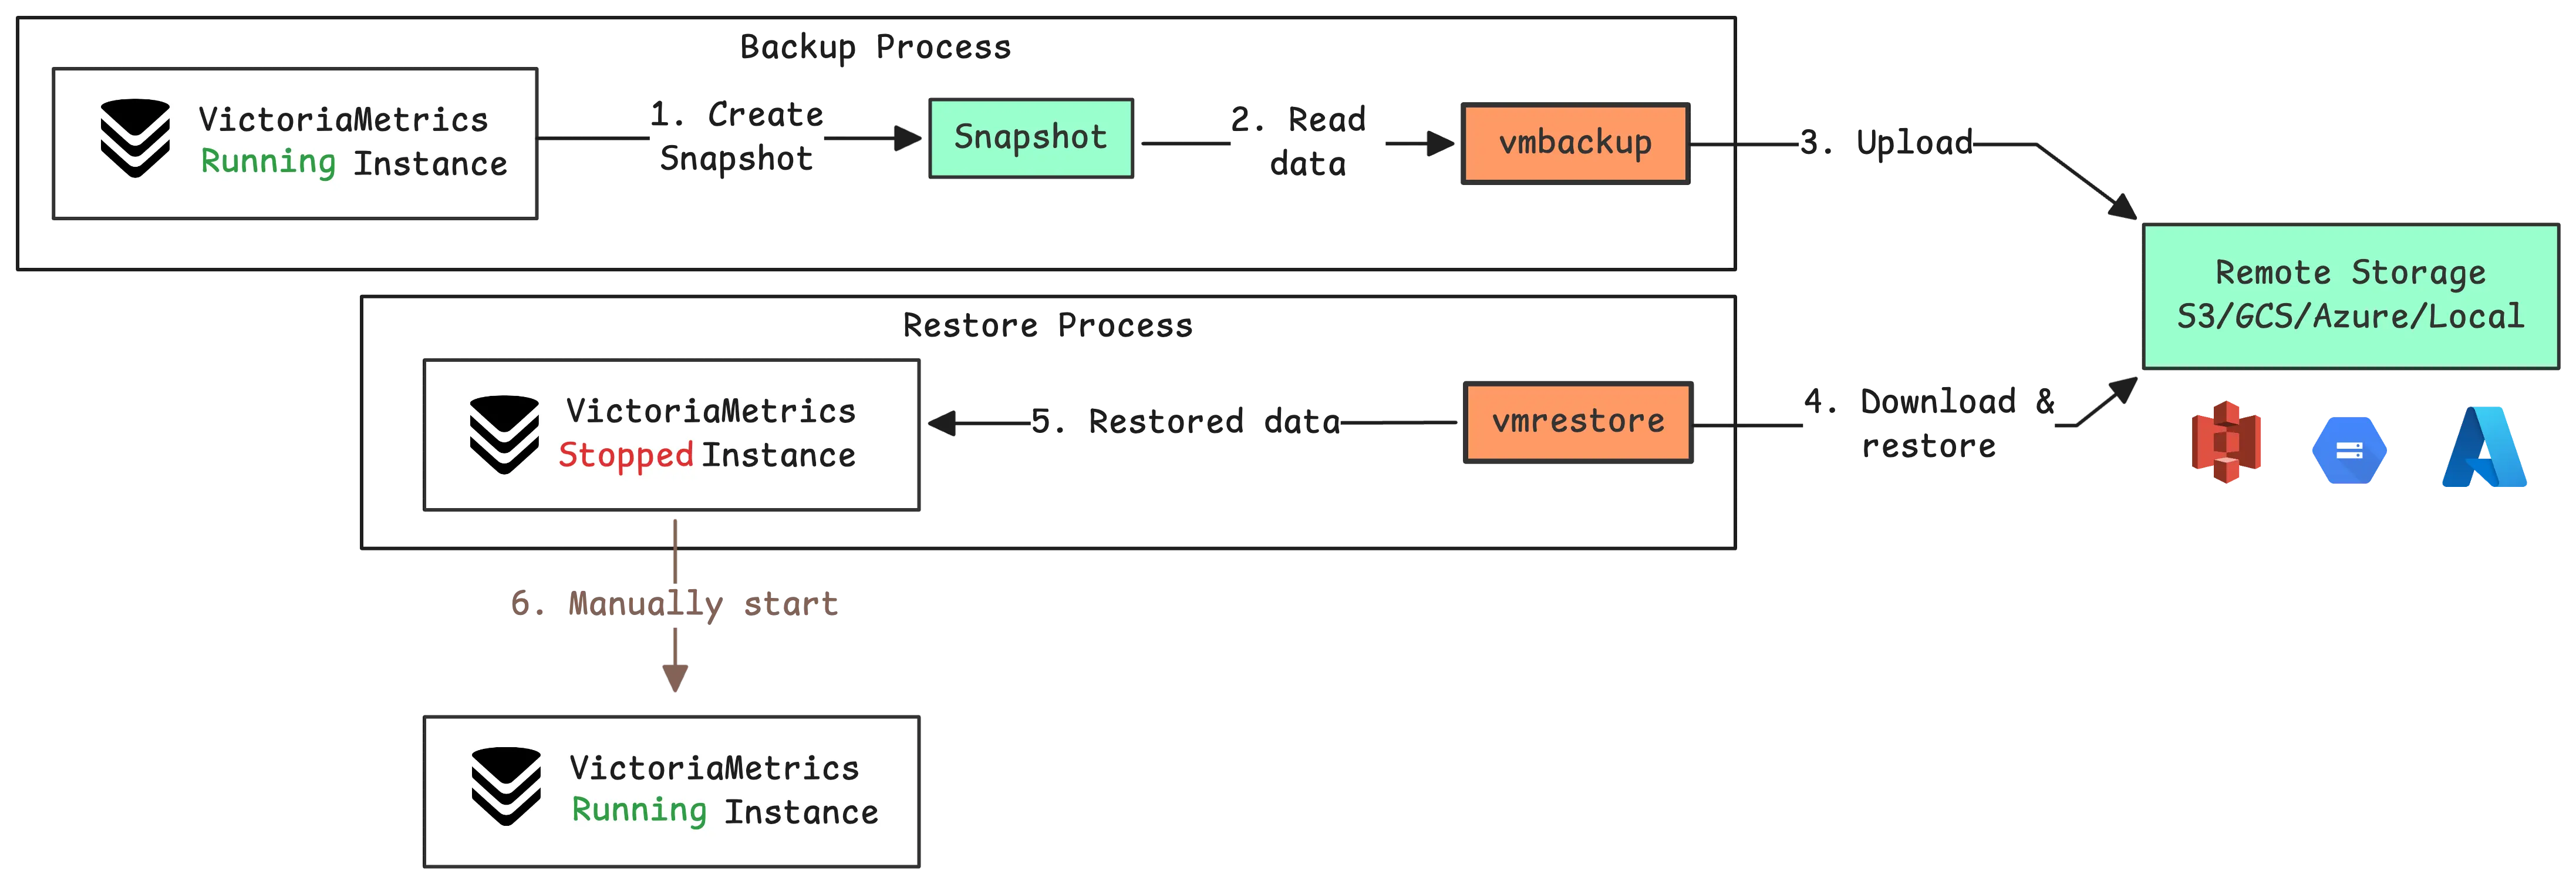
Like vmbackup, vmrestore supports incremental restore and is resilient to interruptions. If the process is stopped, it can be restarted and will continue from where it left off. For large-scale environments, vmrestore supports parallel processing using the -concurrency parameter.
vmalert: Alerting and Recording
#
vmalert is the alerting and rule evaluation tool in the VictoriaMetrics ecosystem. It performs two main tasks:
- Running alerting rules that send notifications to systems like Alertmanager, Slack, email, or PagerDuty
- Running recording rules to precompute common metrics and reduce query load
Once configured, vmalert connects to your VictoriaMetrics storage and runs scheduled queries. Based on the results, it triggers alerts or records new metrics:
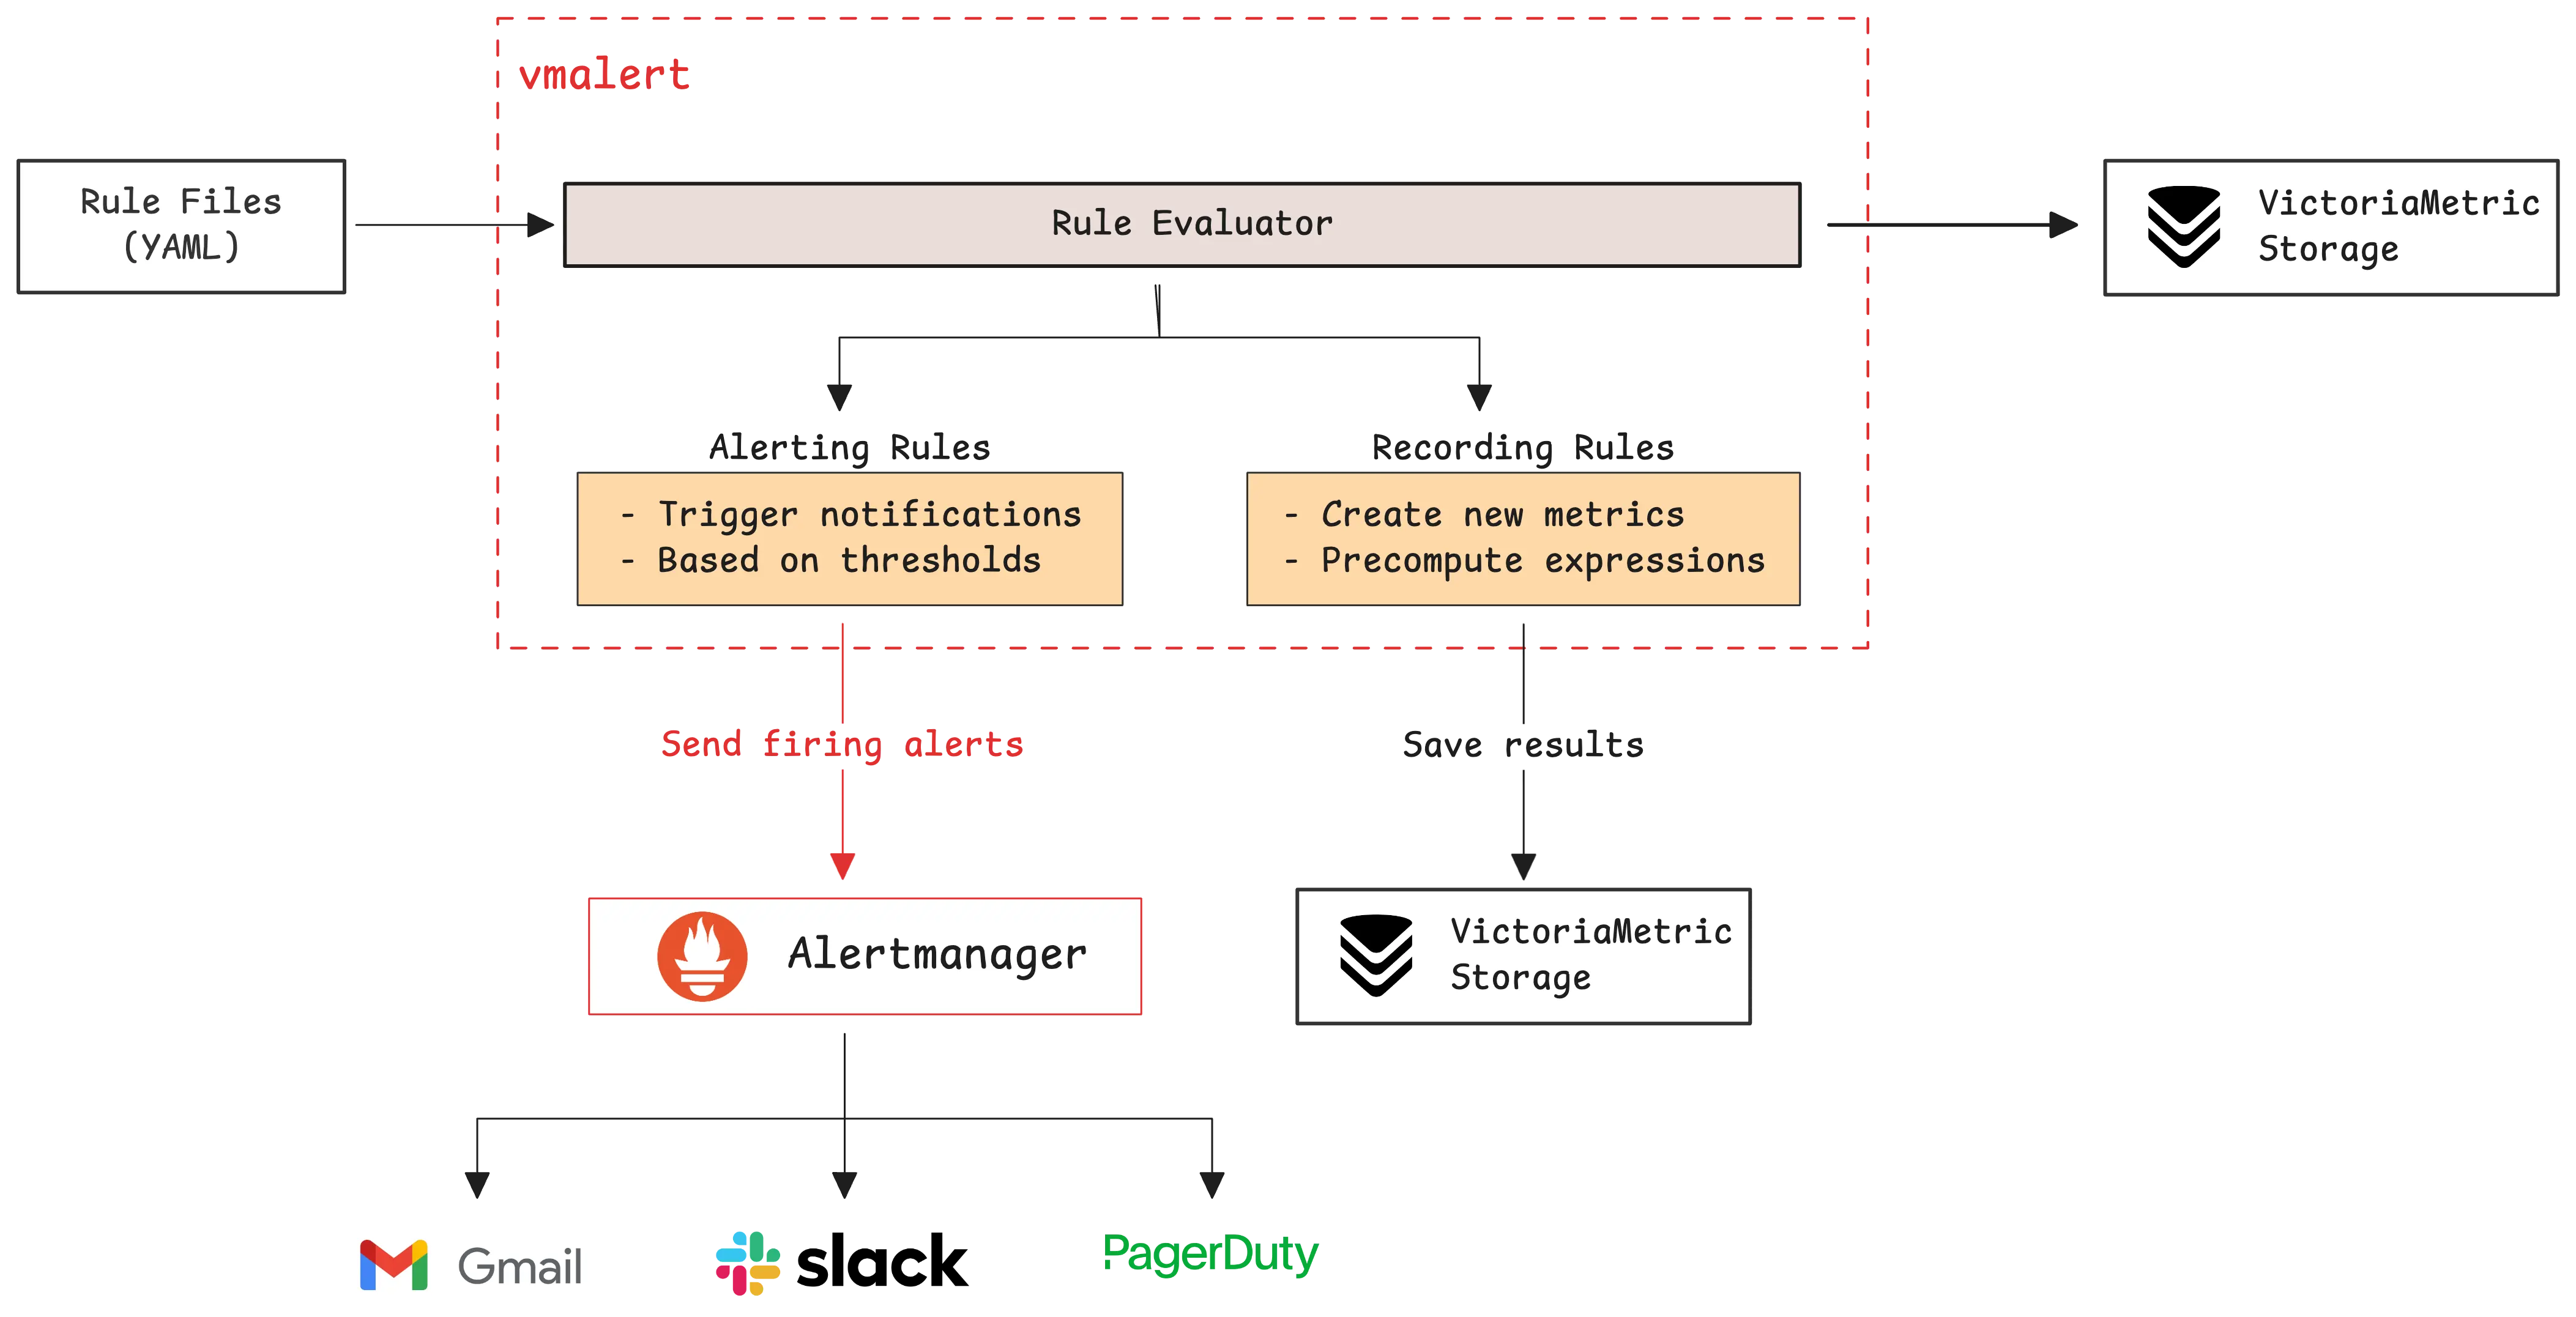
The tool is lightweight and can be scaled horizontally. You can run multiple vmalert instances with different rule files. This allows better organization of rules and adds redundancy.
By default, vmalert does not remember previous alert states after a restart. To keep alert history across restarts, configure it with -remoteWrite.url and -remoteRead.url pointing to your VictoriaMetrics instance. This setup keeps alerts active and consistent after restarts.
vmctl: CLI Tool for Migration
#
vmctl is the official command-line tool for migrating data into VictoriaMetrics. It supports a wide range of source systems including Prometheus, Thanos, Cortex, Mimir, InfluxDB, OpenTSDB, Promscale, and even other VictoriaMetrics instances.
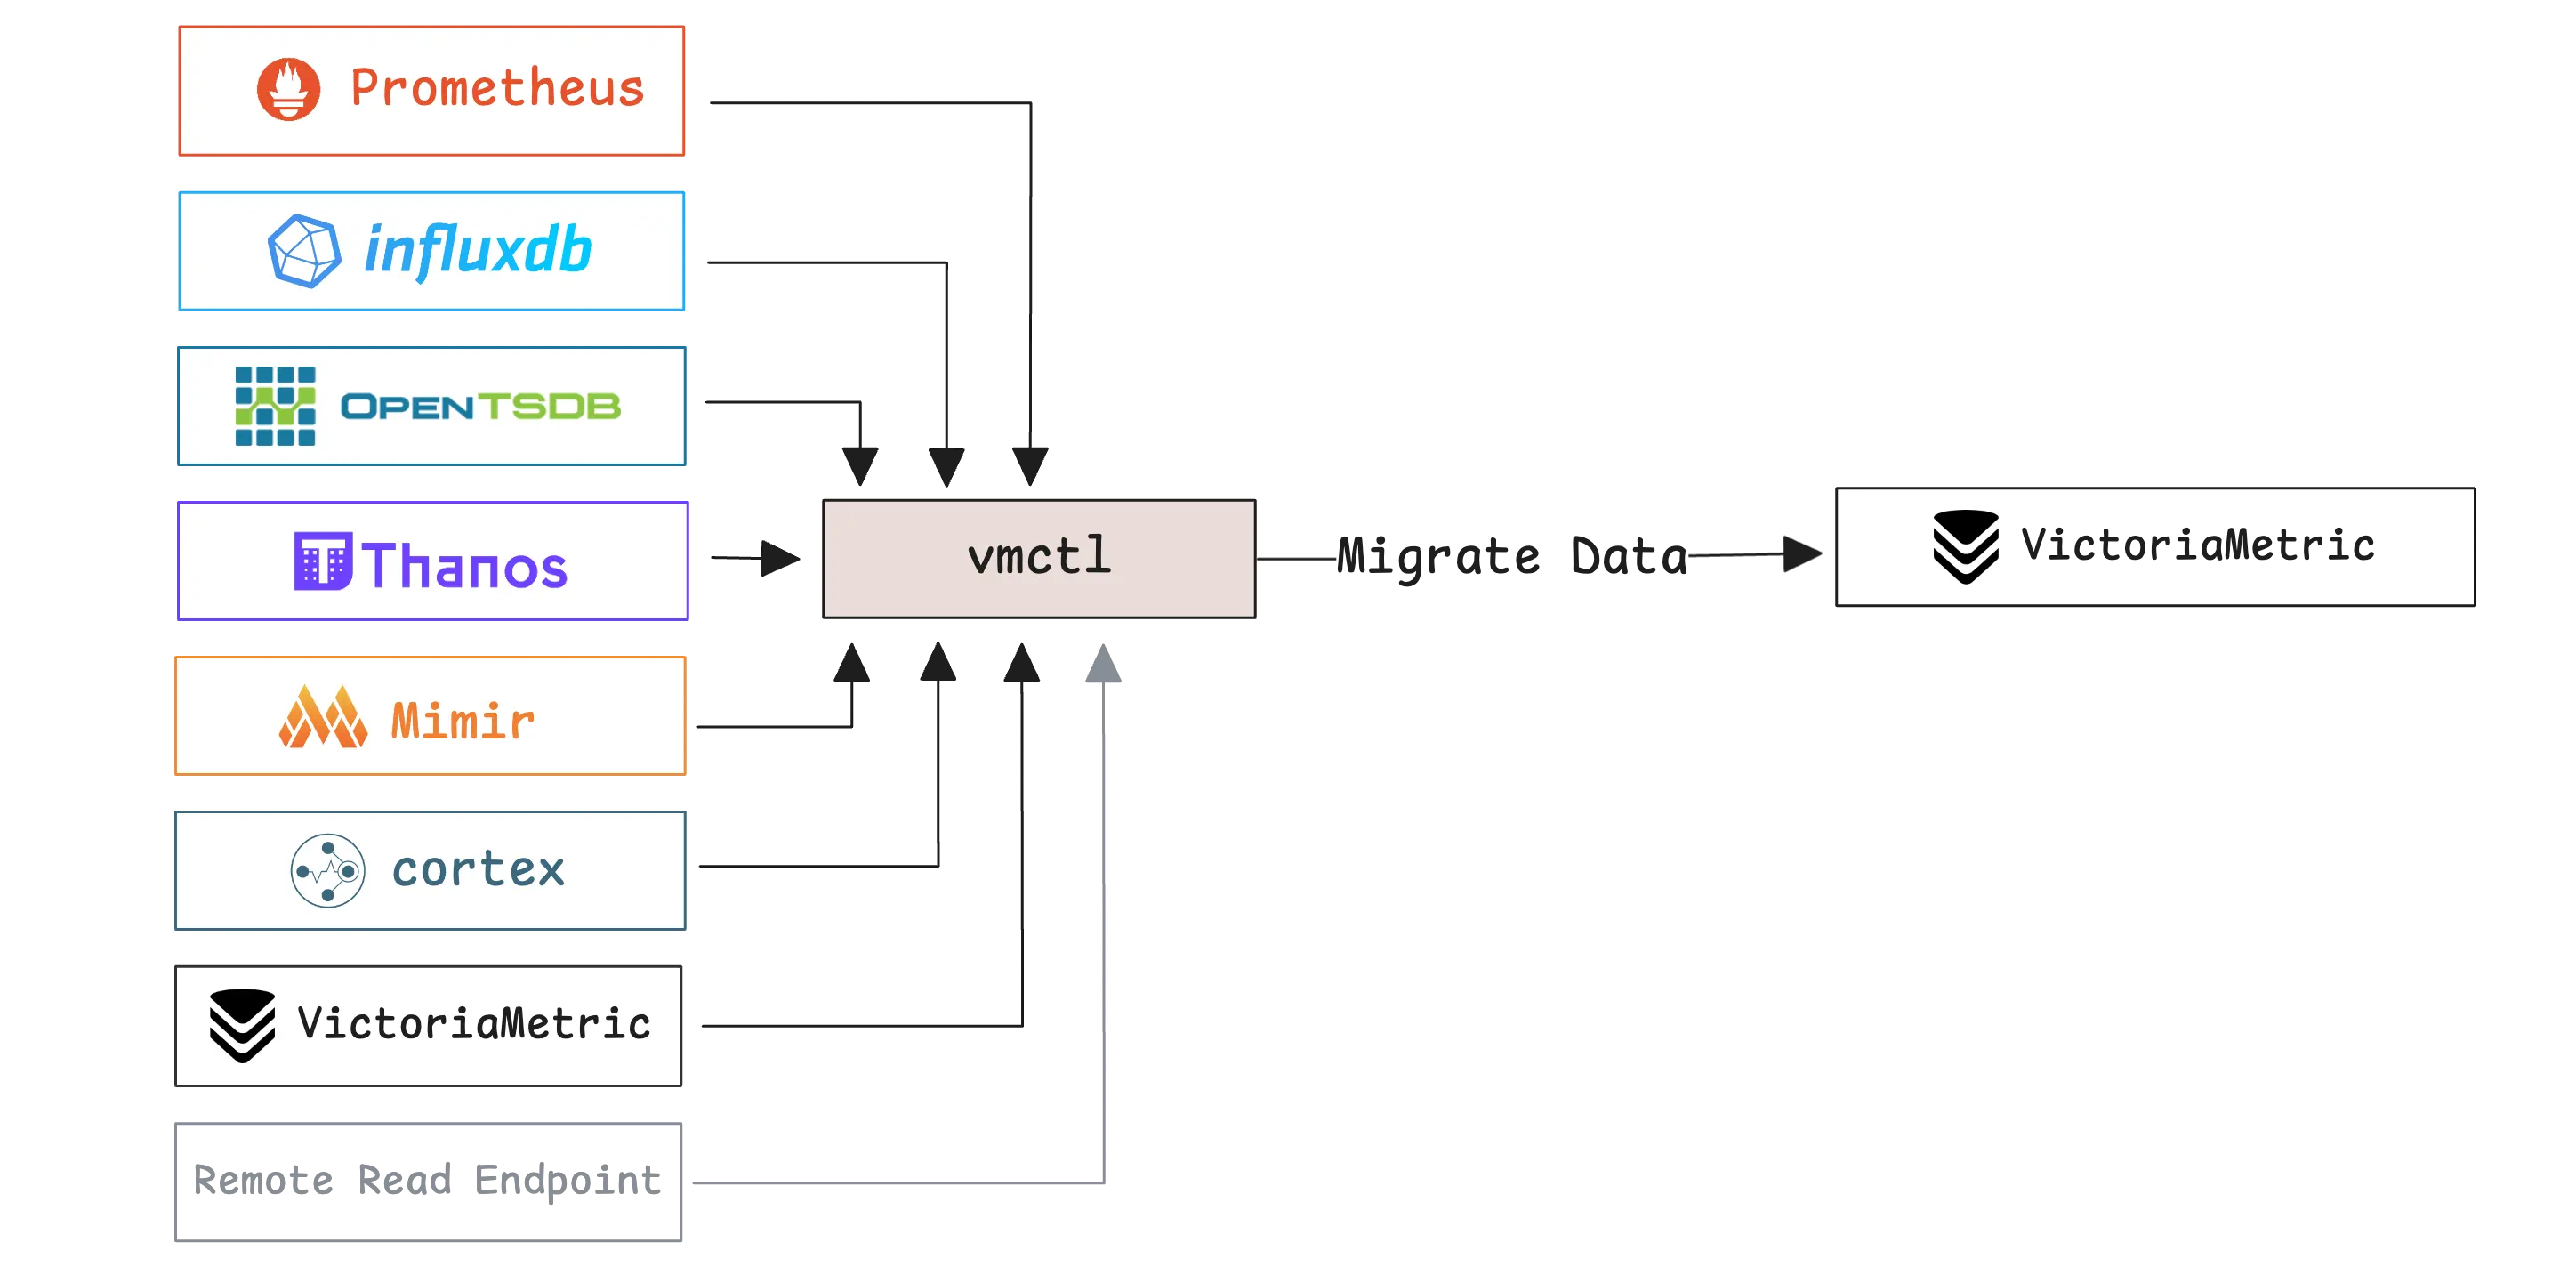
You do not need to migrate all data at once. vmctl allows partial migration based on specific filters:
- Time range: Choose a start and end time to limit the data you import
- Label values: Only include time series that match certain label conditions
- Metric names: Filter by metric names, which are stored under the
__name__label
You can also add new labels to each time series during the migration process.
In addition to data migration, vmctl includes verification features. It can check the integrity of exported data blocks from VictoriaMetrics to make sure they are complete and correct before importing them elsewhere.
Who We Are
#
Need to monitor your services to see how everything performs and to troubleshoot issues? VictoriaMetrics is a fast, open-source, and cost-efficient way to stay on top of your infrastructure’s performance.
If you come across anything outdated or have questions, feel free to send me a DM on X (@func25).
Leave a comment below or Contact Us if you have any questions!
comments powered by Disqus