- Blog /
- VictoriaMetrics February 2026 Ecosystem Updates
VictoriaMetrics February 2026 Ecosystem Updates
Share:


This month, we’re thrilled to see OpenAI using the VictoriaMetrics Stack internally — including VictoriaMetrics, VictoriaLogs, and VictoriaTraces — in their Harness engineering experiment, as shown in their architecture diagram.
It’s a great way of combining observability and AI agents. The article is worth a read, but in short, they are setting up a temporary, isolated observability stack to provide Codex with metrics, logs, and traces to inform the AI and add valuable context to its coding loop. A unified stack delivers the scalability needed for ephemeral, AI-first workflows like those at OpenAI.
If you wish to replicate their setup, Alexander’s complete guide on observing AI agents using OpenTelemetry and VictoriaMetrics is the best starting point.
This roundup covers releases for:
VictoriaMetrics v1.136.0 and v1.135.0
#
What’s new in VictoriaMetrics?
- New LTS line: v1.136 LTS is released, marking the end of support for v1.110 LTS.
- Improved reliability and stability: addressing all known partition index issues and enhancing ingestion from slow or unreliable clients.
- Enhanced VMUI visibility: introducing Top Queries by memory usage, context‑aware label autocomplete, and an improved drilldown panel that links directly to related source code.
- More flexible vmagent and vmauth configuration: including per‑backend write queues, buffered proxying, and proactive alerts for low queue space.
- Optimized performance and usability: with smarter OpenTelemetry streaming, proxy environment variable support, and direct source code links from Grafana dashboards.
VictoriaMetrics v1.136.0 has been released
- New LTS line v1.136 has been started: this means v1.110 LTS has reached end of life and is no longer supported.
- Improved stability for pt-index: all known issues related to the partition index, which was introduced in v1.133.0, were addressed.
- Top queries by memory usage in VMUI: the Top Queries page now exposes queries with the highest average memory usage, adding a memory-based dimension to query analysis.
- Context-aware suggestions in VMUI: label autocomplete now takes already selected label filters into account, reducing noise in high-cardinality environments.
- Streaming OpenTelemetry ingestion: large OpenTelemetry requests are now streamed with proper buffer reuse and reset, lowering peak memory usage.
- Proxy environment variables support: all components now properly honor standard proxy variables
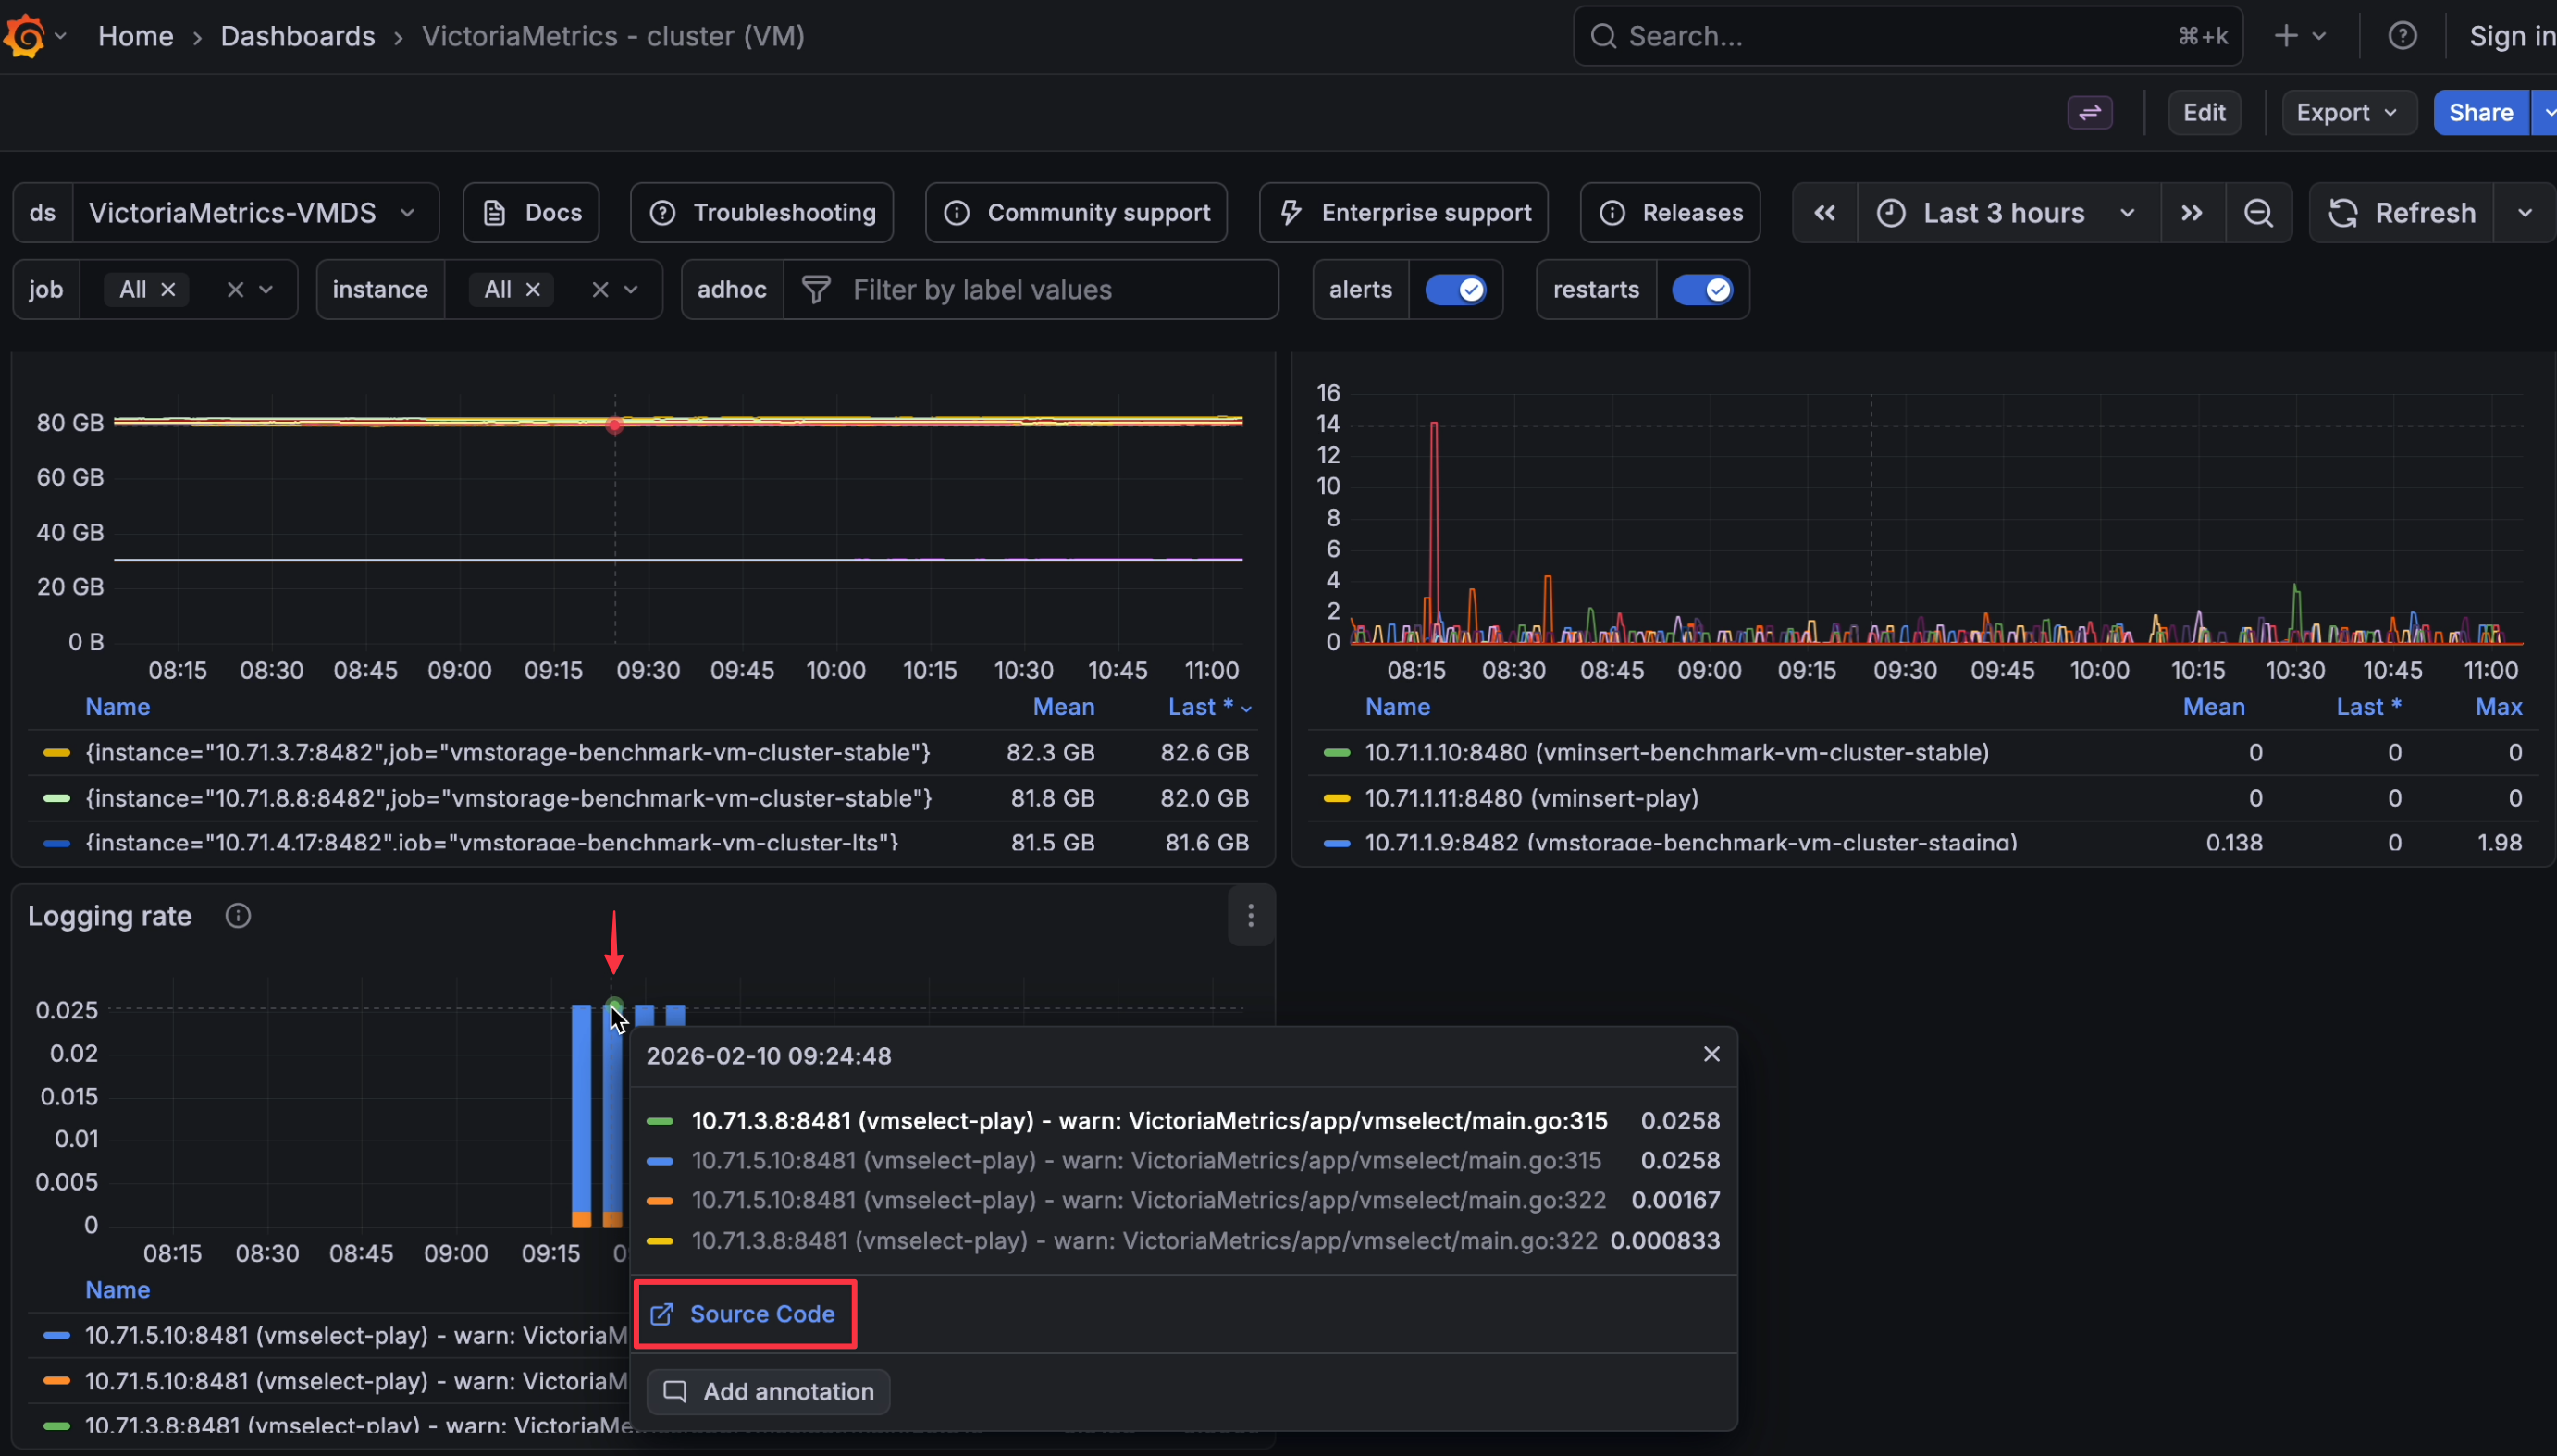
HTTP_PROXY,HTTPS_PROXY, andNO_PROXY. - View related source code in Logging rate panel: the
Logging ratedrilldown panel in the Grafana dashboard links directly to the corresponding source code. - Multiple bug fixes and stability improvements across VictoriaMetrics components: including security updates to Go 1.26.0 and the base Alpine image.
Check the full changelog for all changes.
Highlights for v1.135.0
- More reliable ingestion from slow or external clients: vmauth can now buffer request bodies before forwarding them upstream. This prevents slow clients (e.g., IoT devices over poor networks) from exceeding concurrency limits and causing ingestion drops, even when backend capacity is available.
- Simpler vmagent setups for mixed backends: vmagent now supports different
-remoteWrite.queuesvalues per remote write URL. You can safely use a single vmagent instance for backends with strict ordering requirements (e.g., Mimir) and for VictoriaMetrics. Previously, users needed multiple agents to achieve the same result. - Early warning before data loss: new vmagent alerts notify you 12 hours and 4 hours before the persistent queue runs out of space, giving time to react before metrics start getting dropped.
- Correct scrape size enforcement:
-promscrape.maxScrapeSizeis now applied to decompressed data. This makes scrape size limits predictable and prevents oversized payloads from slipping through due to compression. - Correct
changes()with variable scrape intervals: MetricsQLchanges()function now behaves correctly when scrape intervals increase (e.g., from 30s to 60s), avoiding false positives where no real value change occurred. Important for queries that measure restarts. - Other stability and correctness improvements.
See the changelog for the full list.
VictoriaLogs v1.46.0, v1.45.0, and v1.44.0
#
What’s new in VictoriaLogs?
- Better ingestion scalability: ingestion throughput scales more efficiently on high-CPU servers.
- Kubernetes Collector stream tuning: new option (
-kubernetesCollector.streamFields) lets you customize the default_streamfield composition, giving operators direct control over log stream cardinality and grouping in busy clusters. - Query & API stability: fields now sort alphabetically by default for more predictable outputs.
- Snapshot management & auto-expiry: new
/internal/partition/snapshot/deleteand/internal/partition/snapshot/delete_stale?max_age=<d>endpoints allow deleting individual partition snapshots and bulk-removing stale ones by age. New-snapshotsMaxAgeflag enables automatic snapshot expiry. - Web UI: enhanced Table View with resizable and reorderable columns, improved Group View, group-by toggle clears grouping, and hits chart defaults to
nonegrouping. - JSON nested objects: JSON ingestion can now preserve selected nested objects via
preserve_json_keys=...(query arg) orVL-Preserve-JSON-Keys: ...(HTTP header), preventing dynamic keys from being flattened and inflating cardinality.
Highlights for VictoriaLogs v1.46.0
- Query field ordering: Query responses now return fields in a stable alphabetical order by default, unless you explicitly define the output order (for example, via
fieldsorstats), making API outputs more predictable for scripts, dashboards, and CLI use. - vlagent JSON Lines output: vlagent now supports log delivery in jsonline format via
-remoteWrite.format=jsonlineon a per-remote-destination basis, enabling easier direct forwarding to systems such as Vector, Fluent Bit, or ClickHouse over HTTP. - Web UI table view: table view in the Web UI now supports column resizing and drag-and-drop reordering, and it persists column layout preferences so operators can keep a practical table layout across sessions.
- Web UI group view: the group view in the Web UI now has a more polished interaction and uses zebra-row styling, making dense group listings easier to scan and requiring less visual effort.
- Web UI hits charts: the hits chart defaults to non-grouping, so the initial view shows total hits, while field-based splits appear only when explicitly selected.
- Web UI group-by behavior: clicking an already active group-by field now clears grouping instead of resetting to
_stream, which better matches iterative investigation workflows. - Web UI Log Context modal improvements: the Log Context modal now includes stream field chips, so nearby lines returned by
stream_contextqueries display related stream metadata for easier context inspection.
Check out the changelog for the full details.
Highlights for v1.45.0
- Source code links in Grafana dashboard: the
VictoriaLogs internal loggingpanel lets you jump to the code location that printed the message. - Quality-of-life improvements for Grafana dashboards: clearer descriptions, better behavior with the Prometheus datasource, and a cluster variable to select every component in the cluster more easily.
- LogsQL adds
ipv6_rangefilter: lets you filter logs by IPv6 using a range or CIDR (e.g.,client_ip:ipv6_range("2001:db8::/112")). - New timezone offset option: the
/select/logsql/stats_query_rangeAPI now accepts an optionaloffset(timezone offset). This aligns “group stats by time buckets” with your timezone. - Better ingestion on high-CPU hardware: ingestion scales even better on large servers with many CPU cores, enabling high-volume pipelines to push more logs under load.
- Offset is shown in the Web UI: the UI now shows offset in the bar-chart data, so bars line up with the selected timezone.
- New keyboard shortcuts: the Web UI query editor supports
Ctrl/Cmd+/to comment or uncomment lines.
See the changelog for more information.
Improvements in VictoriaLogs v1.44.0
- Partition snapshot deletion: new
/internal/partition/snapshot/delete?path=<snapshot-path>endpoint deletes specific partition snapshots, making it easier to clean up finished backups and reclaim disk space. - Bulk stale snapshot removal: new
/internal/partition/snapshot/delete_stale?max_age=<d>endpoint bulk-removes old snapshots by age (e.g.,max_age=1d), ideal for scheduled housekeeping jobs to prevent snapshot buildup. - Automatic snapshot expiry:
-snapshotsMaxAgeenables automatic periodic removal of snapshots, keeping storage usage predictable in long-running environments without needing external cron jobs. - Enhanced snapshot creation: the
/internal/partition/snapshot/createAPI now supportspartition_prefixfor matching multiple daily partitions (e.g.,partition_prefix=202601), simplifying monthly or yearly backup workflows. - Journald remote IP support:
-journald.useRemoteIPpersists the sender’s IP address in theremote_ipfield, aiding audits, incident response, and distinguishing logs from different hosts or forwarders. - JSON nested objects: JSON ingestion preserves selected nested objects using
preserve_json_keys=...(query argument) orVL-Preserve-JSON-Keys: ...(HTTP header), useful for dynamic keys that would otherwise increase cardinality. - New Grafana dashboard: added VictoriaLogs - Logging State in the
victorialogs-internal.jsonfile in the repository for monitoring streams, fields, and ingestion behavior. - LogsQL pattern matching: added
pattern_match_prefix("...")andpattern_match_suffix("...")to anchor matches to field value start and end, improving classification and detection precision. - vlagent Kubernetes stream tuning: Kubernetes Collector supports
-kubernetesCollector.streamFieldsto customize default_streamcomposition, controlling cardinality and grouping in busy clusters. - Nanosecond query step precision: HTTP API accepts nanosecond
stepfor/select/logsql/hitsand/select/logsql/stats_query_range, enabling sub-millisecond bucketing. - Web UI autocomplete improvements: now shows pipe titles with links to LogSQL docs, speeding up query building and onboarding.
- Web UI hits bar cumulative view: adds option for cumulative hits view to spot ramp-ups and totals across time ranges.
- Web UI configurable bar count: hits chart allows configuring bar count to balance detail and readability by time window.
Read the changelog for all the details.
Full Changelogs
#
For the full details on each release, read the changelogs:
Thank you for using VictoriaMetrics — stay tuned for more updates.
Leave a comment below or Contact Us if you have any questions!
comments powered by Disqus