- Blog /
- What's new in VictoriaMetrics Anomaly Detection (Q3 2026)
What's new in VictoriaMetrics Anomaly Detection (Q3 2026)
Share:


Summary: This development cycle makes it easier to choose what to monitor, investigate a firing alert, and turn a tested detector into a deployment. VictoriaMetrics Anomaly Detection adds peer-group outlier detection, a workspace for related signals, tuning with marked anomalies, and links from alerts to persisted results. Dynamic presets and deployment sizing extend the AI-assisted workflow, while TLS, health checks, and runtime improvements help operate it. We pick up where the Q2 update ended: nine service releases, from v1.30.2 through v1.32.0. This includes the October and November follow-ups to Q3 work, rather than only releases within the calendar quarter.
Introduction
#
VictoriaMetrics Anomaly Detection (vmanomaly) is part of our Enterprise offering. It learns expected behavior from time series and writes anomaly scores back to VictoriaMetrics, where tools such as vmalert can turn them into alerts. Inputs can come from metrics or from metrics derived from logs and traces. The documentation explains the components and deployment options.
The Q2 update introduced Temporal Envelope and brought experimentation, Copilot and agent tools closer together. This cycle follows the next practical questions: Which signals should be compared? What did the detector see when an alert fired? Can I show it the incidents I care about? How much infrastructure will the resulting configuration need?
The aim is to make those decisions easier to test and explain, with the query, model, evidence and deployment files available for review.
Q3 highlights
#
Across the release range, the main additions are:
- A model-selection guide organized around operational questions and practical recipes.
- Investigation links from
vmalert, UI with multiple named queries, and dedicated multivariate and peer-group views. - Shared tuning with marked anomalies or an expected anomaly rate, plus guided UI tours for getting started and tuning a model with marks.
- Experimental resource and inference-capacity estimates, including access through MCP and skills.
- Dynamic presets that discover available signals and produce matching configuration, alert, and deployment files.
- UI v1.8.2 through v1.11.0, MCP v0.6.0, and the vmanomaly skills plugin, currently version 1.3.0.
- Direct HTTPS/mTLS for the UI and API, container health checks, and more predictable execution at scale.
Watch the anomaly-detection section of our Q3 community meetup, starting at 1:15:33. The recording covers the October 29 presentation; this article also includes the subsequent v1.32.0 release.
The Q2 meetup segment provides the background on Temporal Envelope and the earlier AI-assisted workflow. The linked series posts collect the previous updates and recordings.
Start with the question: what should be compared?
#
Choosing an algorithm is easier once the comparison is clear. The new choose-a-model guide connects common monitoring questions to starting configurations, expected behavior, and examples.
One metric over time: has this series changed relative to its own history? Lightweight online MAD or Z-score models suit simpler signals; seasonal models and Temporal Envelope cover richer recurring behavior. A request-rate spike during a predictable daily peak should be evaluated against that pattern.
Related signals together: has the relationship changed? For example, CPU and request volume may each be within their usual ranges while their combination is unusual. A multivariate model evaluates aligned channels and produces a joint score for the group.
Comparable peers: which member stands out right now? Replicas doing similar work can be compared with one another. A host diverging from its peers may be interesting even when its individual history does not provide a useful baseline.
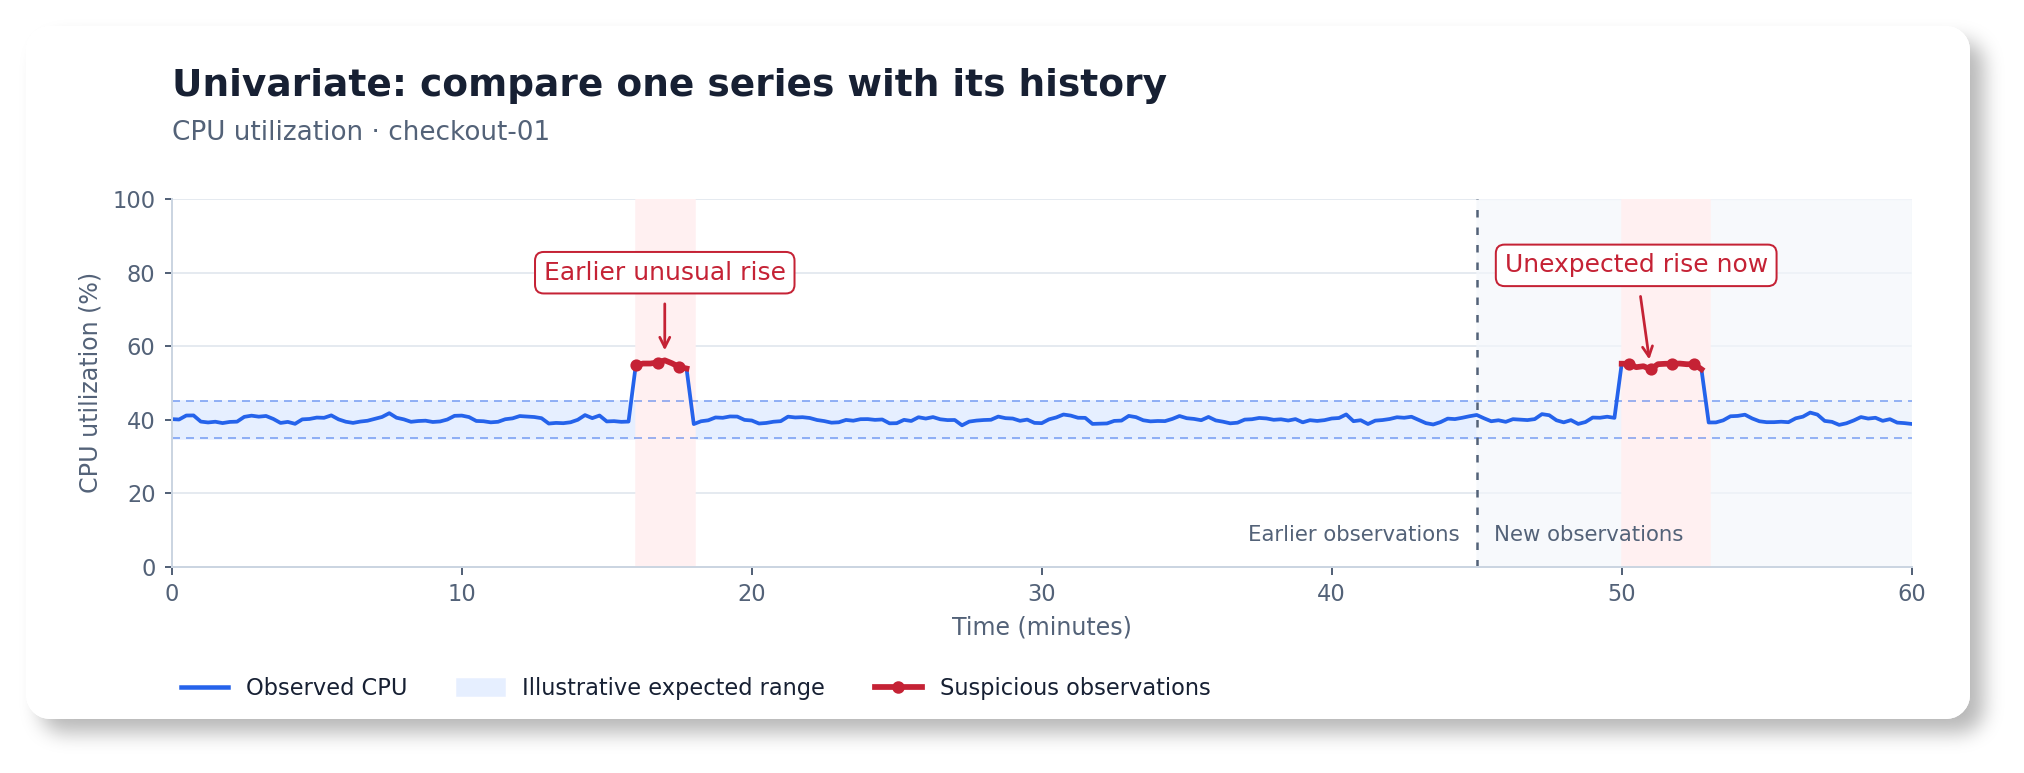
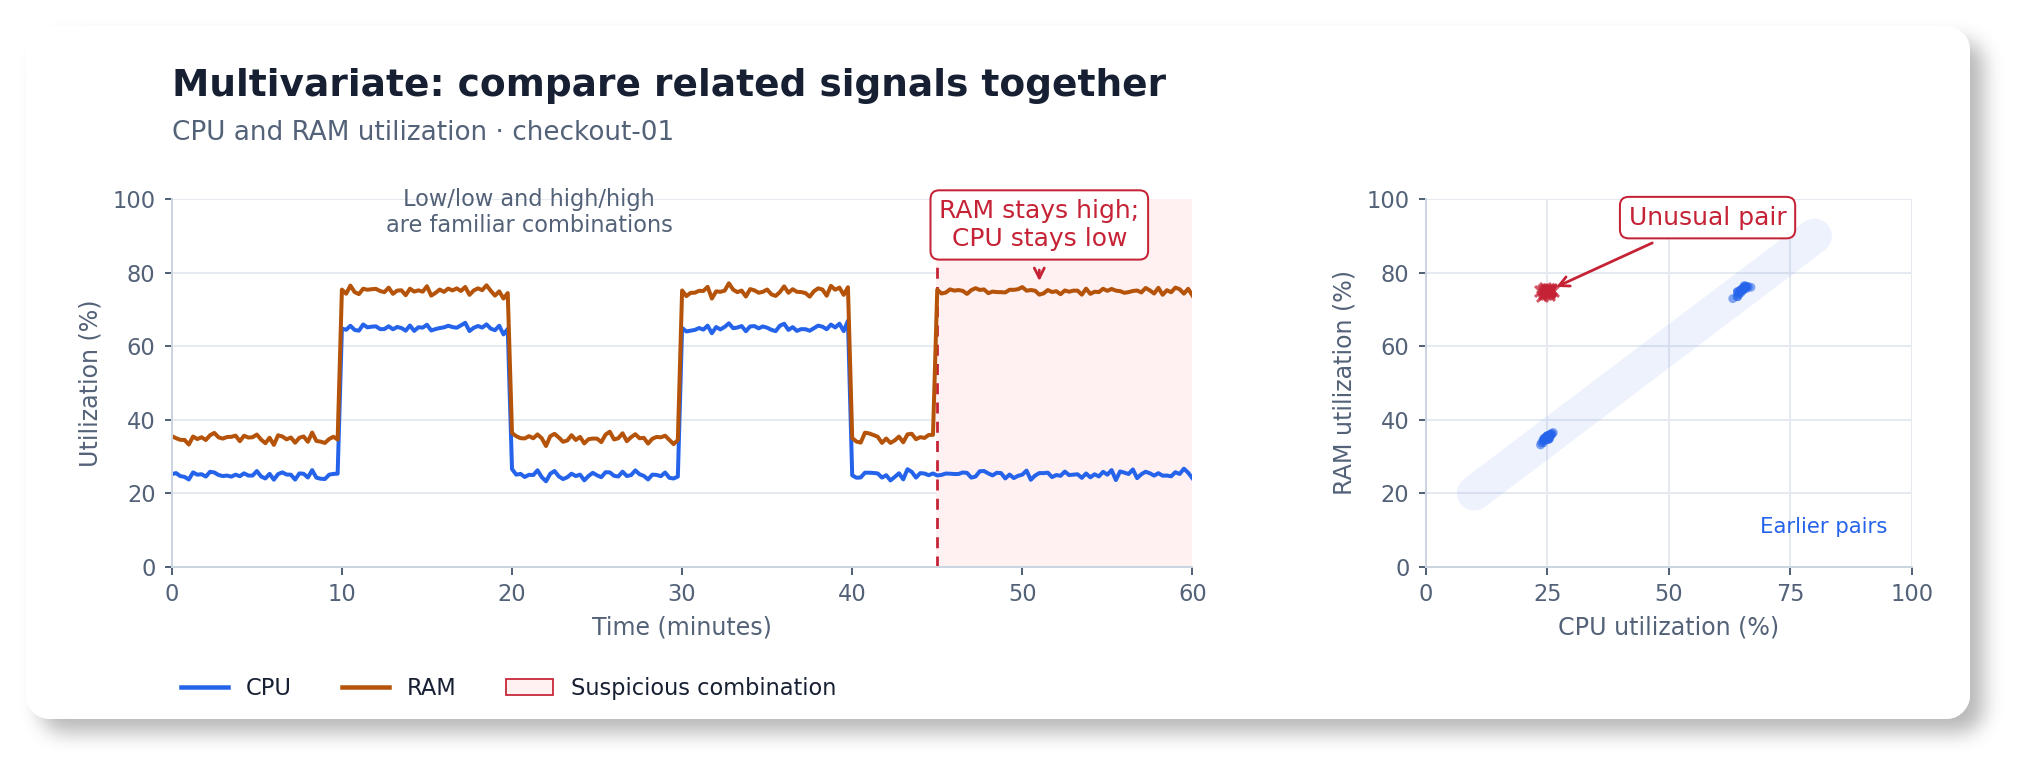
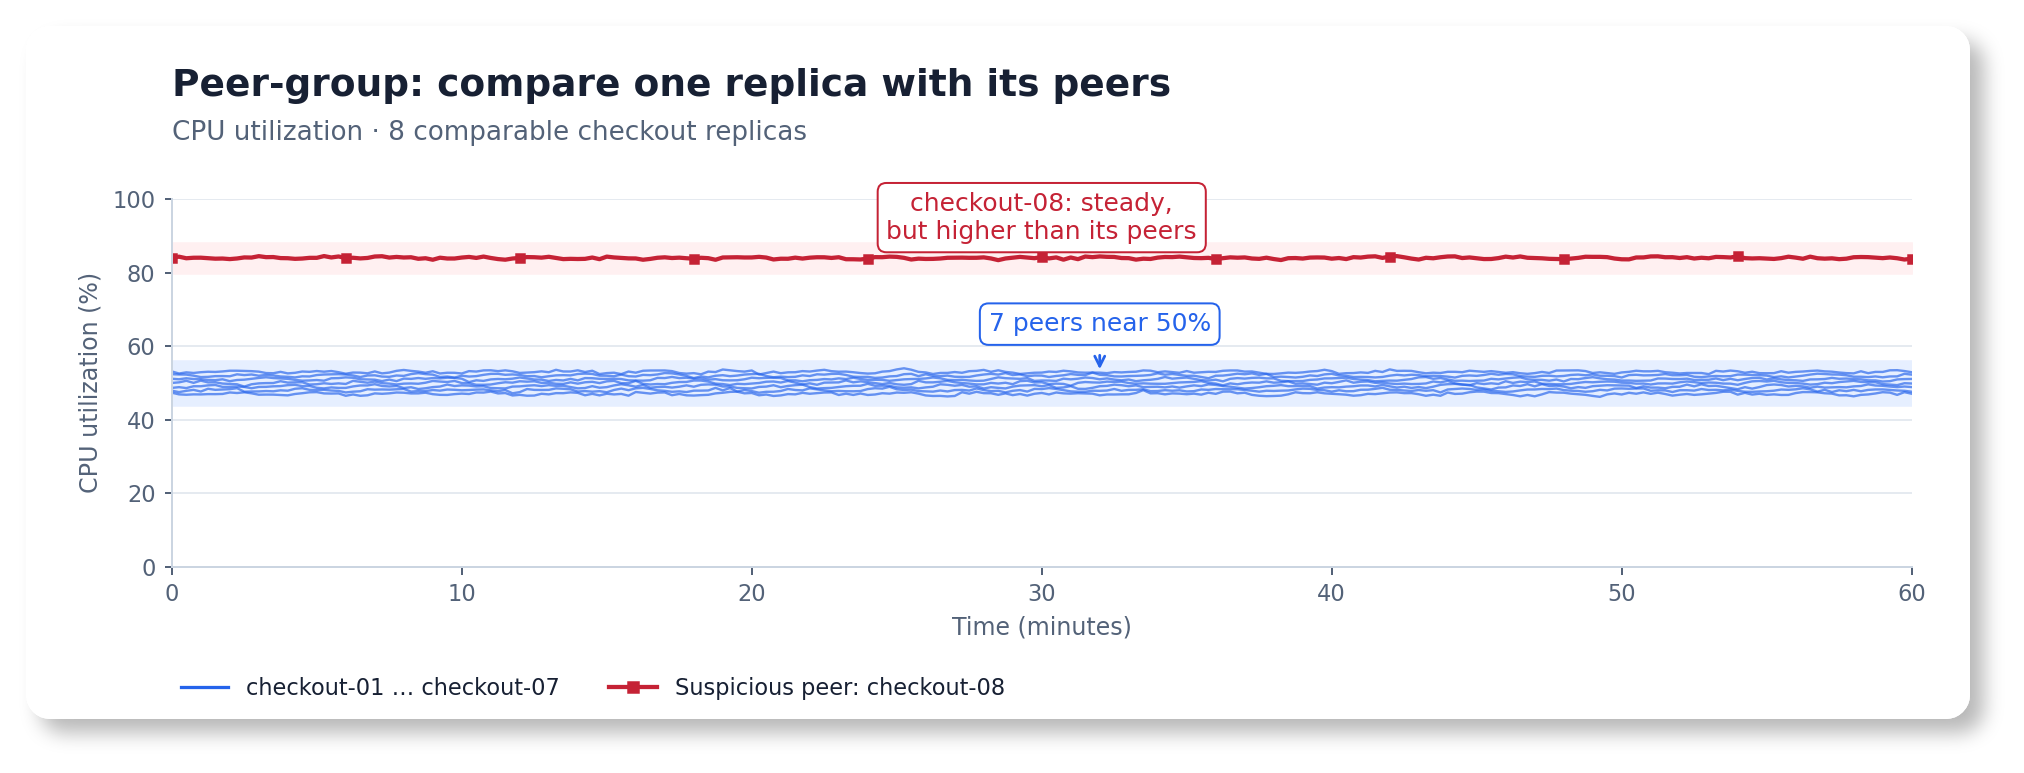
Choose groups whose members make sense to compare: related signals for one entity, or peers doing similar work in compatible units. The guide helps establish that starting point before tuning.
Find the peer that stands out
#
The new peer-group outlier model, available from v1.31.0, learns an accepted range across comparable entities and scores each peer separately. The range can be asymmetric, and the model handles members joining, leaving, or temporarily disappearing.
This is useful for a pool of replicas where the healthy majority provides a reference. It complements historical detection: a change affecting every replica together may require a temporal detector, whereas one replica behaving differently is a natural peer-comparison problem.
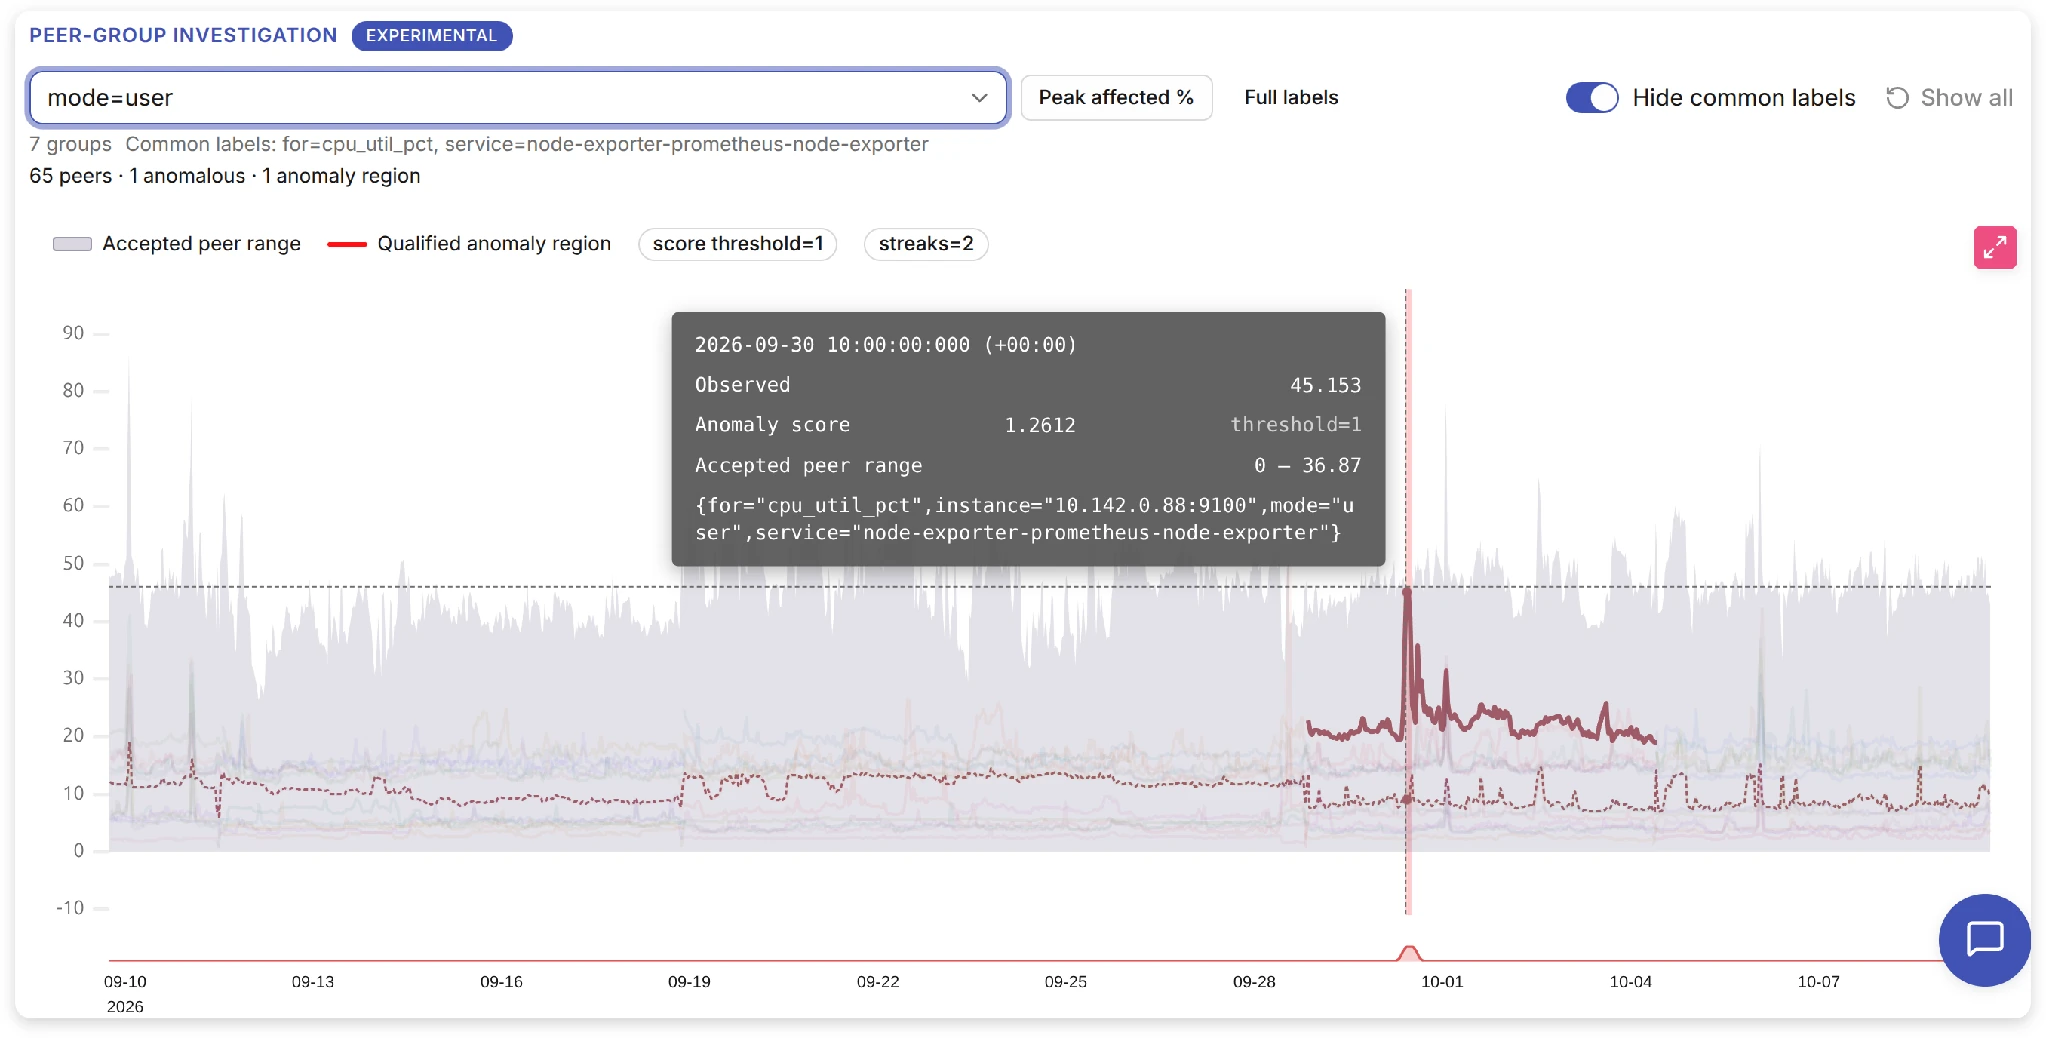
The peer investigation view lets you search groups, compare accepted ranges and inspect individual score histories. Its affected-peers view shows how much of the reporting population is anomalous at each timestamp. That percentage helps distinguish a single outlier from an event affecting much of the population.
For periodic peer deployments, use v1.31.1 or newer; that follow-up fixes the initial data-fetch scheduling for peer models.
Inspect related signals in one workspace
#
The multivariate investigation workspace, introduced with v1.30.5 / UI v1.9.0, brings aligned inputs, per-channel detail and the joint score into one view. Named queries and grouping labels keep independent entities separate while allowing several signals to describe each entity.
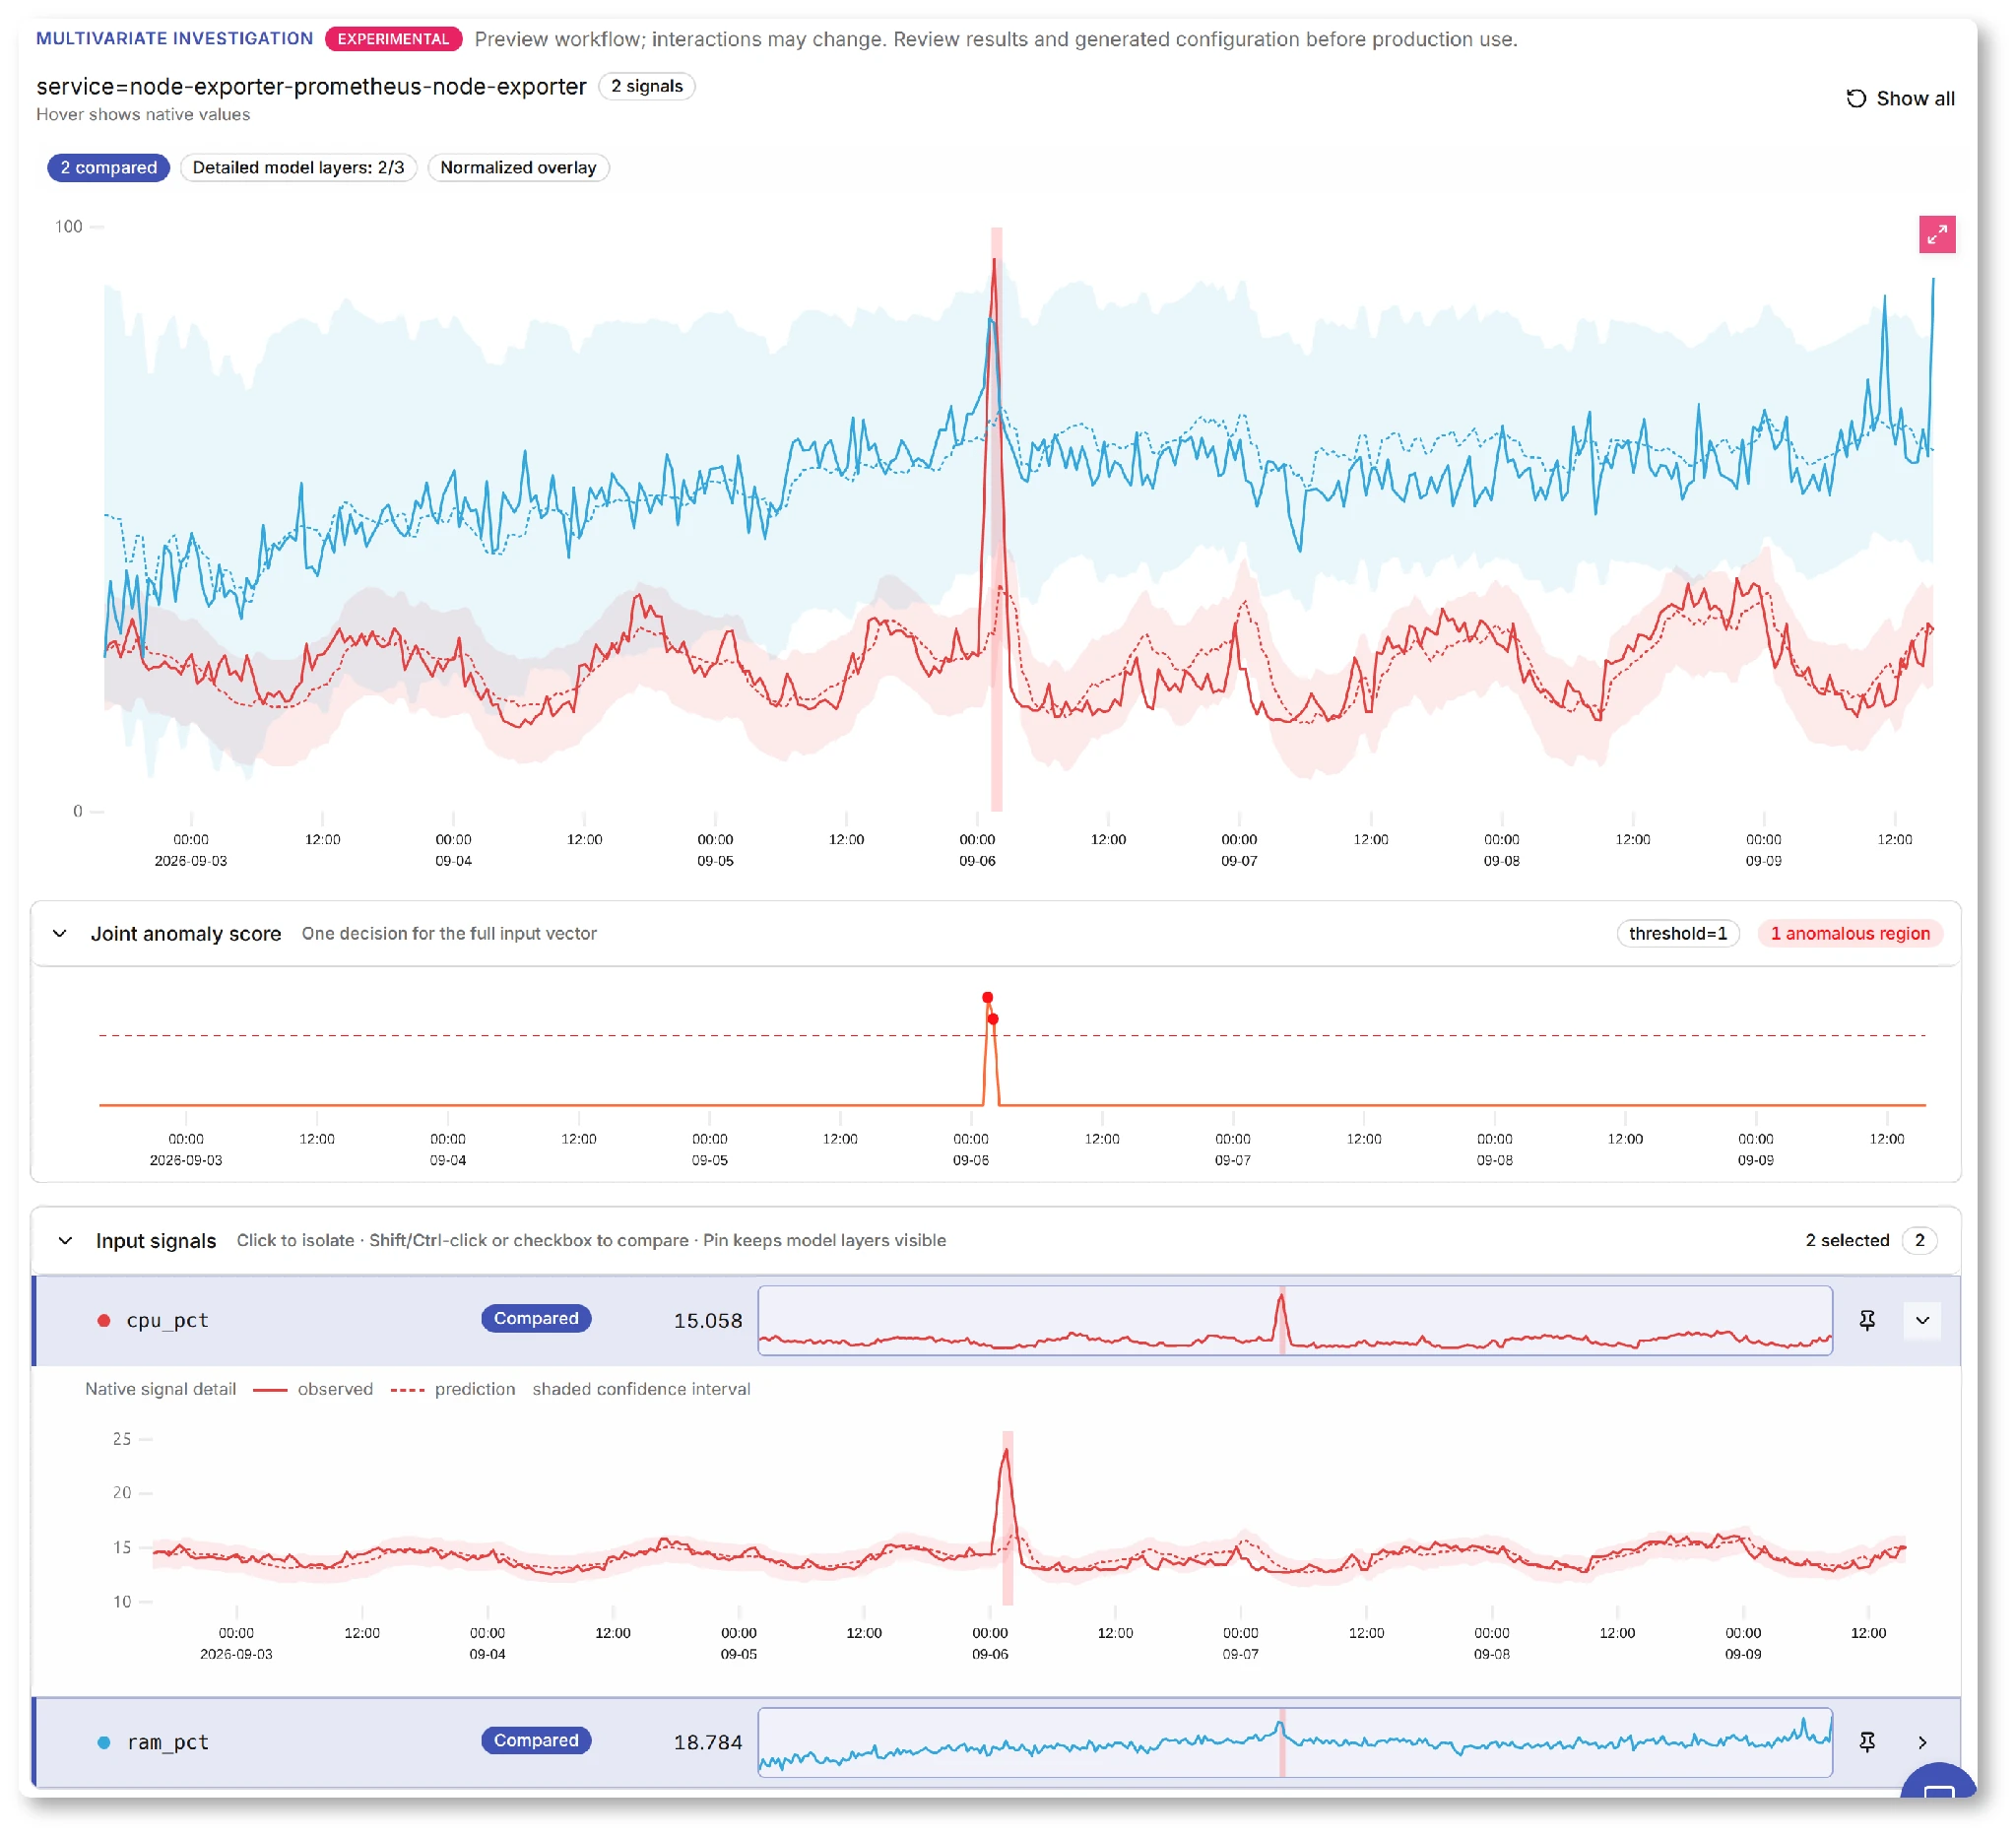
Normalized overlays help compare movement across channels with different scales; channel details retain the native values. Use the joint anomaly score to identify group-level anomalies, then inspect individual channels and their ranges to understand the result. We are actively refining these experimental UI workspaces with user feedback, especially navigation and how results are presented. The experimental label here applies to the investigation UI.
Go from an alert to the evidence
#
An alert is more useful when it opens the context needed to investigate it. Since v1.30.7, a vmalert investigation link can open VMUI with the configured model, queries, and absolute incident window selected.
The first view reads persisted anomaly outputs, so opening the incident does not rerun detection. This matters for online models: rerunning later with different history or settings can answer a different question from “what did the running detector report at the time?” You can also open the original inputs when needed.
Add an investigation_url annotation using the documented template. Use the externally reachable vmanomaly address, including its path prefix when served through a proxy, and preserve the model, scheduler, preset, and query labels used to resolve the incident. The annotation can coexist with the normal vmalert Source link.
annotations:
  investigation_url: 'https://vmanomaly.example.com/api/v1/incident/open?model={{ $labels.model_alias | queryEscape }}&scheduler={{ $labels.scheduler_alias | queryEscape }}&preset={{ $labels.preset | queryEscape }}&query_key={{ index $labels "for" | queryEscape }}&at={{ $activeAt.Unix }}&before=1d&after=10m&step=1m'
The example below follows a synthetic traffic drop from a firing alert to its stored outputs, then zooms in on the incident. All five series are aligned: observed traffic (y), the prediction (yhat), its lower and upper bounds, and anomaly_score.
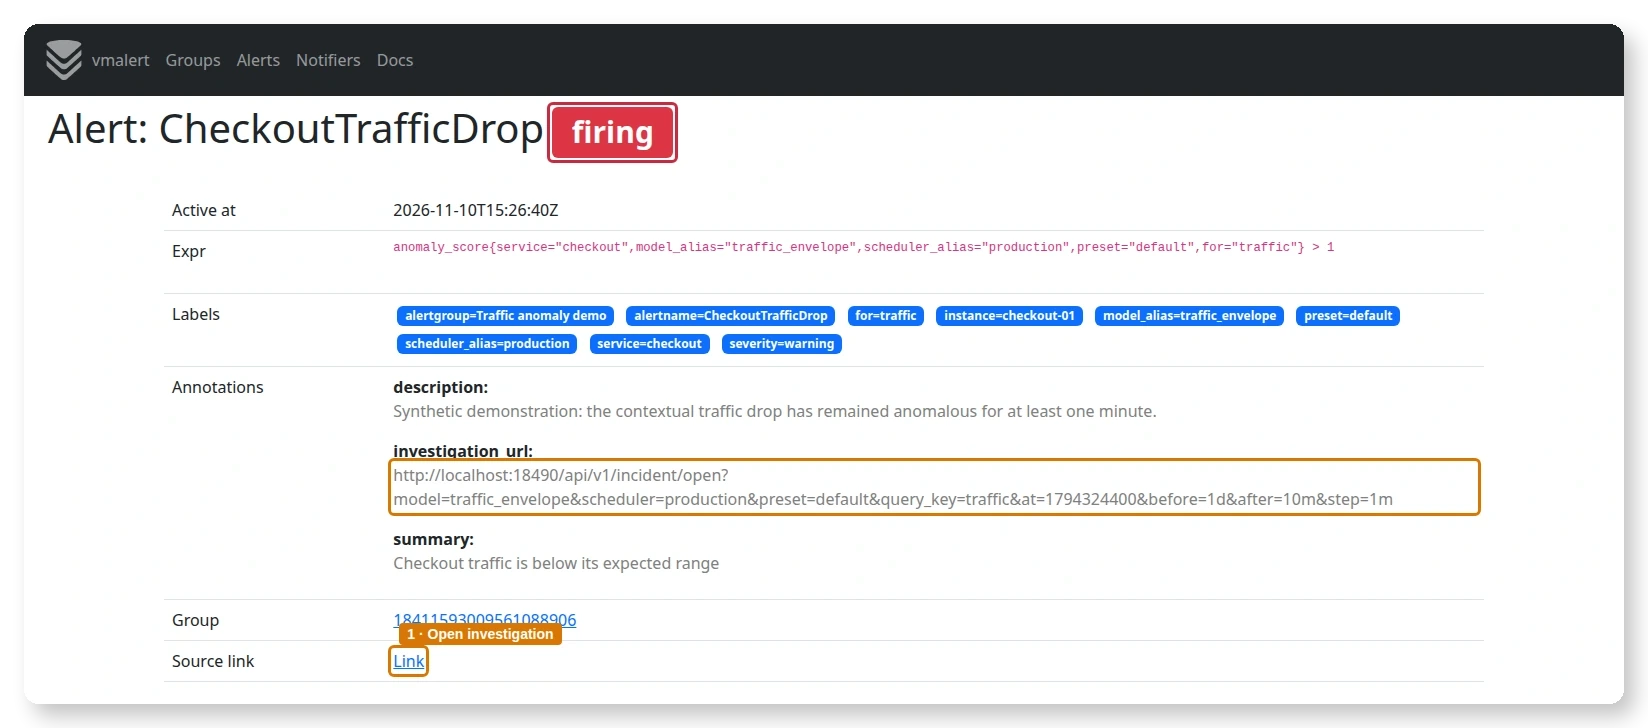
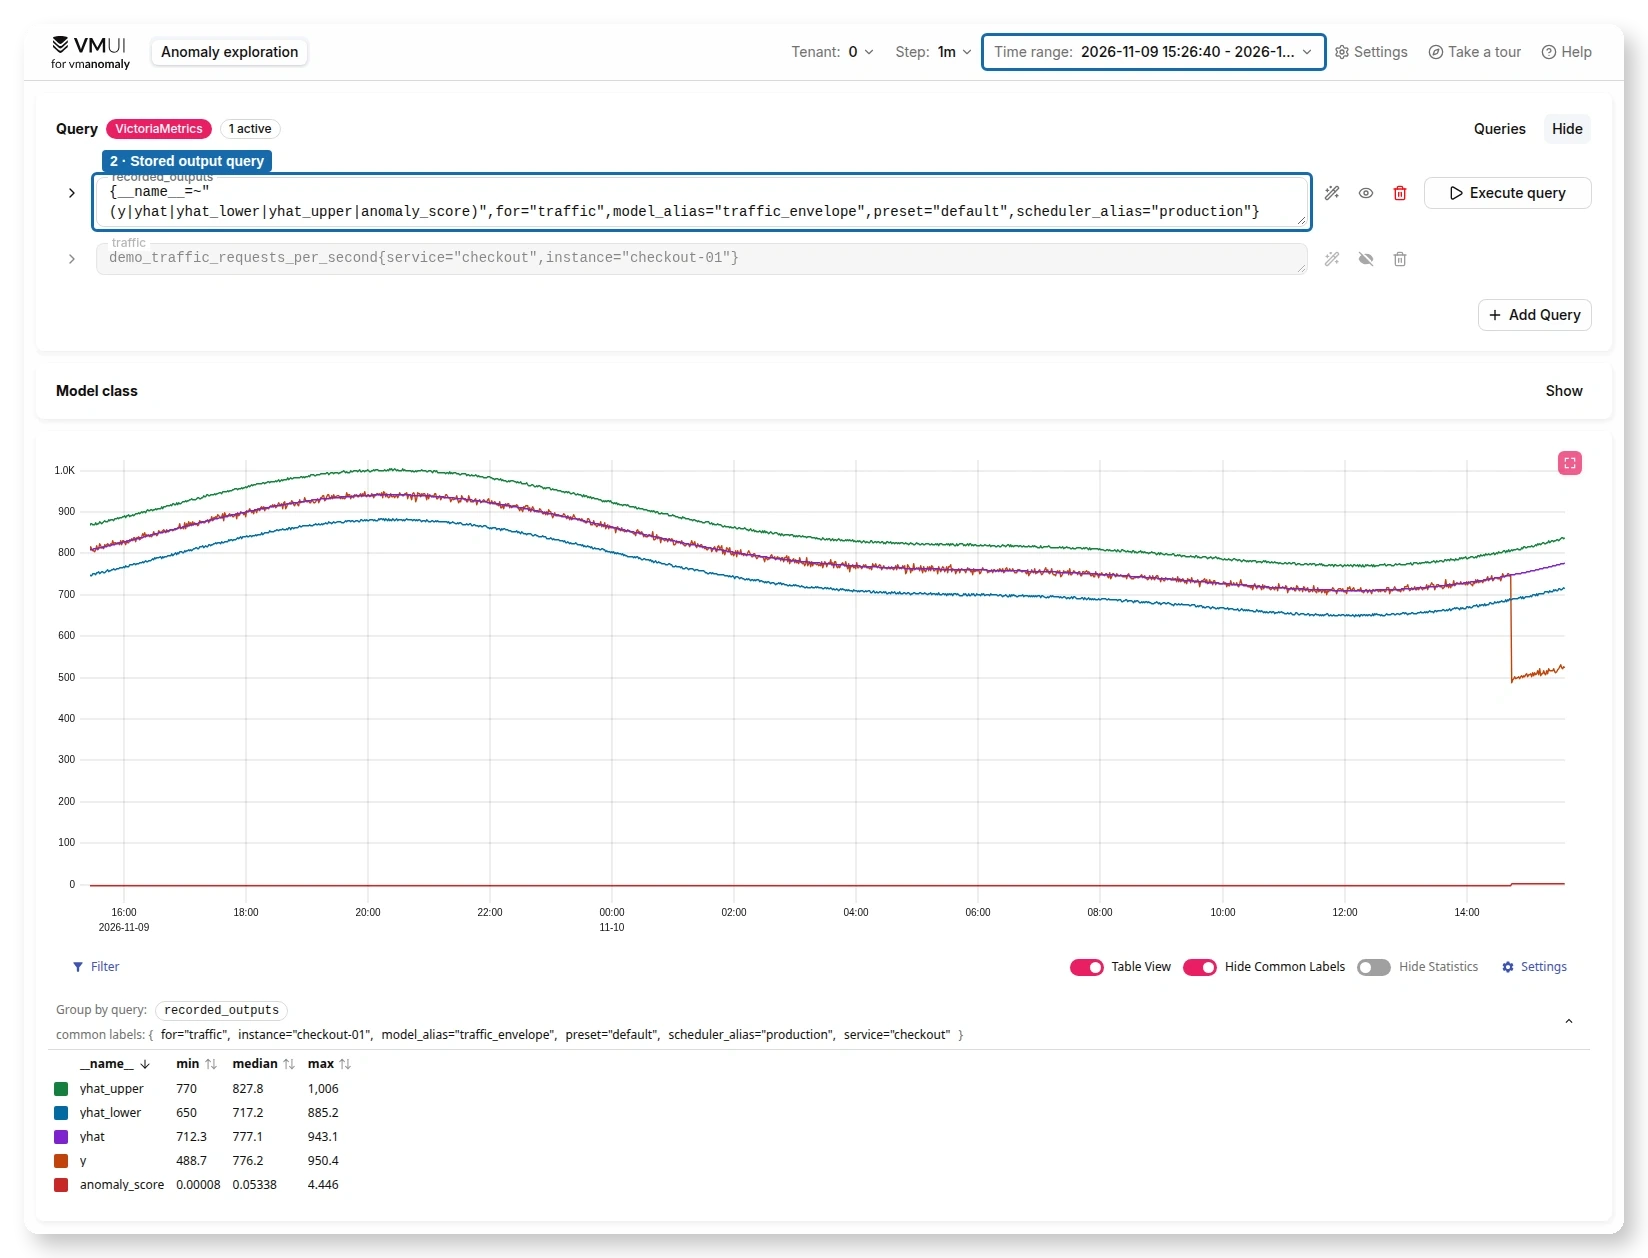
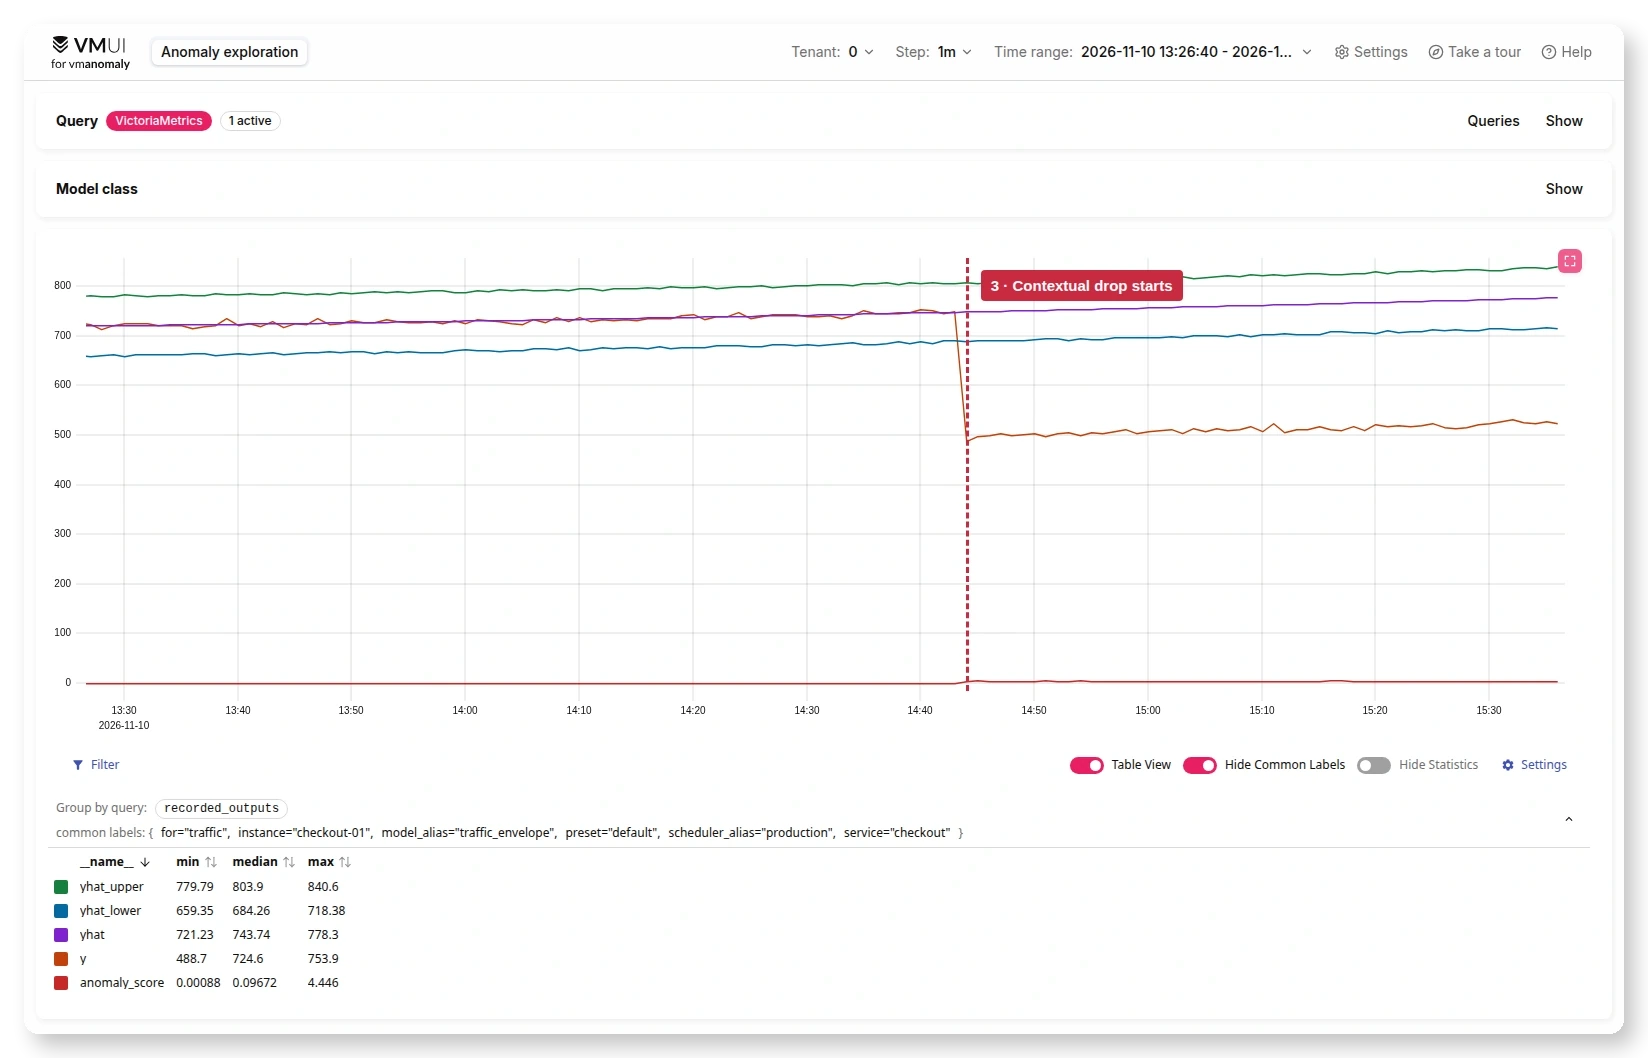
Traffic, predictions and scores are synthetic; alert evaluation and UI queries are real. Colored highlights and the incident-start line are editorial annotations.
This dedicated demo configures the Source link to match the investigation annotation. That override applies to the whole vmalert instance. Keep the separate annotation and preserve existing production Grafana or VMUI Source destinations unless you deliberately reconfigure them.
The current integration resolves the configuration on the selected shard and initially supports a shared VictoriaMetrics reader/writer URL and tenant with default metric naming. Keep the incident endpoints and VMUI behind the same authenticated gateway. Where reader credentials are needed, the documented connection-settings proxy lets authorized UI requests use them.
This closes a practical gap between a notification and the chart: less manual reconstruction of queries and time ranges, with the original detector output available first.
Show the detector which anomalies matter
#
Shared autotune already existed in the previous update. This cycle makes it more useful across named queries and exposes a direct Tune workflow in the UI.
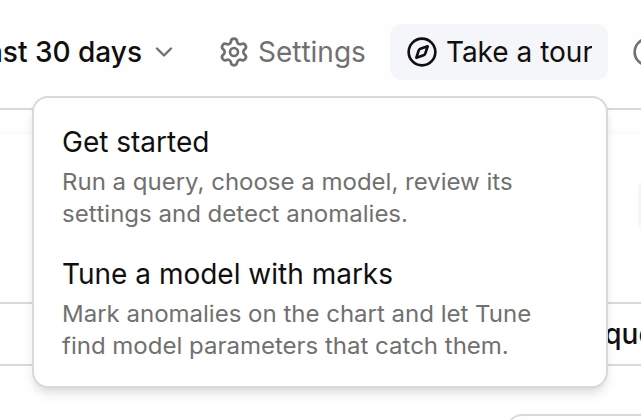
Try it step by step in the metrics playground: open Take a tour → Tune a model with marks. The tour uses demo data to walk through marking anomalies and tuning a candidate, then restores your previous workspace. Choose Get started for an introduction to querying, selecting a model, and detecting anomalies. See the tuning guide for more detail.
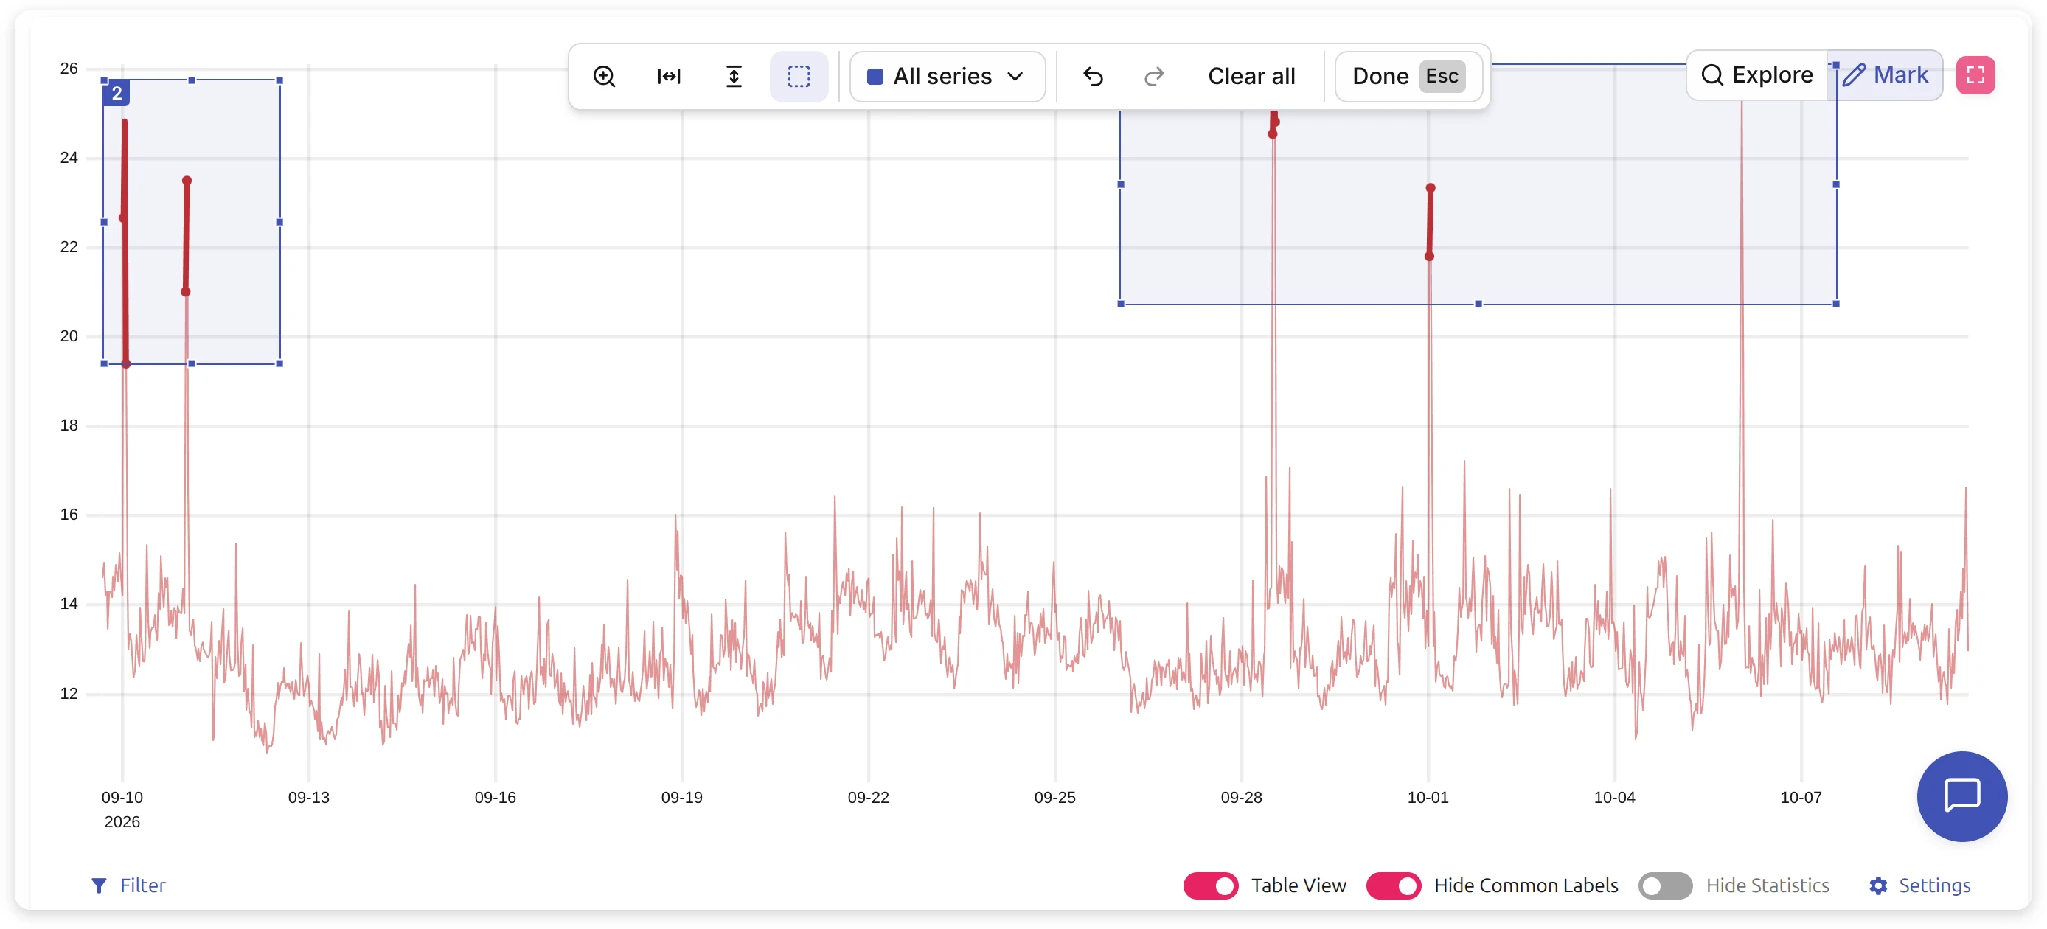
There are two starting points. If you know which historical events matter, choose Marked anomalies, mark regions on the chart, and select their scope. If labels are unavailable, choose an expected anomaly rate, including “No anomalies” for a period you consider normal. Set the trial and time budget, run tuning, then inspect the suggested parameters before applying them and detecting again.
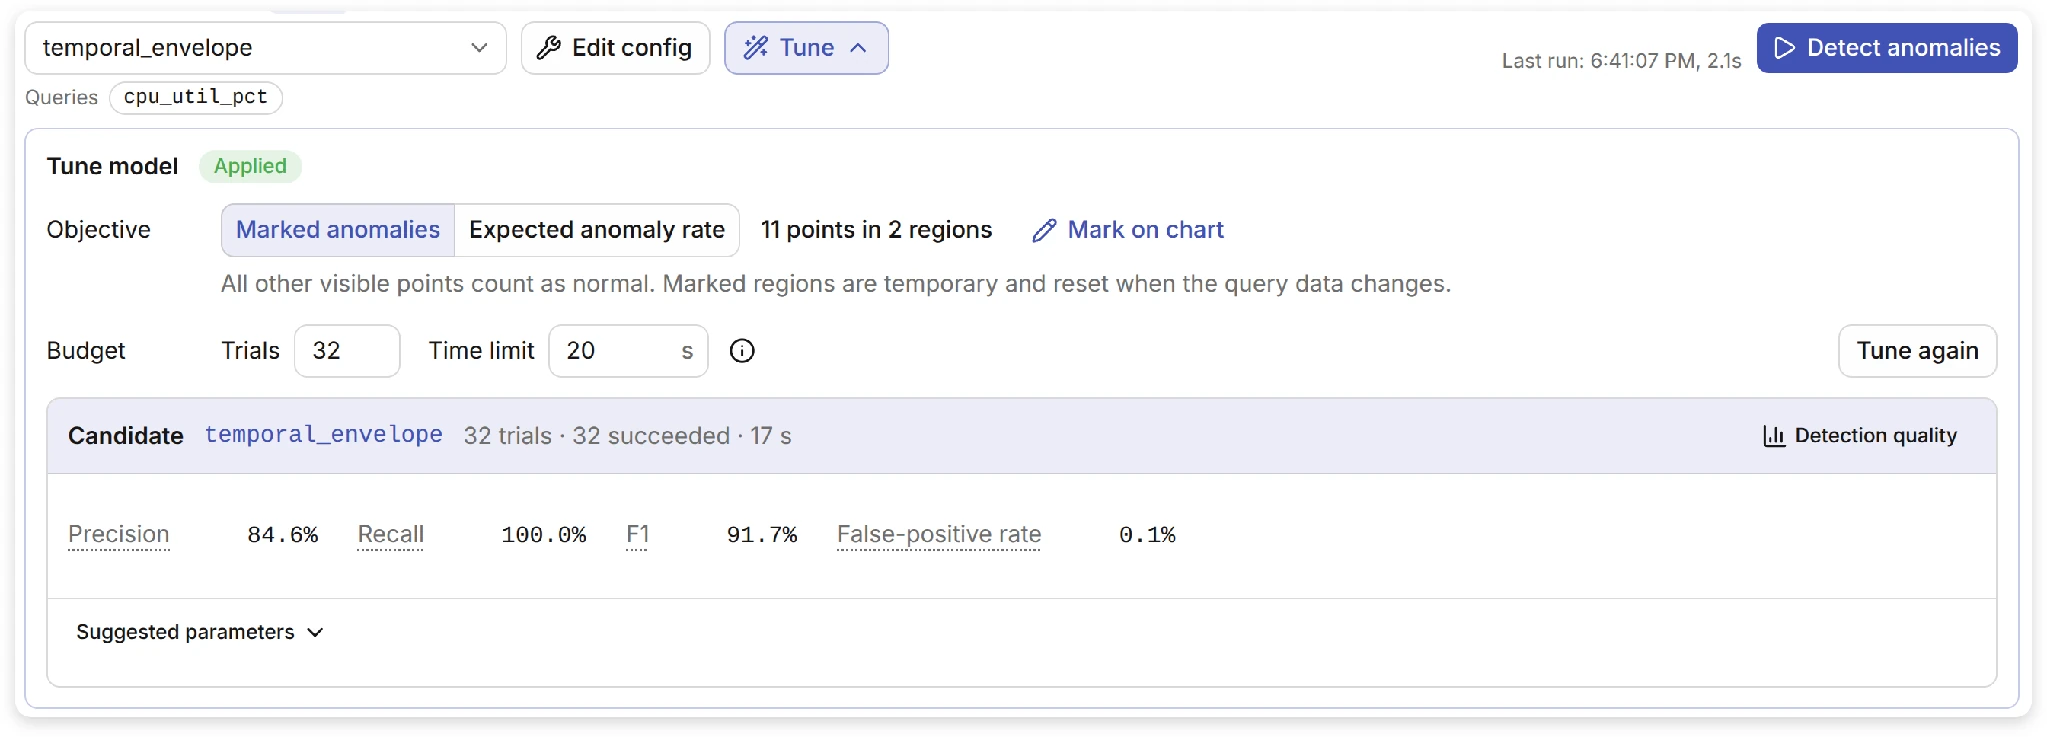
Use the quality report to compare candidates, then try your choice on another representative period. The report measures how well the detector matches the points you marked, so those marks influence the result. Multivariate results count group timestamps; peer results count each peer at each timestamp. The tuning guide explains coverage and scoring.
Named-query tuning can search for one shared configuration across aligned groups. Per-query policies preserve intent: an increase-only CPU rule and a minimum meaningful deviation should survive the search. The follow-up fixes through v1.32.0 improve separation of training and validation data, replay behavior, preservation of fixed settings, and errors when history is insufficient.
Use Tune when you want a concrete configuration to inspect and deploy. The backend auto wrapper remains supported for deployments that retune on fit; its planned removal from the UI selector is a separate UI decision.
From available metrics to a deployment draft
#
The earlier Copilot workflow started with a query or a model to improve. Dynamic presets, delivered in v1.32.0, let you start before the query is known:
Help me monitor the important node-exporter signals in this datasource. Keep the detector lightweight, deploy it with Helm, and retain model state across restarts.
With a compatible MCP server, Copilot can discover metrics and labels within the selected datasource and tenant, inspect a bounded sample, select queries and models, and use tuning and sizing where appropriate. The output includes vmanomaly.yaml and matching alerts.yaml, plus optional deployment files for Compose, Helm or VM Operator.
File cards support preview, copy, and download.
Download configuration, alerts and deployment files from the same generation. Changing a deployment choice regenerates the matching bundle, keeping the files in sync.
Helm output targets a specified chart version. Compose and Helm can use persistent state or ephemeral RAM; generated Operator resources currently support persistent storage.
Drafts list the settings you still need to supply, such as the score-writer URL and tenant. Configure vmalert to read that score destination, and supply the public vmanomaly URL for investigation links. Before deployment, check credentials, storage, connectivity, and alert delivery, then review detection behavior on representative history.
MCP and skills extend the same workflow
#
MCP v0.6.0 adds bounded discovery, preset artifacts and deployment options for vmanomaly v1.32.0+, along with a versioned preset guide. It also supports deployment-schedule replay for shared tuning and bounded waits for task status, helping assistants follow long-running work without repeatedly starting it.
The public vmanomaly plugin now groups five reusable skills:
vmanomaly-query: inspect and operate the service APIs.vmanomaly-config: choose and tune a configuration using real data.vmanomaly-review: investigate detection behavior and review proposed fixes.vmanomaly-preset: discover signals and assemble a monitoring bundle.vmanomaly-sizing: estimate resources or inference capacity.
These workflows keep the same evidence and configuration available whether you work in Copilot or an external agent. The installation guide covers the plugin and individually installable skills. Tool availability still depends on the connected server version.
Estimate resources before scaling
#
The Q2 article previewed capacity planning. The delivered deployment-sizing APIs, introduced in v1.31.0 and refined in v1.32.0, answer two questions:
- Known workload: what CPU, peak RAM, disk, output volume, and writer-network resources should I plan for?
- Known resources: how much inference work might fit within a CPU budget and optional RAM limit?
The estimate takes the model, series or group count, sampling frequency, inference cadence and storage mode into account. Initial fitting and repeated refits are distinct: an online model’s bootstrap can have substantial peak memory requirements even when continuous inference is inexpensive.
Topology also matters. Ten thousand independent series, one thousand ten-channel groups, and peer pools do not represent the same model workload. Results distinguish input counts from model counts and include assumptions and extrapolation warnings.
Treat these experimental estimates as a starting point for a load test, with room to spare. Peer estimates assume fixed, equally sized pools with complete data. Size the selected model separately from tuning; reverse sizing covers inference capacity.
Make the service easier to run and share
#
Several changes address the work around detection itself.
Secure connections. In v1.32.0, the server can serve HTTPS and require client certificates directly for its UI and API. Browser users, API clients, scrapers, and MCP must present trusted client certificates when mTLS is enabled. MCP v0.6.0 adds private-CA trust and client-certificate settings for its connection to vmanomaly. Those settings do not secure the MCP listener or the Copilot-to-MCP connection; protect those separately according to the deployment guide.
Container liveness. Standard and hardened images now include a lightweight --healthcheck command. It checks the running listener without loading another set of models. Point it at the mounted configuration for custom listener, prefix, or TLS settings, following the documented mTLS certificate requirements. This is a liveness probe; datasource access, model readiness, and detection quality need separate monitoring. Kubernetes uses its configured probes rather than inheriting Docker’s health check.
More predictable resource use. Reader concurrency and native-thread controls, bounded writer batches, and grouped-model improvements reduce avoidable overhead. Opt-in rendezvous sharding limits reassignment when configurations change, while idle shards can remain observable and accept later work. The release notes also cover experimental hardened images and improvements to the self-monitoring and anomaly-score dashboards.
A clearer UI handoff. UI v1.11.0 adds JSON downloads of query and anomaly results, current-range selection and optional consistent privacy replacements. Resizable editors, readable query aliases and downloadable Copilot artifacts make it easier to keep useful context when sharing an investigation.
Temporal Envelope: an opt-in next step
#
Temporal Envelope also supports multivariate detection, learning changes in cross-series relationships and producing one joint anomaly score. It continues to receive stability improvements, including better behavior for intermittent data and losslessly compressed snapshots. v1.32.0 also introduces Temporal Envelope v2 as an opt-in research candidate aimed at steadier trend and seasonal learning. V1 remains the default.
Try v2 on representative history and known incidents before adopting it. Check the migration guidance before switching versions or rolling back: some transitions require fresh model state. The release notes identify affected models that need refitting.
Try the workflow with your own metrics
#
Start with the model-selection guide, then use the UI to inspect a representative query and its history. Mark known anomalies or choose an expected rate, review a tuned candidate, and investigate the resulting scores. When useful, estimate deployment resources and export a matching configuration and alert bundle.
AI Copilot can help with this workflow: inspect your queries, suggest and tune models, estimate resources, and prepare configuration and alert files through the connected MCP tools. Describe what you want to monitor, then review its suggestions and results before deploying.
The next step is to keep improving these workflows through real use: richer onboarding, stronger investigation tools, and better guidance for the experimental capabilities. Tell us which part of choosing, tuning, or operating a detector still takes too much work.
Request an Enterprise trial to try vmanomaly, or get in touch to discuss your monitoring use case. For the complete release-by-release details, see the service changelog and UI changelog.
You might also like:
What's new in VictoriaMetrics Anomaly Detection (Q2 2026)
The Q2 2026 vmanomaly update introduces Temporal Envelope, a redesigned UI, faster online-model execution, and an AI-assisted workflow that turns natural-language monitoring goals into tested configurations and alerting rules.
What's new in VictoriaMetrics Anomaly Detection (Q1 2026)
Q1 2026 brought incremental but important updates to VictoriaMetrics Anomaly Detection: UI improvements, AI assistance inside the UI, a public traces playground, new false-positive reduction controls, and continued resource optimizations.
What’s new in VictoriaMetrics Anomaly Detection (2025)
VictoriaMetrics Anomaly Detection has had a productive year with lots of user feedback that has had a major impact on product development. We’ve added improvements across the board: in core functionality, simplicity, performance, visualisation and AI integration. In addition to bug fixes and speedups, below is a list of what was accomplished in 2025.