- Blog /
- What's new in VictoriaMetrics Anomaly Detection (Q2 2026)
What's new in VictoriaMetrics Anomaly Detection (Q2 2026)
Share:


Summary: The Q2 2026 development cycle moved VictoriaMetrics Anomaly Detection toward one simpler, continuously adapting workflow. The main addition is Temporal Envelope, an online model that handles trend, multiple calendar patterns, holidays, persistent changes, forecasts, and optional multivariate context without retaining the full fit history. Alongside it, we redesigned the UI, made online-model experiments and scheduled execution faster, and connected the UI Copilot, the vmanomaly MCP server, and VictoriaMetrics skills to the same evidence-based workflow: inspect data, tune, validate, recommend, and deploy. This article covers six service releases from v1.29.4 through v1.30.1, including the follow-up release that completed and stabilized the Q2 work.
Following our Q1 2026 update, this post explains how those changes fit together and what they mean for teams moving from a monitoring idea to production anomaly alerts.
Series posts:
- H1'24 Updates
- H2'24 Updates
- 2025 Updates
- Q1'26 Updates
- Q2'26 Updates - you are here
Introduction
#
VictoriaMetrics Anomaly Detection (vmanomaly) is our anomaly detection product available to enterprise customers. It helps teams detect unexpected changes in timeseries-like data, whether it comes from metrics, logs-derived metrics, or traces-derived metrics. The goal is to simplify alerting, reduce maintenance overhead, and improve signal quality across the observability stack. Learn more from the documentation.
Q1 focused on making anomaly detection easier to explore. In Q2, we followed the workflow further: from exploration to a configuration that can run continuously in production.
That required progress at several layers. The model needed to cover more real-world data profiles without forcing users to manage many specialized settings. Predictions produced during UI backtesting needed to match those produced by the same model running continuously, so experiments would remain representative of production. The UI needed to make changes and stale results obvious. And AI assistance needed real data, schemas, validation, and long-running task APIs - not only documentation and generic recommendations.
Q2 Highlights
#
From May through the v1.30.1 follow-up, vmanomaly shipped:
- 6 service releases, from
v1.29.4tov1.30.1 - 5 UI releases, from
v1.7.0tov1.8.1 - Temporal Envelope, a fast and flexible online model, available in univariate and multivariate forms
- 2 - 200x faster exact online-model backtesting in representative UI workloads, depending on the model and configuration
- Faster online execution:
v1.30.1delivered 1.7 - 2.3x faster inference and 1.5 - 2.6x faster fit in representative Z-score, MAD, STD, Seasonal Quantile, and Rolling Quantile workloads. This shortens experiments and lets scheduled installations process more series with the same CPU budget. - New time-series characteristics and asynchronous shared-autotune APIs
- A redesigned UI and a more reliable AI Copilot
- Public
vmanomalyMCP and purpose-built skills that turn the same workflow into reusable agent automation - Further production hardening for schedulers, datasource limits, exact causal inference, hot reload, and state restoration
Find more details in the Q2'26 presentation slides and the video overview from our Q2'26 meetup.
One Online Model for Complex Time Series
#
Real infrastructure and business metrics rarely stay in one neat category. A query may return hundreds of series: some flat, some trending, some following daily or weekly traffic, and some affected by holidays or deployment-driven level changes.
Historically, that often meant choosing among lightweight online models or heavier offline forecasting models such as Prophet, or multivariate models such as Isolation Forest. It also meant maintaining different fit schedules and parameter sets, as well as much more pressure on the datasource while getting data for regular model refits.
Temporal Envelope is intended to make that choice simpler, being efficient at handling complex time series. It combines:
- robust causal level and trend tracking;
- persistent-change adaptation without treating every short spike as a new normal;
- compact presets for daily, weekly, weekday/weekend, monthly, holiday, and known-event behavior;
- residual prediction intervals and optional forecasts;
- bounded online state that does not grow with the fit history;
- an optional multivariate form that learns cross-series dependency changes and emits one joint anomaly score.
The practical benefit is that a single configuration can cover a mixed query result while continuing to learn between infrequent refits. Transient incidents have bounded influence on later predictions, while sustained changes can become the new expected regime. This is most useful when teams want one online model for complex or mixed profiles rather than several specialized offline models. Temporal Envelope benefits from enough history to observe the configured calendar cycles.
It is not a universal replacement for every model. For a simple stationary signal with no meaningful trend or seasonality, online MAD or online Z-score remains smaller and easier to reason about.
Comparing Temporal Envelope with Prophet and Isolation Forest
#
The following single-CPU measurements come from the controlled benchmark presented in our Q2'26 meetup. They compare like-for-like daily and weekly behavior and a five-point inference window. The timing columns are arithmetic means from repeated benchmark runs, while persisted size is the complete serialized model artifact, including serialization metadata. Smaller and faster are better in all cost columns. Absolute numbers vary by hardware and configuration; the important result is the shape of the cost as fit history grows.
| Univariate model | Fit points | Persisted size | Average fit | Average infer, 5 points |
|---|---|---|---|---|
| Prophet | 2,000 | 59.0 KiB | 91 ms | 35 ms |
| Temporal Envelope | 2,000 | 7.27 KiB (8.1x smaller) | 44 ms (2.1x faster) | 7 ms (4.9x faster) |
| Prophet | 5,000 | 140.7 KiB | 186 ms | 34 ms |
| Temporal Envelope | 5,000 | 7.27 KiB (19x smaller) | 74 ms (2.5x faster) | 7 ms (5.1x faster) |
Prophet’s persisted state grew 2.39x when the fit history increased from 2,000 to 5,000 points. Temporal Envelope retained the same byte state. This bounded footprint lets users increase the fit window for stability without proportionally increasing per-model storage or the cost of loading state for inference - especially important when operating many series.
The multivariate comparison used one CPU, 2,000 fit points, 10 input channels, and the same five-point inference window:
| Multivariate model | Persisted size | Average fit | Average infer, 5 points |
|---|---|---|---|
| Isolation Forest, 100 estimators | 1.15 MiB | 128 ms | 16 ms |
| Temporal Envelope, dependency rank 8 | 41.6 KiB (29x smaller) | 63 ms (2.0x faster) | 8 ms (2.0x faster) |
Temporal Envelope produced the joint score while also updating its online state and calculating per-channel expected values and boundaries. These benchmarks do not mean that it will win every workload, but they explain why it is now our preferred starting point for complex new configurations and the migration target for supported offline models planned for future deprecation.
A small spoiler for what comes next: we are working on a /capacity-estimation endpoint that will turn benchmark methodology into workload-specific sizing guidance. Given a model class, expected series count, and execution profile, it will estimate CPU, RAM, persisted-state and disk requirements, and fit and inference timings - making deployment planning more useful than extrapolating from one reference machine.
A Redesigned UI for the Full Workflow
#
UI releases v1.7.0 through v1.8.1 made the interface feel less like a set of independent forms and more like one experiment workspace.
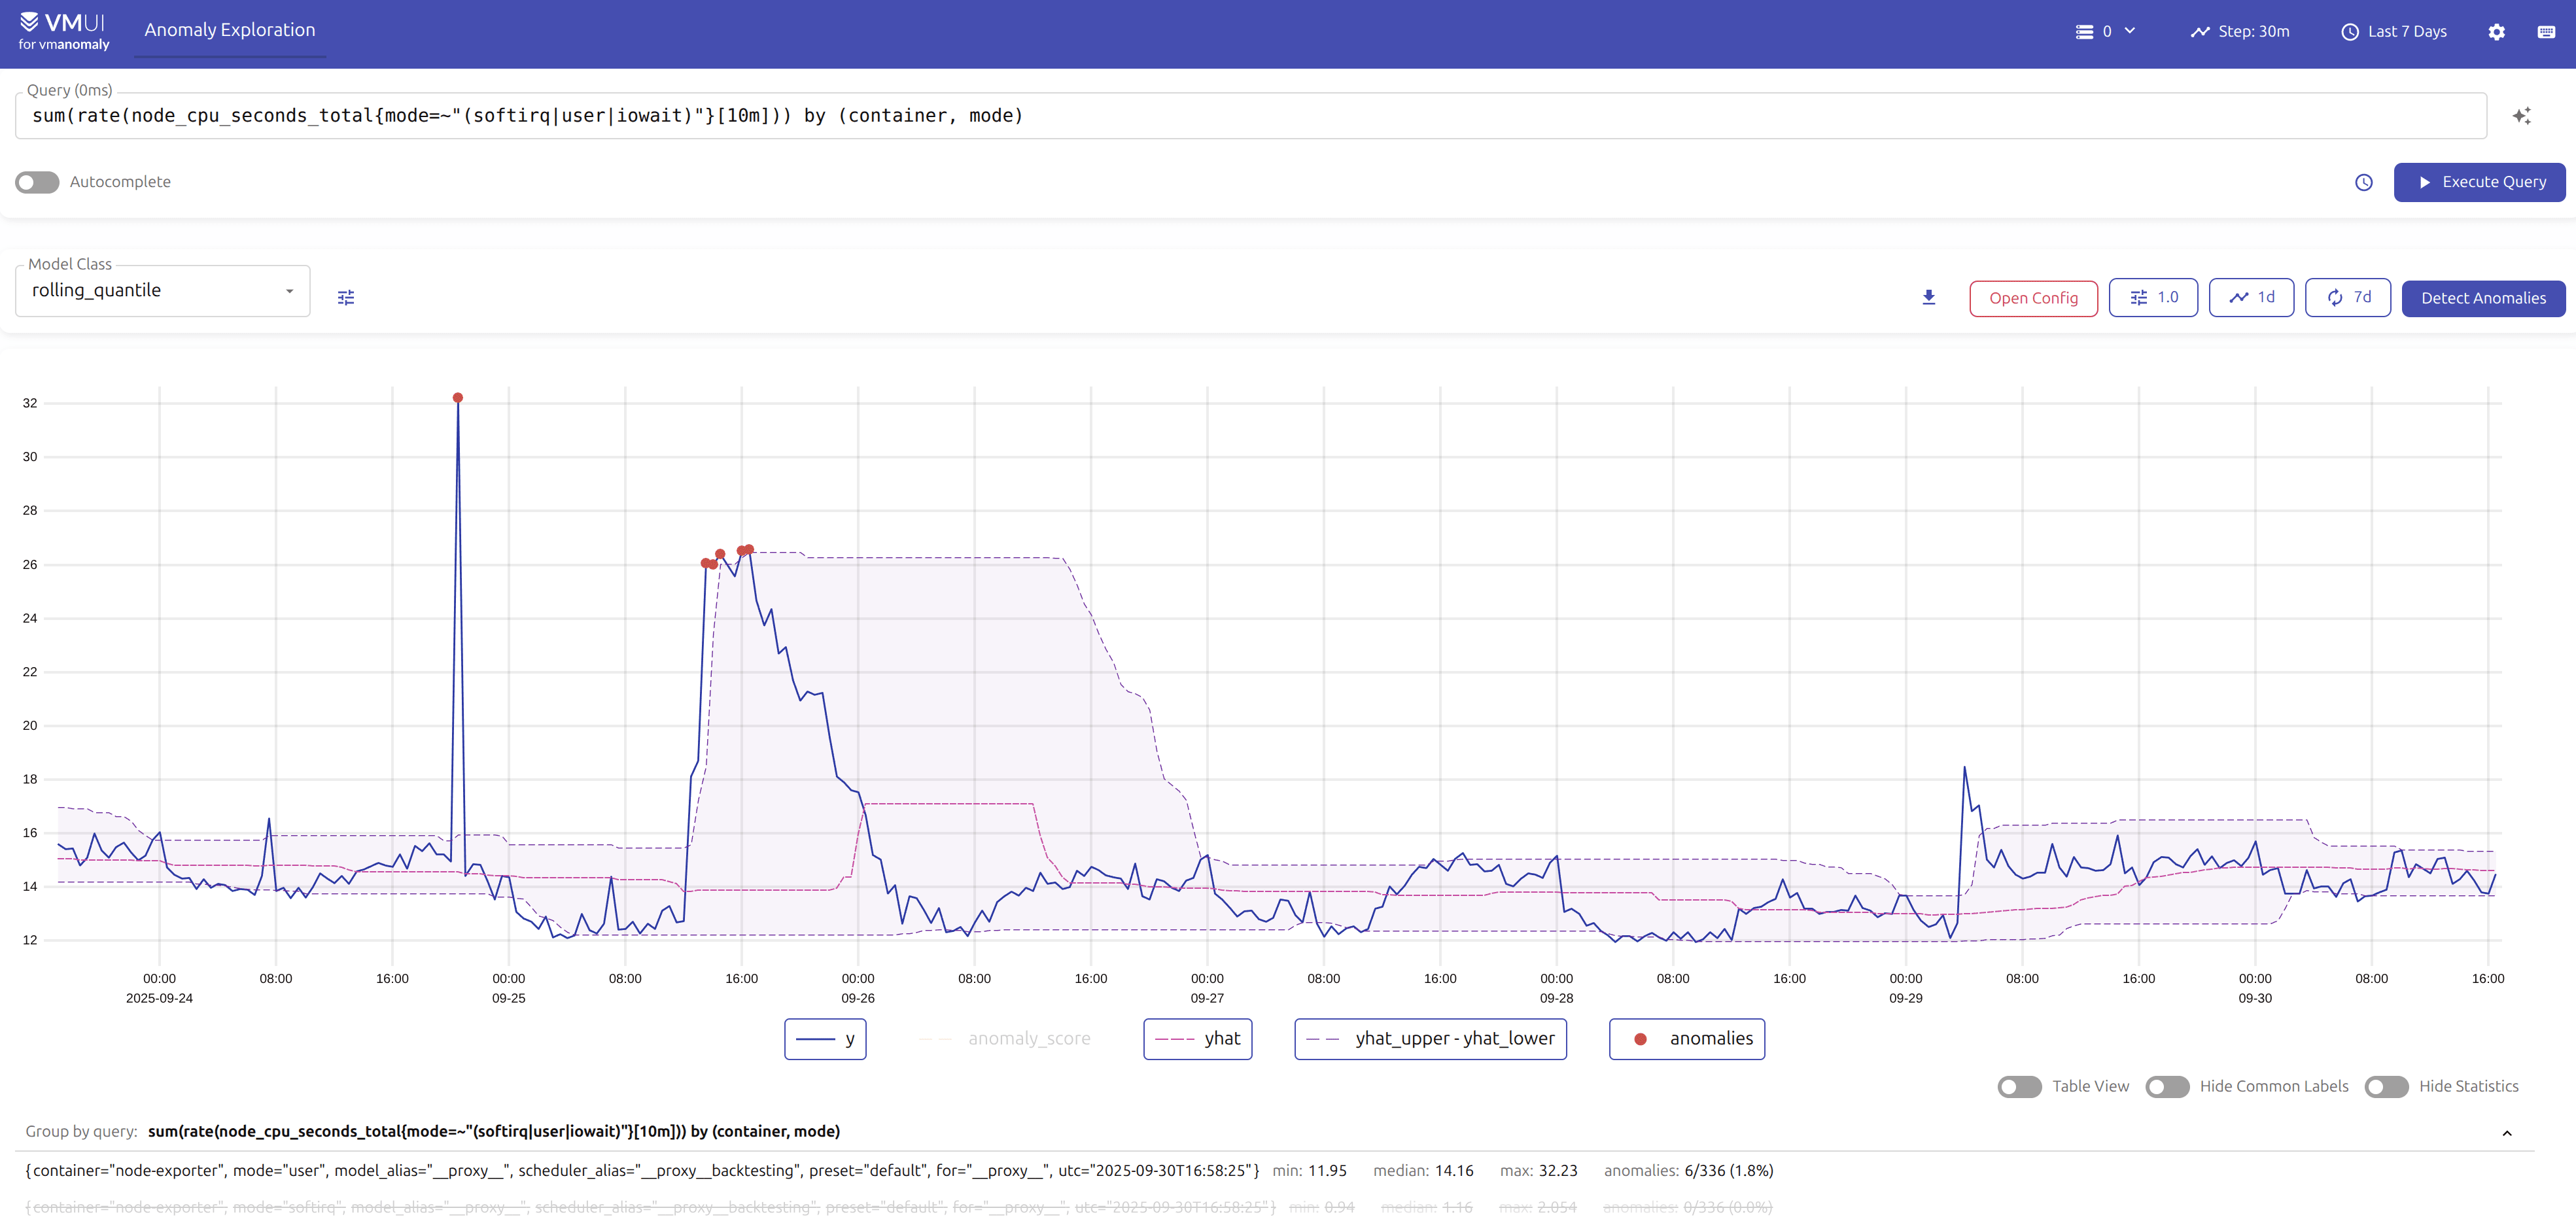
The main changes include:
- a refreshed shadcn-based design with clearer query and model configuration;
- searchable access to queries and models already scheduled by the running server;
- inline configuration previews and direct YAML export;
- fullscreen chart controls and smoother time-range navigation;
- query prettification and platform-aware keyboard shortcuts;
- visible “results are out of date” behavior after the query, range, or model changes;
- synchronized Copilot suggestions for query, model, and anomaly settings;
- compact display of repeated tool calls and clean recovery after canceled or incomplete calls;
- a lot of bug fixes and performance improvements.
The UI still supports manual experimentation at every step. AI assistance adds another entry point; it does not replace the model editor, chart, generated YAML, or the final user review.
Lowering the Onboarding Barrier: Natural Language Explorations
#
The redesigned AI Copilot demonstrates how the new pieces work together. Instead of starting with model classes and hyperparameters, a user can start with the operational intent:
Track CPU utilization spikes by service and mode, excluding idle CPU. Treat a spike as actionable only when it lasts at least three points, and tune the model so detected anomalies remain below 2% of observations.
From that prompt, the assistant can follow a grounded sequence:
- Build or reuse the MetricsQL query and place it into the UI.
- Inspect the returned time series for trend, calendar seasonality, changepoints, gaps, and spiky or intermittent behavior.
- Choose an efficient model class and relevant fit window, then tune one shared configuration across a bounded sample of returned series.
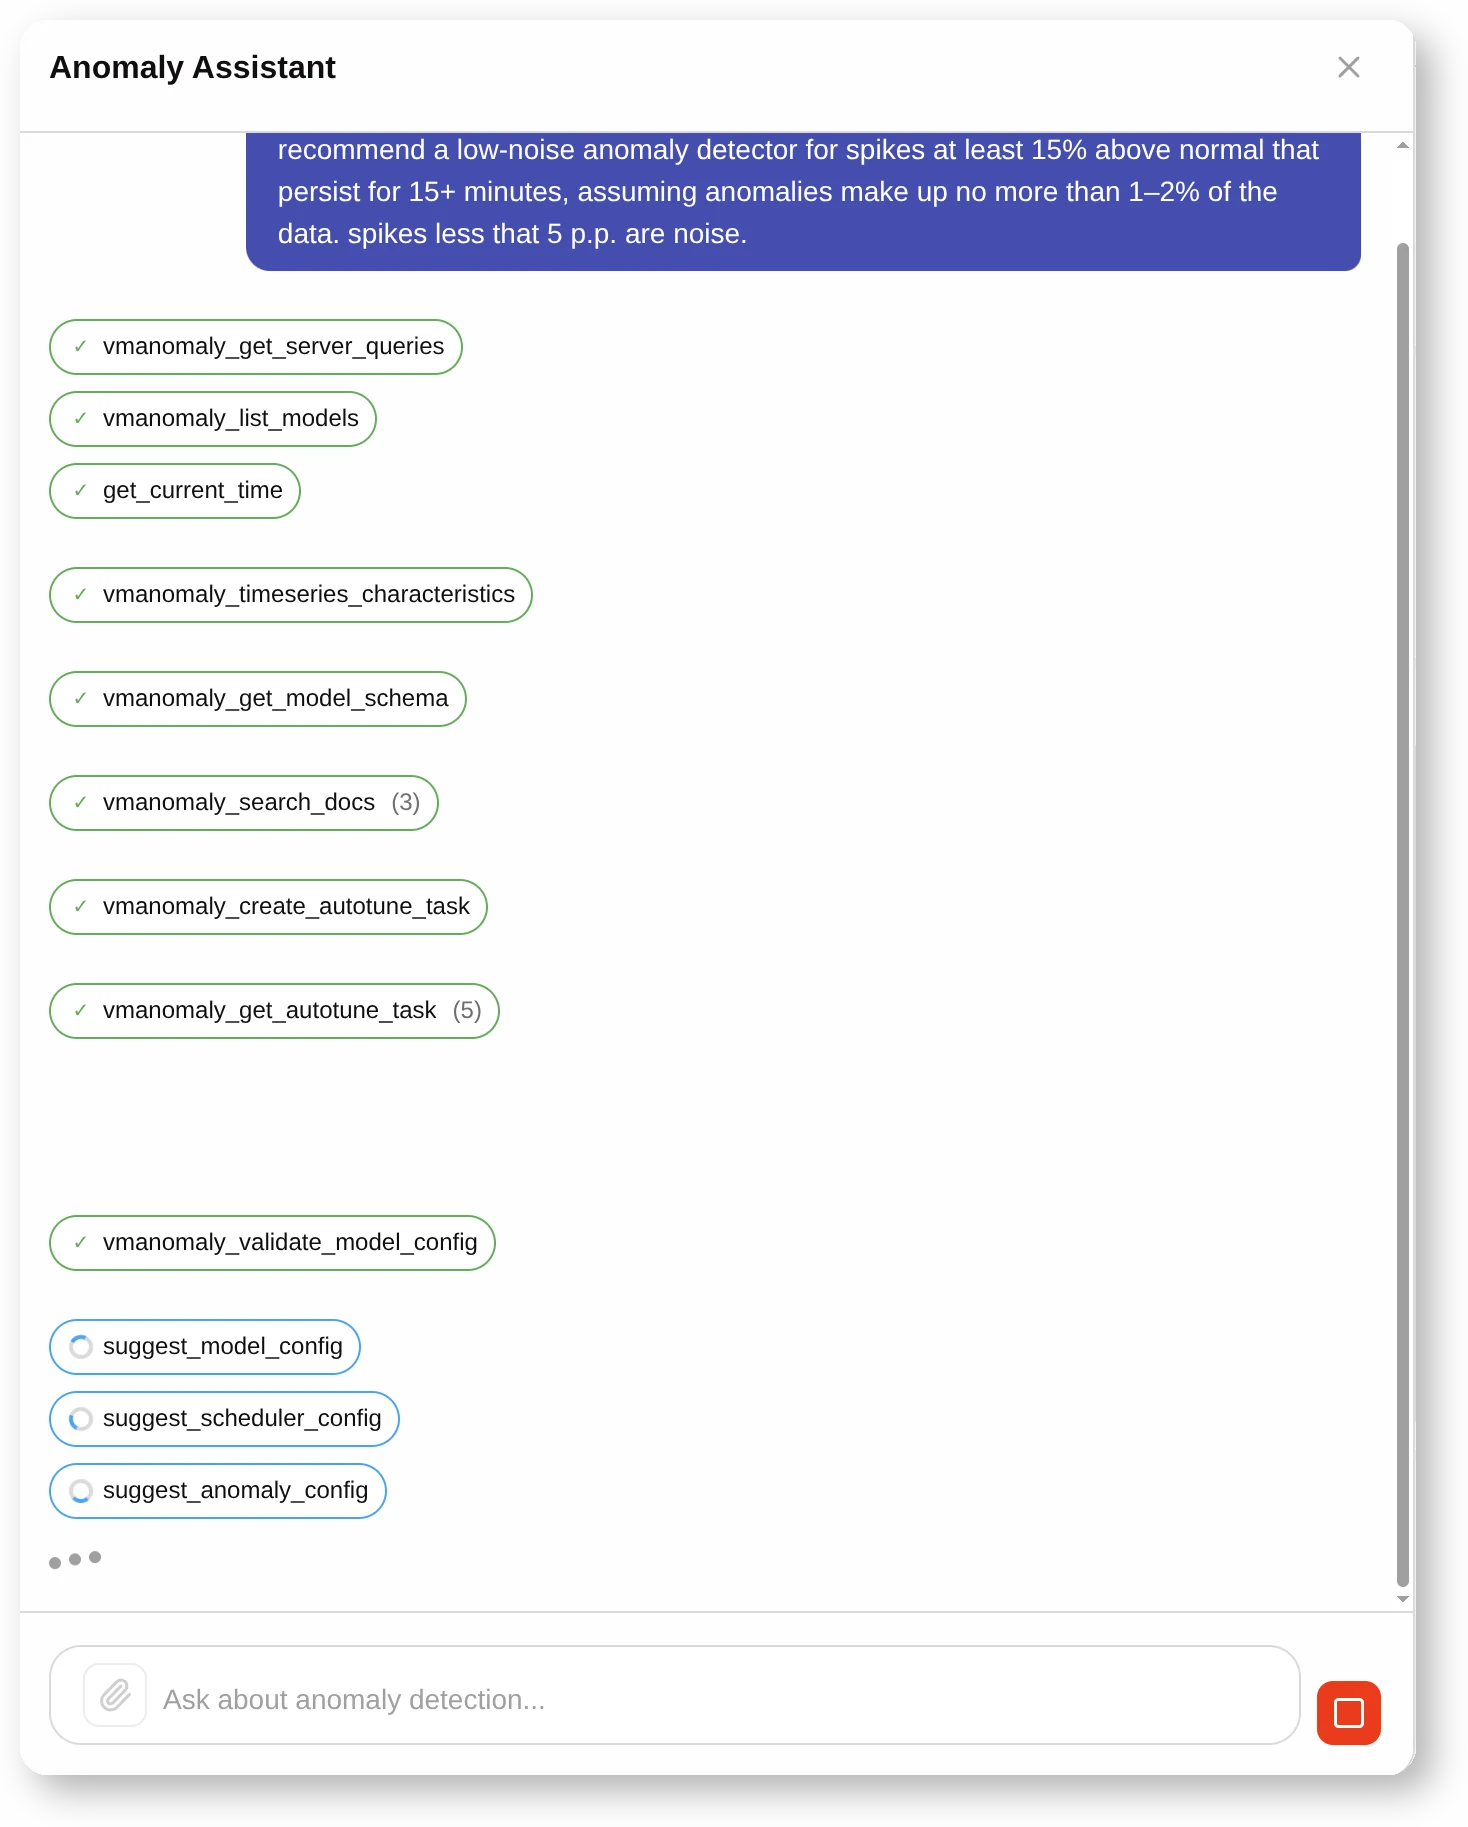
- Apply business constraints such as detection direction, minimum deviation, anomaly volume, and consecutive anomalous points.
- Validate the generated model and service configuration against the running
vmanomalyinstance. - Propose the query, model, and anomaly settings as reviewable UI changes through an interaction protocol such as AG-UI.
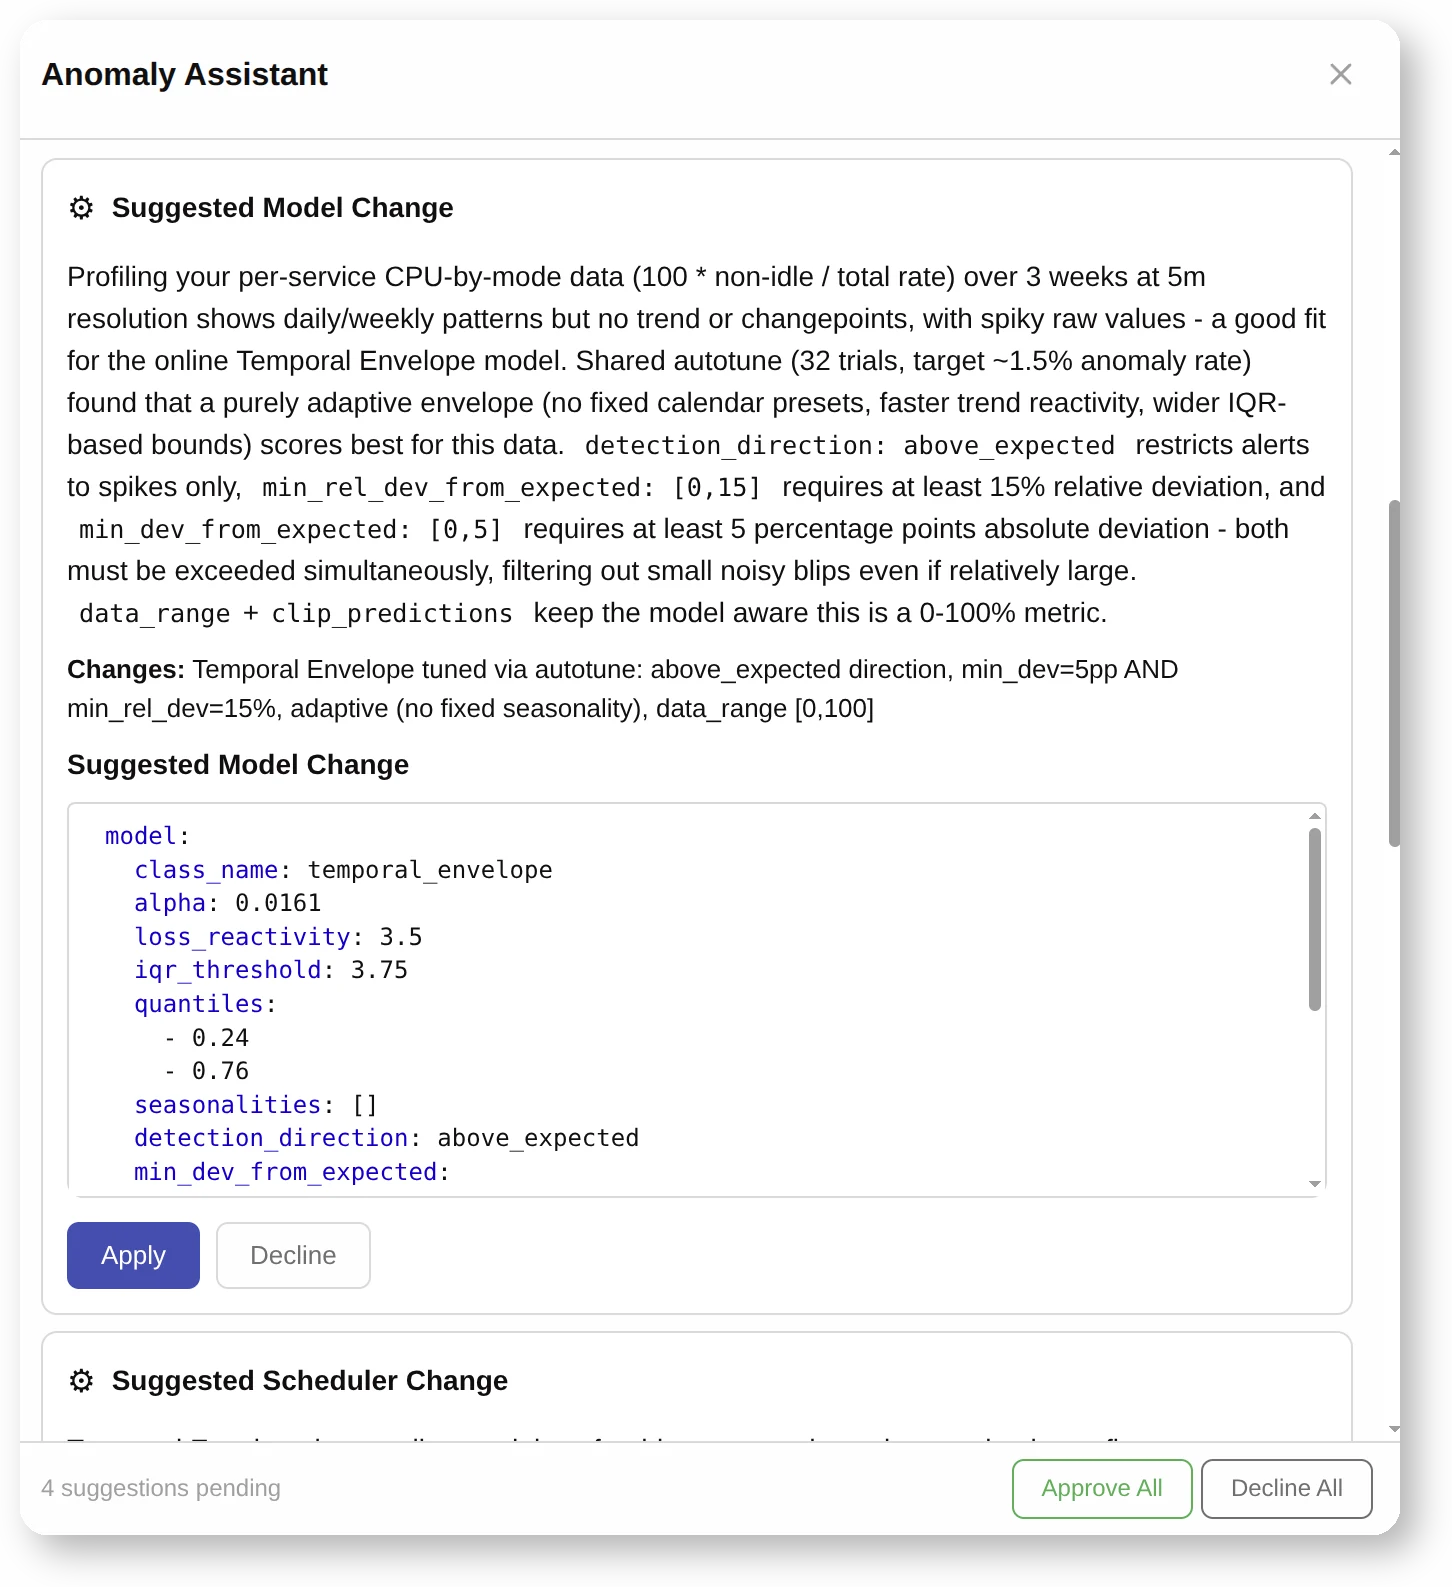
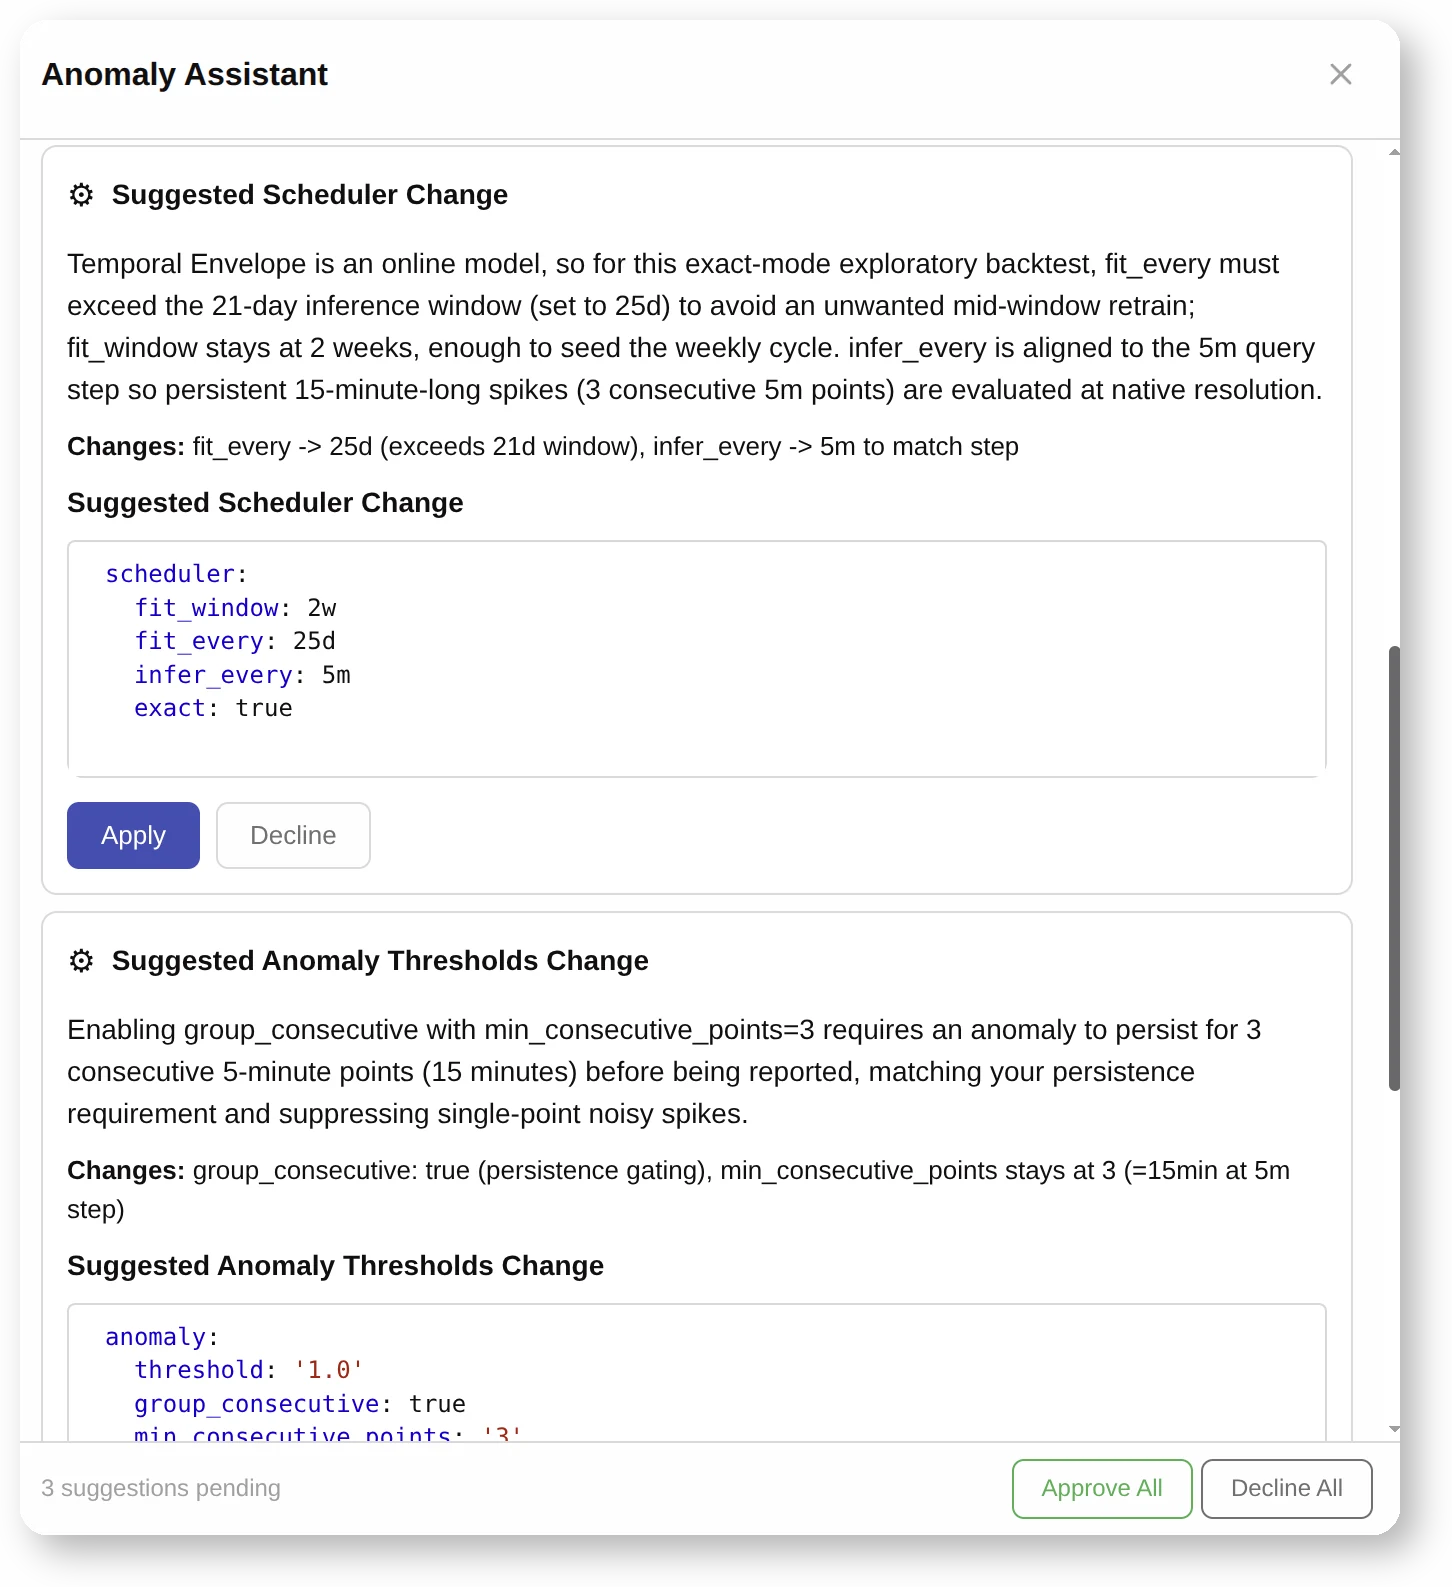
- After user approval, apply the changes, run anomaly detection, and explain whether the result satisfies the original intent.
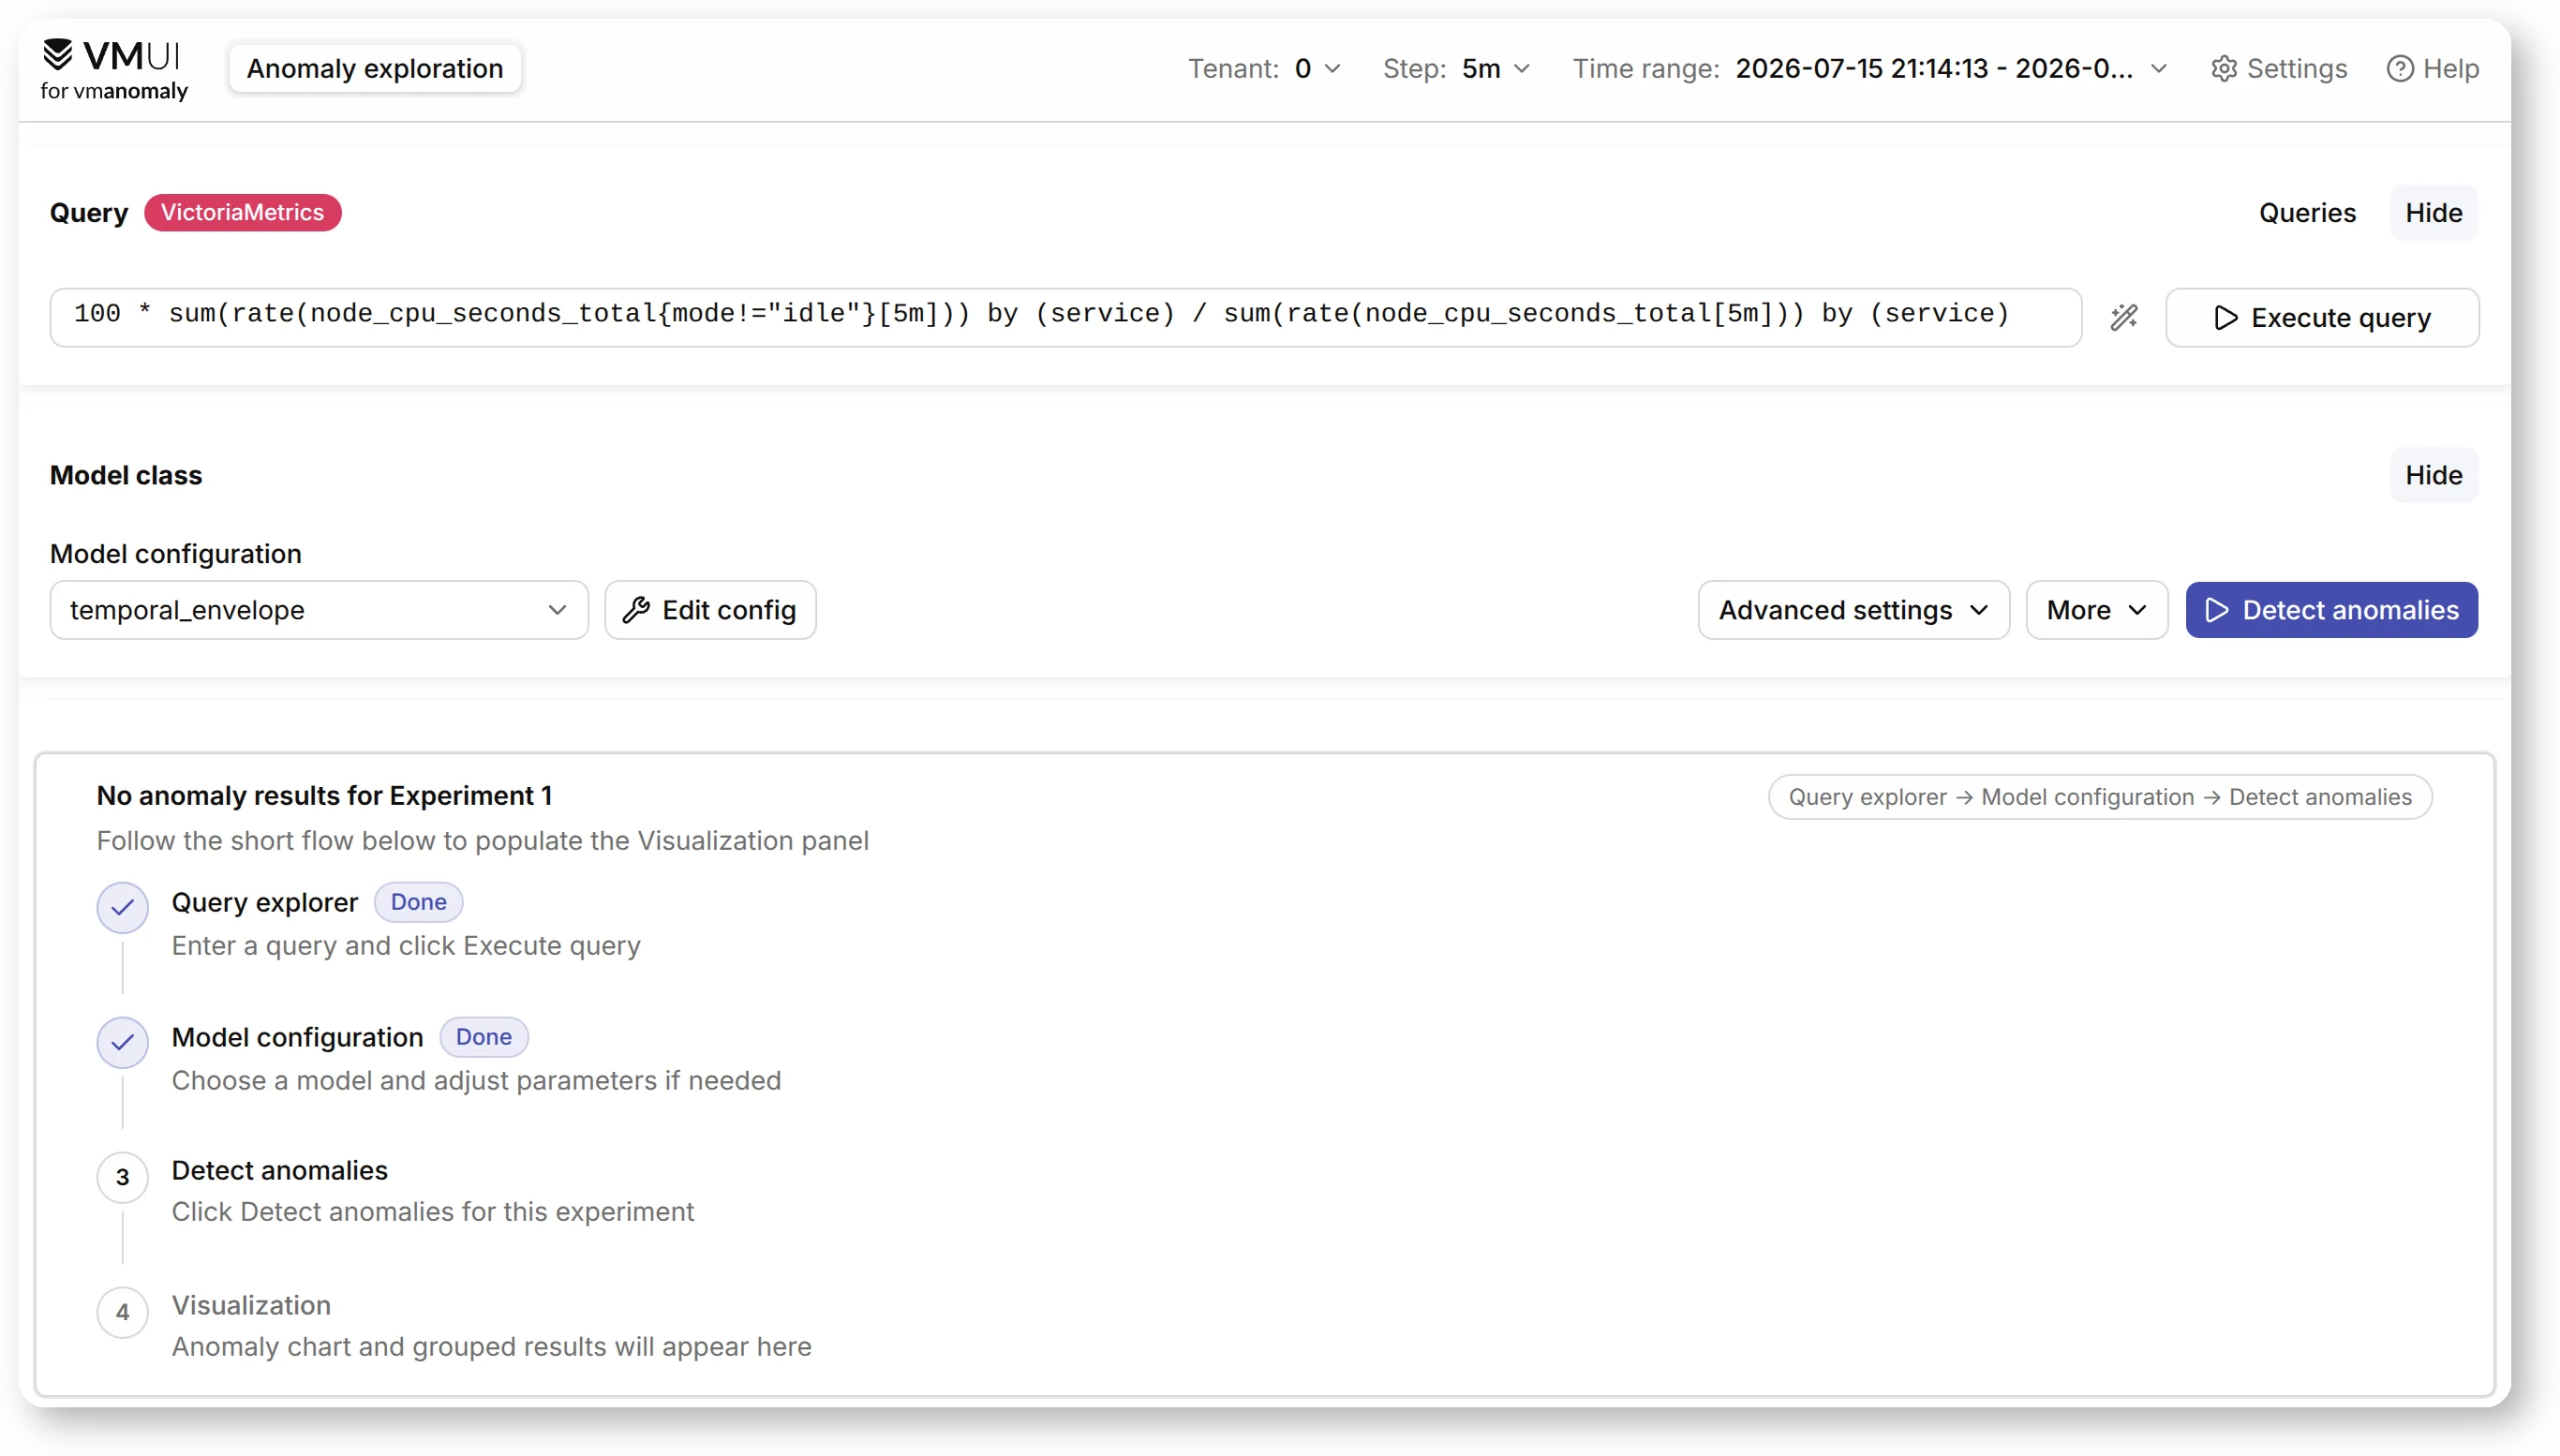
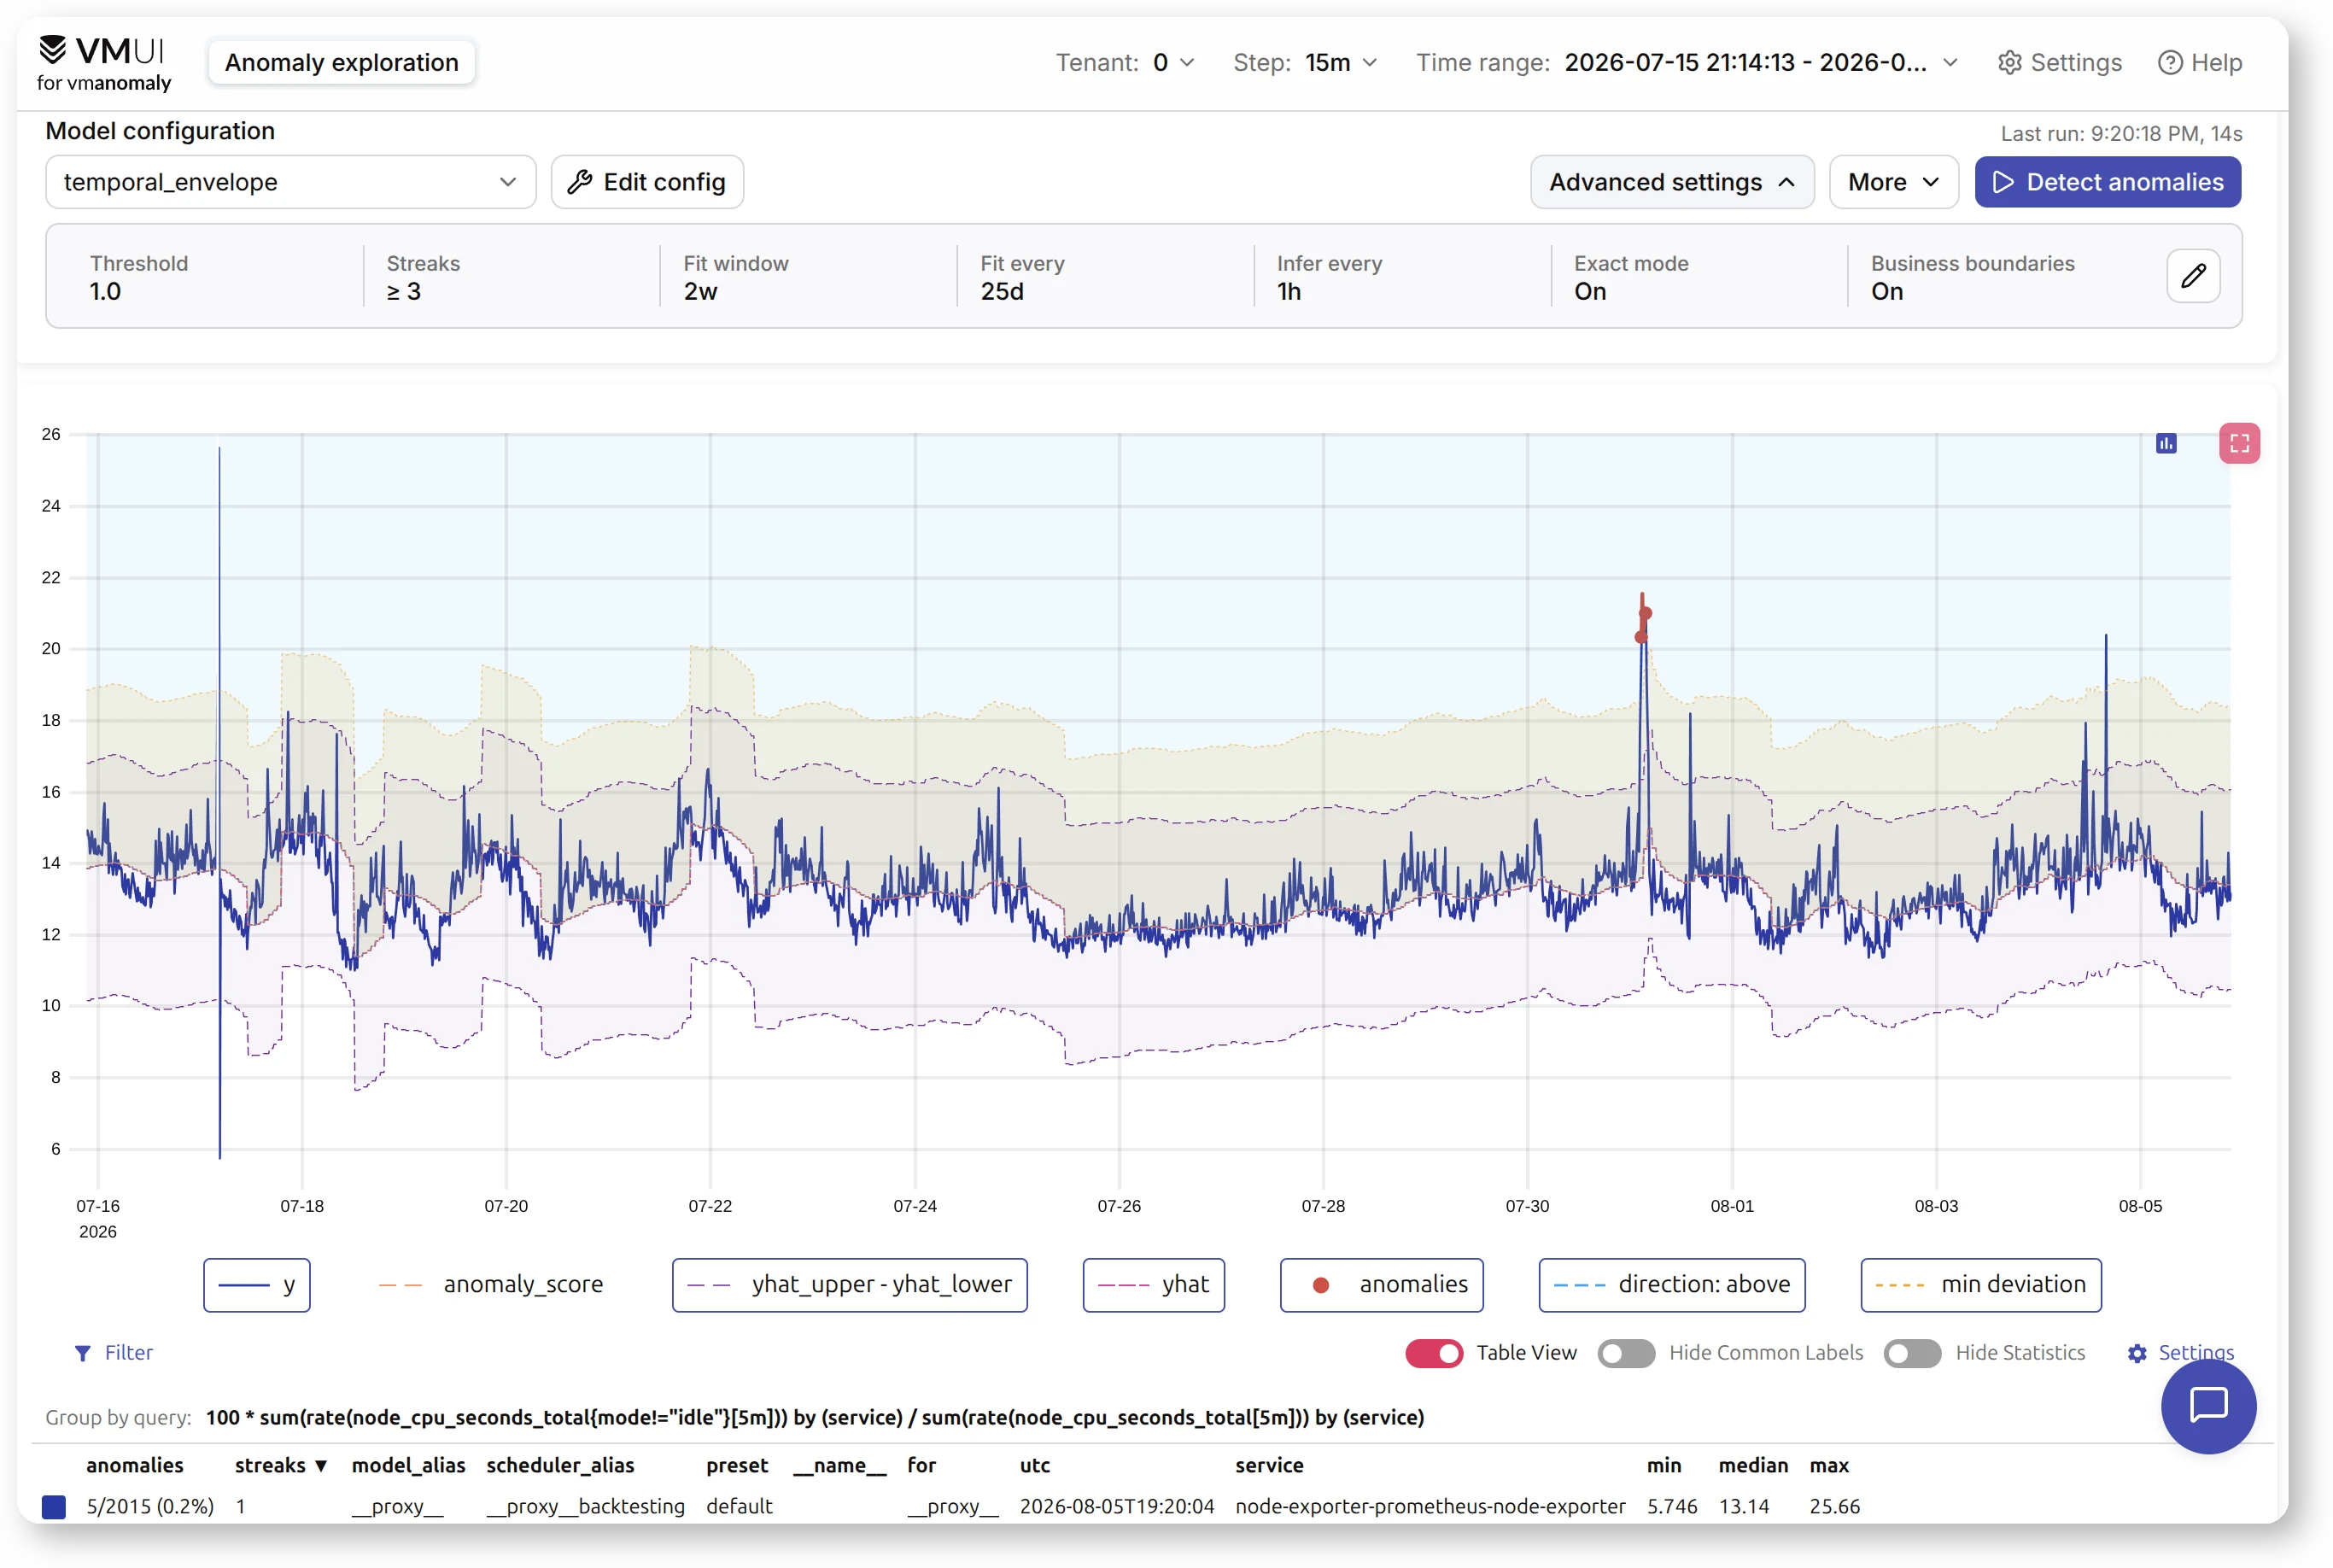
- Export the tested
vmanomalyYAML and correspondinganomaly_score-based vmalert rules for production.
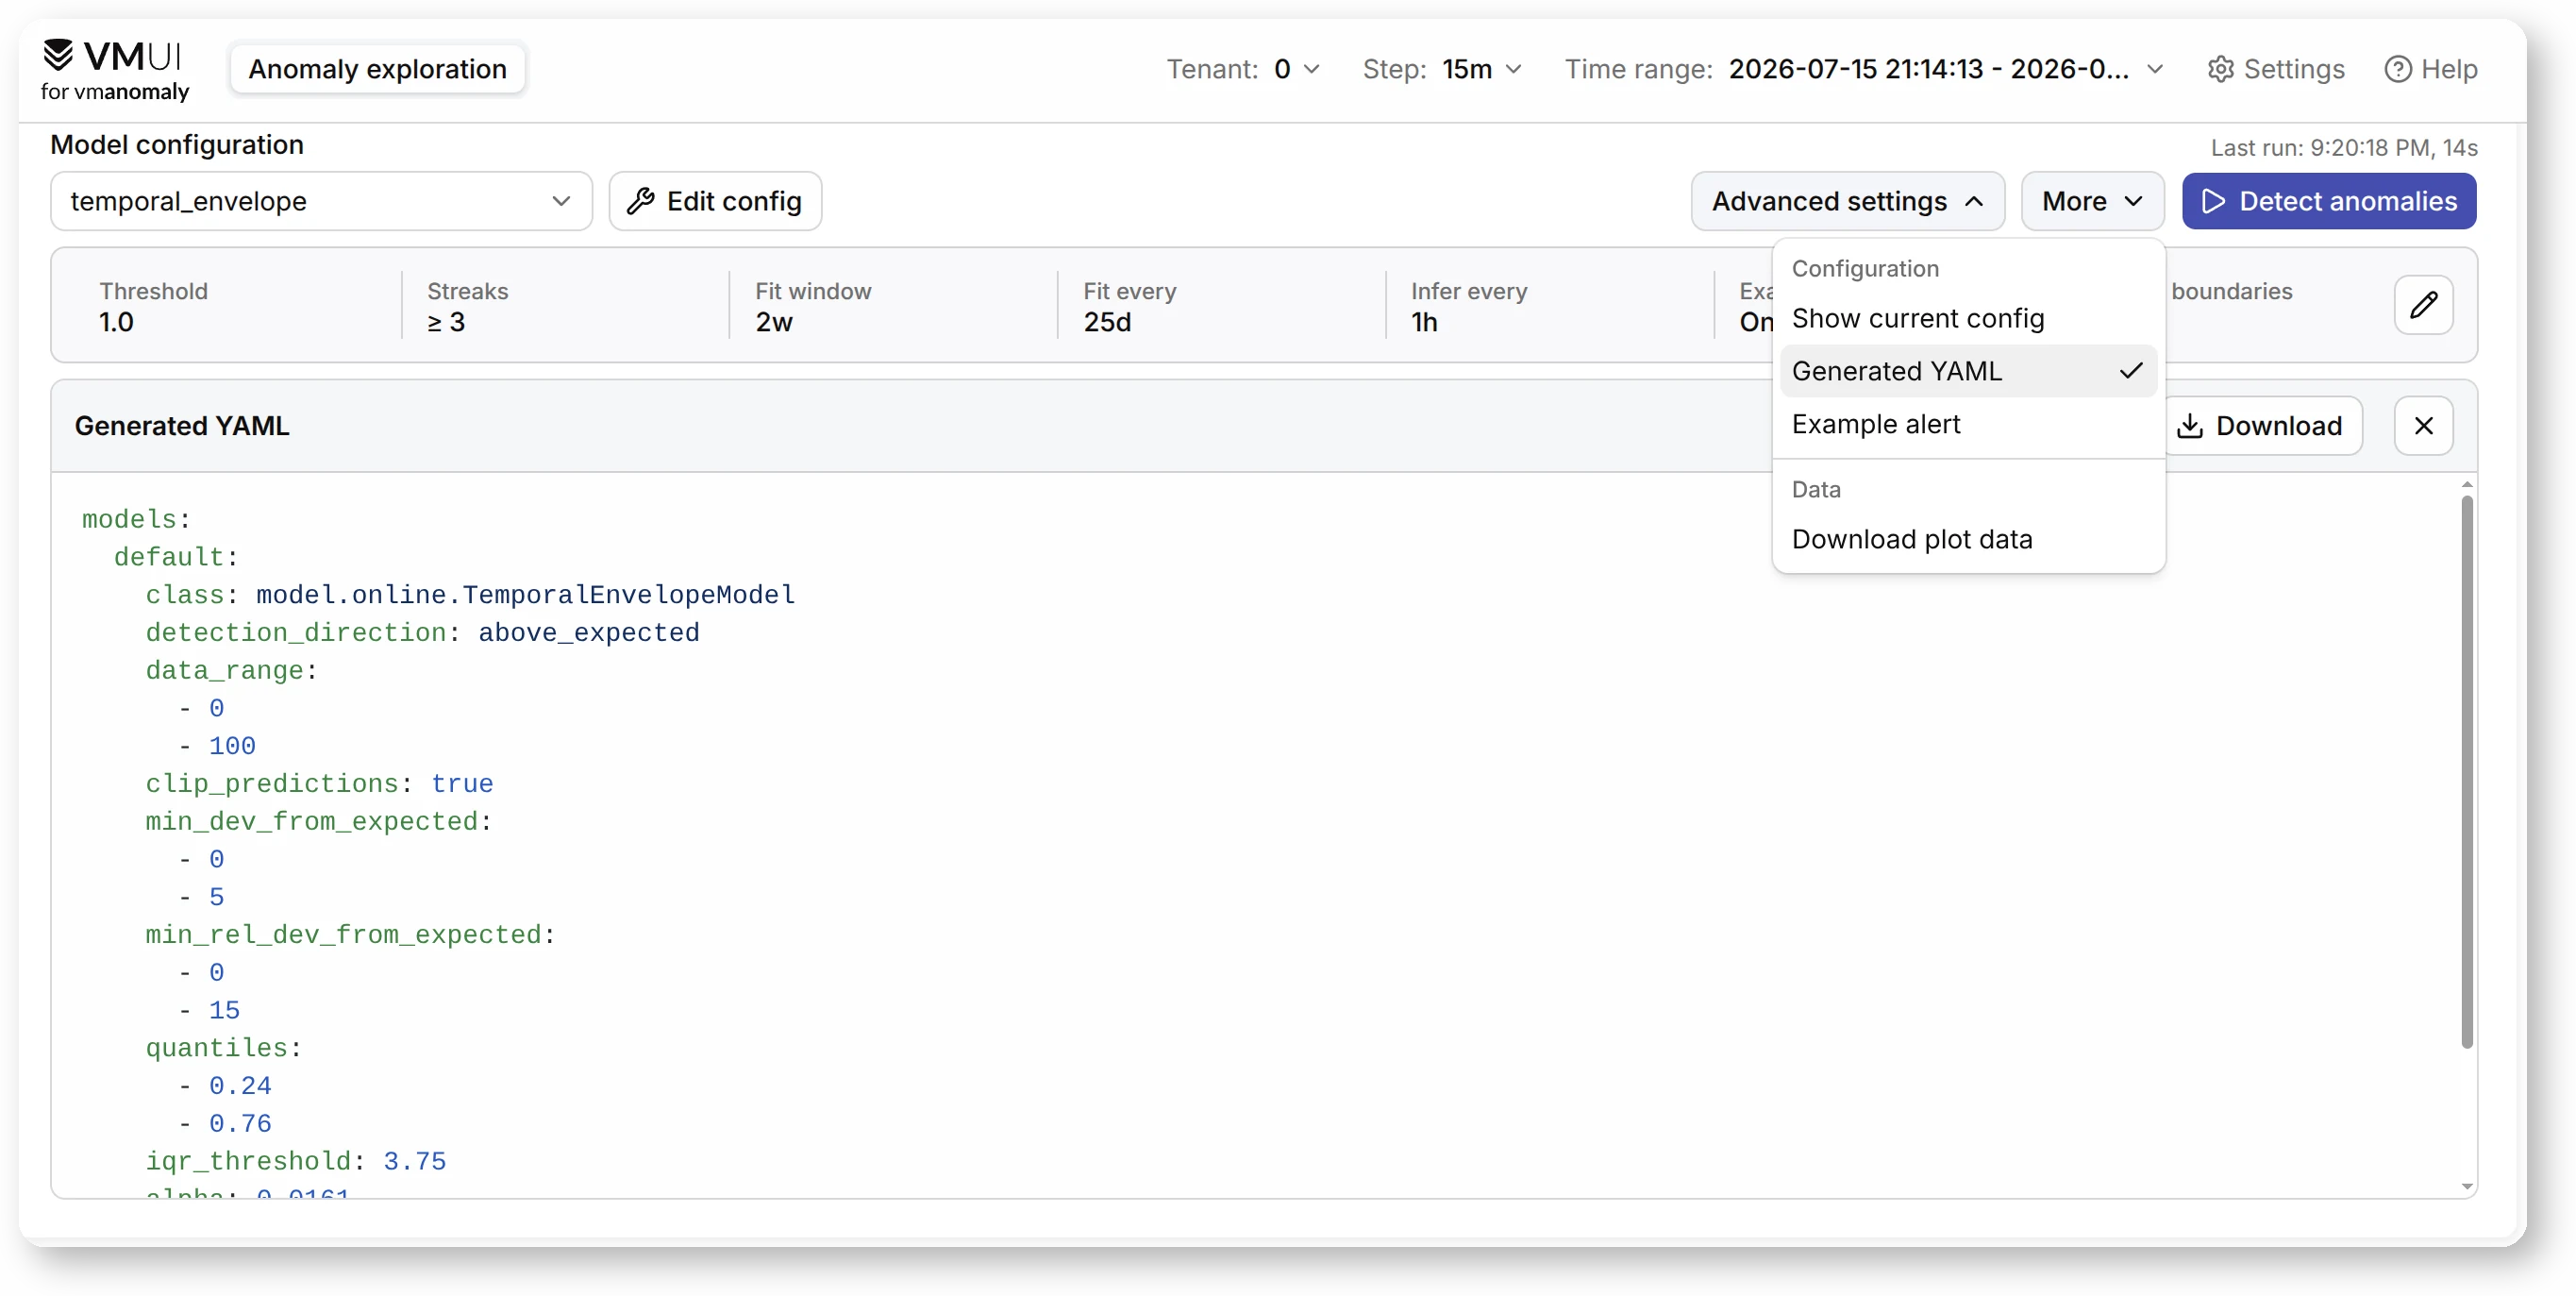
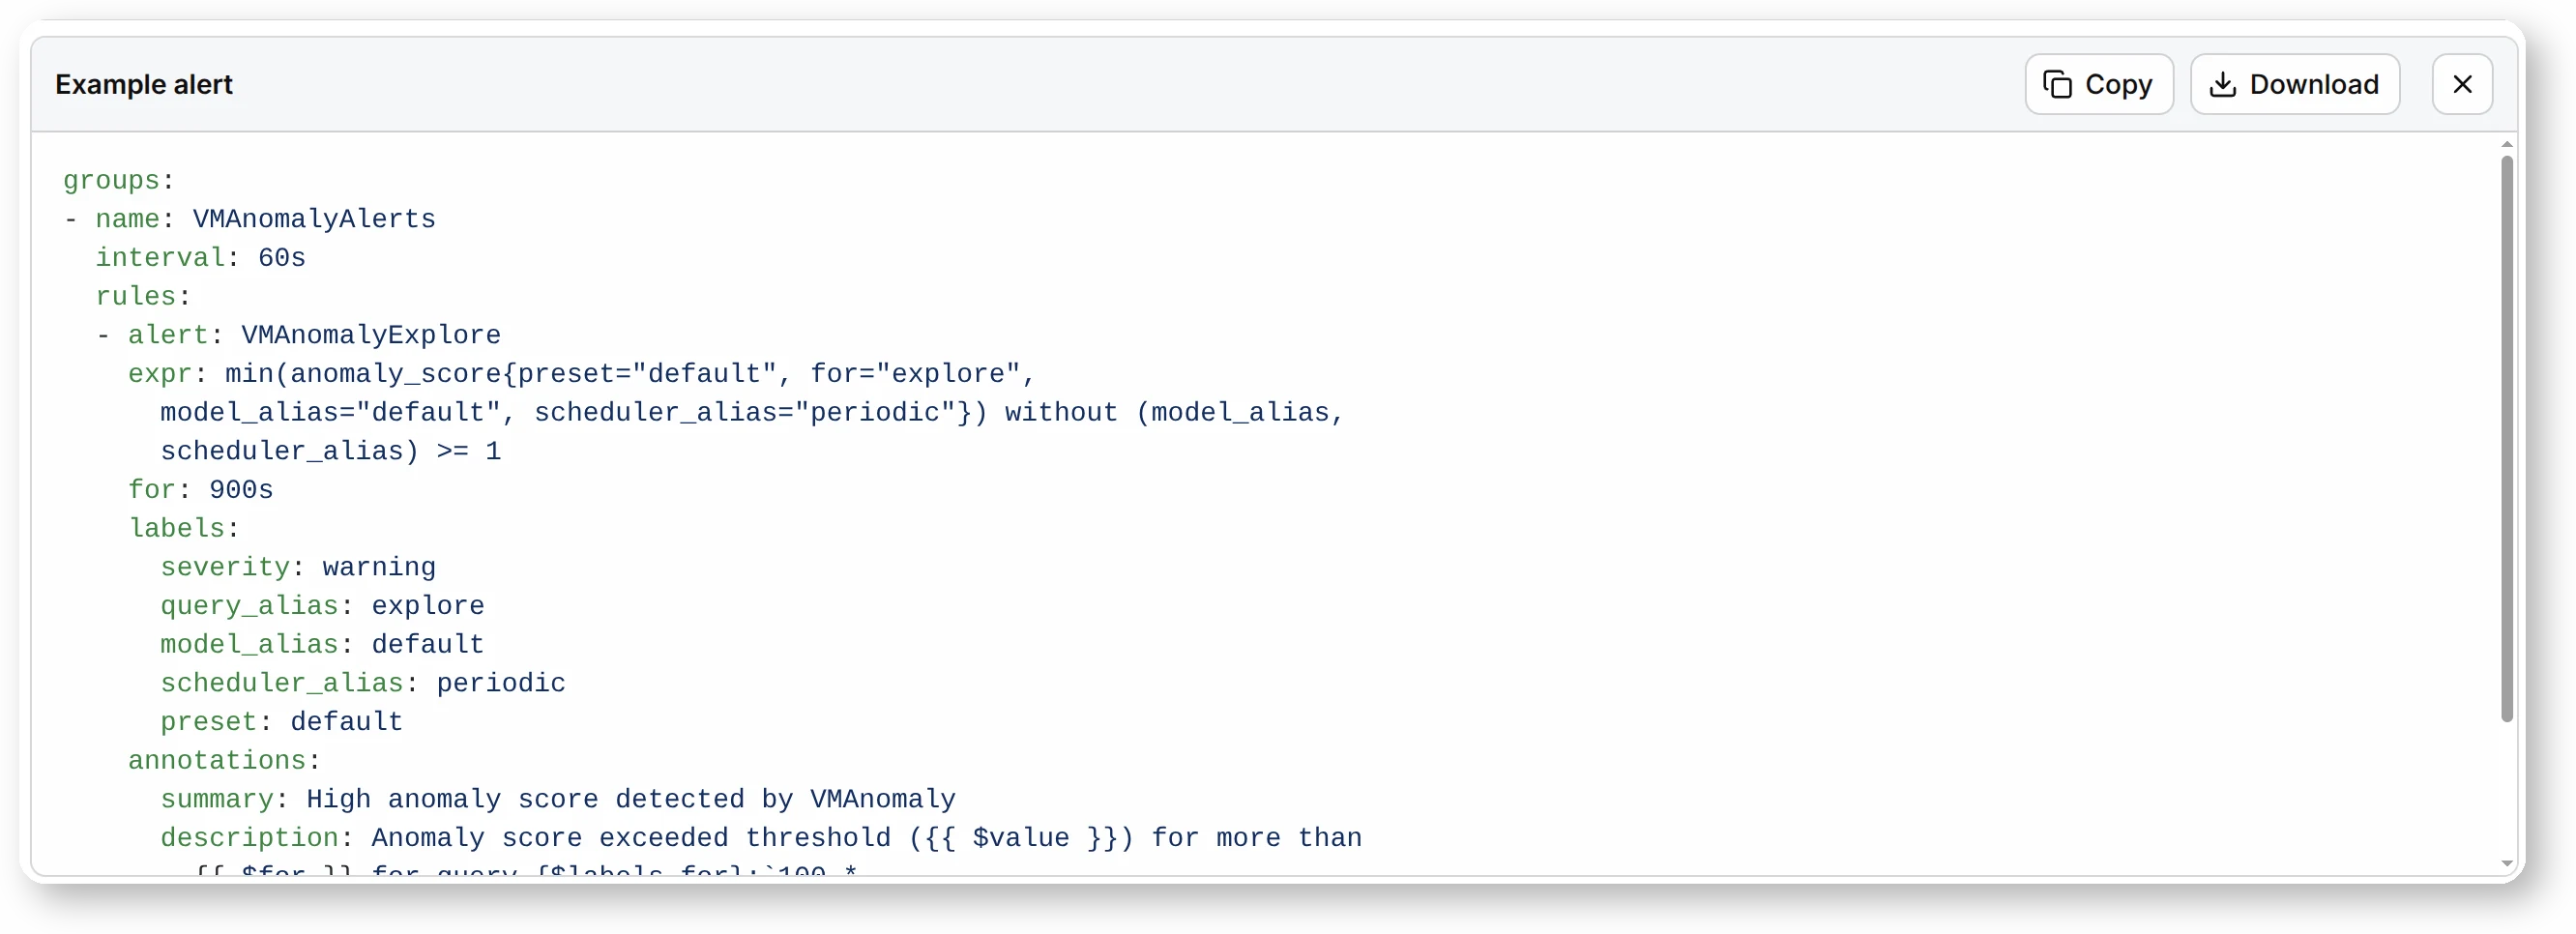
The user remains in control: every proposed change can be accepted, refined, or rejected. In the demo, the resulting anomaly rate is 0.2%, below the requested 2% ceiling, and the UI makes the final prediction boundaries and detected streaks directly reviewable.
The goal is not to hide anomaly detection behind a chat box. It is to reduce the amount of product-specific and ML-specific knowledge required before a developer can test a monitoring idea, while keeping the resulting query, parameters, evidence, and alert rule visible.
Letting Data Guide the Configuration
#
Generic advice is not enough when two queries can have completely different time-series behavior. Starting with v1.30.0, the UI, Copilot, MCP server, and external agents can use the same bounded analysis and tuning APIs:
GET /api/v1/timeseries/characteristicssamples the supplied query and summarizes trend, calendar seasonality, changepoints, gaps, and intermittent or spiky behavior.POST /api/v1/autotune/tasksstarts an asynchronous search for one shared model configuration across sampled series.GET /api/v1/autotune/tasks/{task_id}reports progress and returns the validated configuration.DELETE /api/v1/autotune/tasks/{task_id}cancels work cooperatively without blocking a conversation until a long optimization finishes.
Shared autotune now adapts its evaluation to each model’s capabilities:
- Online models can be evaluated causally in exact mode, so the selected parameters reflect how the model will learn in production rather than a faster but different batch approximation.
- Forecast quality is scored only for models that emit forecasts, keeping comparisons meaningful for detectors that produce anomaly scores alone.
- Business choices such as detection direction can be frozen, preventing optimization from silently changing alerting intent.
- When two configurations perform similarly, a bounded state-complexity term favors the simpler one, reducing unnecessary model state and processing work.
This gives every client the same workflow - inspect → tune → validate → recommend - instead of maintaining separate recommendation logic in the UI, MCP prompts, and automation scripts.
The Same Workflow Through MCP and Skills
#
Similar results can be achieved through the vmanomaly MCP server and purpose-built VictoriaMetrics skills without a dedicated UI. This is useful for agentic observability workflows that launch new anomaly detection installations, investigate existing ones, or review configurations continuously.
The MCP server is the integration layer. It exposes the running service’s health, schemas, scheduled queries, model validation, time-series analysis, autotune tasks, documentation search, configuration generation, and alert-rule generation to compatible AI clients. The client supplies the conversational interface and decides how to combine those tools.
The three vmanomaly skills package that interface into repeatable workflows:
vmanomaly-query- inspect and operate: work with health, schemas, real queries, validation, profiling, autotune, and detection tasks on a running instance.vmanomaly-config- build and verify: profile signals, decide between a static alert and ML, select and tune a model, validate it, and produce deployment-ready configuration and alert rules.vmanomaly-review- audit and improve: review existing models, scheduler settings, model-data fit, false positives, and resource efficiency, then retest proposed changes with before/after evidence.
Together, they let an agent move from intent → real-data analysis → validated configuration → continuous quality review. A developer can ask natural-language questions about anomalous behavior, anomaly scores, alerting rules, or firing alerts without manually composing every MetricsQL expression and API request.
The v0.3.0 MCP release added time-series characteristics and shared autotune; v0.3.1 refreshed the embedded vmanomaly v1.30.1 documentation and hardened tool discovery, secret handling, logs, containers, and release artifacts.
Faster Experiments, Better Production Throughput
#
The workflow is only convenient if a user can iterate quickly and the same configuration remains efficient in production.
v1.29.4 made exact backtesting for online models 2 - 200x faster in representative UI workloads, depending on the model and configuration. The UI also gained stage-aware progress so long runs show whether they are fetching data, fitting, or inferring.
Later releases improved the production path as well:
- high-cardinality periodic inference can scatter model jobs and batch reader-side series processing;
- online prediction intervals use lower-overhead array operations;
- process jobs use bounded batching to amortize multiprocessing and IPC costs;
- on-disk model operation reuses opened artifacts more efficiently;
v1.30.1improved representative service-stage fit by 1.5 - 2.6x and inference by 1.7 - 2.3x for Z-score, MAD, STD, Seasonal Quantile, and Rolling Quantile, depending on model, state mode, and data size;- Seasonal Quantile’s representative weekly-profile on-disk inference improved by 1.8x;
- multi-core Temporal Envelope inference improved by about 2x.
We also aligned exact periodic inference with exact backtesting, fixed missing or duplicate predictions across fit cycles, and restored backward-compatible backtesting cadence. These details matter because a visually good backtest is useful only when the deployed scheduler follows the same causal update sequence.
Operational Reliability and Guardrails
#
Q2 also brought less visible changes that make long-running deployments easier to trust:
- independent datasource fetch and processing timeouts;
- optional per-query series limits and stale-series lookback caps;
- bounded restart attempts and health metrics for failed periodic scheduler workers;
- content-based hot reload for Kubernetes ConfigMap rotations and similar filesystems;
- clearer datasource errors instead of misleading empty-result messages;
- backward-compatible restoration for existing online and autotuned state;
- corrected writer timing and accepted-datapoint self-monitoring metrics;
- safer handling of transient query-task credentials.
These are deliberately not separate workflows. The same configuration validated in the UI or by an agent should be usable by the scheduler, observable through service metrics and logs, and recoverable after restart.
What’s Next?
#
The next direction is to reduce setup work beyond the individual model:
- dynamic builders that discover metadata and important signal subsets for common sources such as Kubernetes, VictoriaMetrics, and
node_exporter, then produce testedvmanomaly,vmalert, and optional dashboard configuration; - assisted root-cause workflows across metrics, logs, and traces;
- a contextual capacity calculator for sizing and scaling
vmanomaly; - deeper integration with VictoriaMetrics Cloud;
- finishing the migration to online models, deprecating offline models;
- as well as further MCP/skills improvements.
Frequently Asked Questions
#
What were the main VictoriaMetrics Anomaly Detection updates in Q2 2026? The main updates were the online Temporal Envelope model, a redesigned UI, 2 - 200x faster exact online-model backtesting in representative configurations, faster scheduled online inference, time-series characteristics and asynchronous shared-autotune APIs, and a common AI-assisted workflow across UI Copilot, MCP, and VictoriaMetrics skills. This roundup includes the v1.30.1 follow-up that completed and stabilized the Q2 work.
What is Temporal Envelope? Temporal Envelope is a bounded-state online model for time series with trend, changepoints, one or more calendar patterns, holidays, and optional forecasts. Its multivariate form can also identify anomalies caused by changes in relationships among multiple input series. It is the preferred starting point for complex new configurations, while MAD or Z-score remains appropriate for simple stationary signals.
Does Temporal Envelope replace Prophet and Isolation Forest? It is the recommended migration target for most new Prophet-like forecasting and Isolation-Forest-like multivariate anomaly detection configurations, especially when continuous online adaptation and bounded state are important. Existing offline models remain supported during the deprecation period, and model choice should still be validated on representative data.
How does the AI Copilot create a production configuration? It translates a natural-language monitoring goal into a query, inspects sampled time-series characteristics, selects and optionally tunes a model, applies business constraints, validates the result against the running service, and proposes reviewable UI changes. After the user tests the chart, the UI can export both vmanomaly YAML and an anomaly-score-based vmalert rule.
What is the difference between MCP and vmanomaly skills? MCP provides a standardized integration layer through which an AI client can call vmanomaly tools and read product documentation. Skills describe repeatable workflows - such as building, operating, or reviewing an anomaly detection configuration - that combine those tools in a reliable order.
Is the AI Copilot required? No. Every query, model setting, validation result, generated configuration, and alert rule remains available through the UI and APIs. MCP and skills also support the same workflow from compatible external AI clients.
Can vmanomaly tune one model for many time series? Yes. Shared asynchronous autotune samples a bounded set of series and searches for one validated model configuration. It can use time-series characteristics to narrow the search, exact causal validation for online models, business constraints such as maximum anomaly volume, and model-state complexity as a tie-breaker.
I am Fred Navruzov and have previously worked as a Data Science Lead at Ukrainian and international companies such as Competera, Rozetka, and TiltingPoint. Since 2023, I have been leading the Anomaly Detection team at VictoriaMetrics.