- Blog /
- Anomaly Detection for Time Series Data: Anomaly Types
Anomaly Detection for Time Series Data: Anomaly Types
Share:


Welcome to the second chapter of the handbook on Anomaly Detection for Time Series Data!
This series of blog posts aims to provide an in-depth look into the fundamentals of anomaly detection and root cause analysis. It will also address the challenges posed by the time-series characteristics of the data and demystify technical jargon by breaking it down into easily understandable language.
This blog post (Chapter 2) is focused on different types of anomalies. Furthermore, we underscore the challenges involved in identifying each type of anomaly and offer insights on how to tackle them effectively for better observability.
Blog Series Navigation:
- Chapter 1: An Introduction
- Chapter 2: Anomaly Types (you are here)
- Stay tuned for the next chapter on anomaly detection: Techniques and Models!
The Role of Anomaly Detection in Observability Systems
#
Anomalies, are more than just irregular data points in a dataset. Especially in time-series data, they carry significant implications for the entirety of monitoring and observability mechanisms. While anomaly detection is crucial, it’s merely a subset of a broader observability strategy.
Understanding anomaly types, introduced by time series nature of a data, is practical for streamlining real-time alerting and modeling. Each anomaly type may need a different approach, whether it’s a simple threshold-based rule or sophisticated machine learning models accounting for temporal and spatial contexts, like trends or seasonalities. Responses vary too; a point anomaly in finances might call for swift human action, while a contextual anomaly in energy consumption might trigger a slower, automatic action.
Disclaimer: There is no “one-size-fits-all” model in anomaly detection. The quest is not just about grasping different anomaly types but also recognizing the model class best suited for each type. Remember, anomaly detection, while vital, is just a piece in the larger puzzle of building an effective observability system. Combined with smart alerting and anomaly scores, it can significantly improve the stability and the quality of your monitoring.
Categories of Anomalies
#
While this classification is not exhaustive, in the scope of anomaly detection, anomalies generally fall into one of three primary categories:
- Point anomalies
- Contextual anomalies
- Collective anomalies (notably including novelties and changepoints)
For each of these anomaly types, the subsequent section will provide:
Example Use Cases- A collapsible list showcasing real-world examples.Properties- This segment delves into the distinct attributes an anomaly detection solution might need to effectively handle that specific anomaly type.Models- This section points to Machine Learning models or model categories that are commonly deemed suitable defaults for the given anomaly type.Alerting Heuristics- This part enhances the generated anomaly_scores by integrating alerting heuristics, optimizing accuracy and minimizing the risk of alert fatigue. While not required, familiarity with MetricsQL/PromQL is beneficial for a more comprehensive grasp of the query templates.
Point Anomalies
#
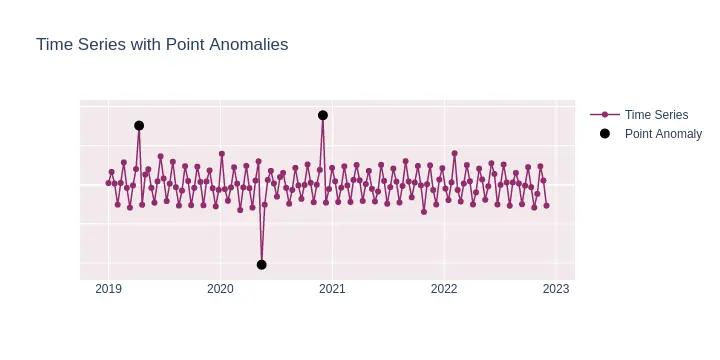
A point anomaly is a single instance of data that is too far off from the rest. This occurs when a particular data sample significantly differs from the distribution of the data. For example, in credit card fraud detection, the purchase of a high-value item can be considered a point anomaly.
It does not take context or sequence nature of a time series into account. A point anomaly is most similar to what is traditionally named an “outlier”.
Example Use Cases
Credit Card Fraud: A single high-value transaction can be indicative of credit card fraud.
Healthcare: A sudden high reading on a patient’s vitals could indicate a medical emergency.
Network Security: A sudden rapid spike in network traffic could be a sign of a Distributed Denial of Service (DDoS) attack.
E-commerce: An unusual pattern of product returns from a particular user could indicate fraudulent activities.
Energy Consumption: A sudden surge in electricity usage in a household might indicate faulty appliances or unauthorized use.
For detecting point anomalies, models that assess the fundamental statistical attributes of a distribution tend to be highly effective. Point anomalies are essentially individual data points that significantly diverge from the mean or median of the distribution, which makes them relatively straightforward to identify. If the time series data exhibits a trend, it can generally be de-trended through a simple differencing technique. In this approach, each data value is substituted with the difference between its current and preceding value, expressed as Yₜ = Yₜ - Yₜ₋₁, where t represents a specific time point, Y denotes the time series and Yₜ denotes value of a series Y at particular time point t.
Properties: Univariate or multivariate nature of the models, depending on whether you are analyzing a single time series or multiple time series at once.
Models: Z-Score or similar simple models.
Alerting heuristics:
When anomaly_score is available, use it to detect anomalies. To detect one higher anomaly, an example alerting rule could be:
- alert: YourAwesomeAlertName
  expr: avg_over_time(anomaly_score[5m]) > 1
This examines the average anomaly score over the last
period=5mand triggers if it’s abovethld=1. You can use any other reasonable alerting thresholdTo reduce the chances of alerting fatigue, use
forto ensure persistence of the anomaly before actual alerting (following VMAlert syntax and alert states):- alert: YourAwesomeAlertName expr: anomaly_score > 1 for: 10mThis ensures the anomaly condition persists at least for
period=10minutes before alerting takes place.
Contextual Anomalies
#
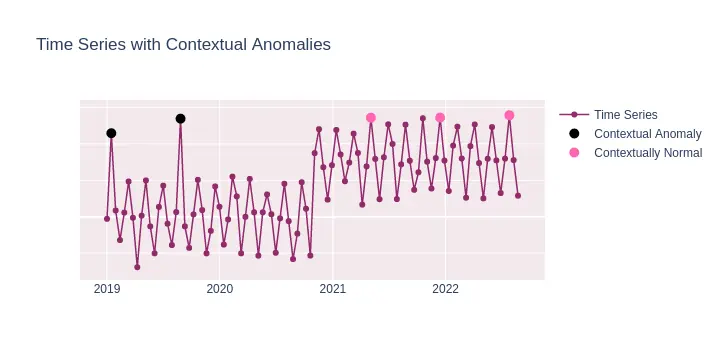
Contextual anomalies refer to data points that deviate significantly within a specific context but appear normal outside of that context. For example, high network bandwidth usage during regular office hours might be standard due to employees accessing cloud services and collaborating online. However, the same level of bandwidth usage late at night, when the office is expected to be closed, would be regarded as a contextual anomaly. Such an anomaly could suggest unauthorized access or a malfunctioning device.
To sum up, this type of anomaly is only considered anomalous within a specific context (e.g., time of day, season). It takes into account the surrounding data points when determining its anomalous nature and temporal nature of the time series.
Example Use Cases
Energy Consumption: High energy consumption during daytime hours is typically normal, especially in commercial areas. However, if a similar high consumption is observed late at night in a residential area when most households are inactive, it becomes a contextual anomaly.
Website Traffic: An increase in website traffic during a promotional event or marketing campaign is anticipated. Still, a surge during off-peak hours or when no such events are active might indicate a contextual anomaly, possibly due to bot traffic or technical issues.
Retail Sales: A store might experience high sales during holiday seasons or promotions. Yet, observing a similar sales spike on a regular weekday would be considered out of context.
Healthcare Monitoring: In a hospital setting, increased patient heart rates are expected during physical activities or specific treatments. However, a sudden spike in heart rate during a period of supposed rest could be a contextual anomaly, potentially indicating a medical issue that requires immediate attention.
Public Transportation: High passenger counts during rush hours are standard on public transit. However, an unusually high number of passengers late at night or early morning might indicate an event or disruption causing the anomaly.
As contextual anomalies require understanding of the data in its given context, such as seasonality or a known pattern. Therefore, models that can capture these patterns in data are usually more effective.
Properties: Must be able to handle trends and seasonalities, sometimes requiring hyperparameter tuning to capture the context properly.
Models:
- Prophet, Seasonal-Trend decomposition using LOESS (STL).
- Generally, forecasting-based methods should perform reasonably well, combined with proper alerting.
Alerting heuristics:
The usage of abovementioned models for producing anomaly scores for a single data point has already taken into account possible seasonality and trends present in your time series data.
As usual, prioritize the anomaly_score as your primary signal for anomalies. For a basic alert to catch one peak anomaly, consider:
- alert: YourAwesomeAlertName
  expr: avg_over_time(anomaly_score[5m]) > 1
This examines the average anomaly score over the last
period=5mand triggers if it’s above 1.For reducing false positives during periods of historically high variability, you can compare the recent
anomaly_scorewith its historical counterpart, aiming for relative alerting. For example:- alert: YourAwesomeAlertName expr: avg_over_time(anomaly_score[1h]) > (1.5 * avg_over_time(anomaly_score[1h] offset 24h))This triggers an alert if the average score over the past hour is more than
X=1.5times its average over the correspondent pastperiod=1h(offset byseasonality=24h).If there are certain periods during which anomalies are more likely (like off-peak hours), use conditional alerting to only focus on those times. Example:
- alert: YourAwesomeAlertName
  expr: avg_over_time(anomaly_score[5m]) > 1 and (hour() < 8 or hour() > 20)
This only triggers an alert for anomalies that occur during off-peak hours.
Collective Anomalies
#
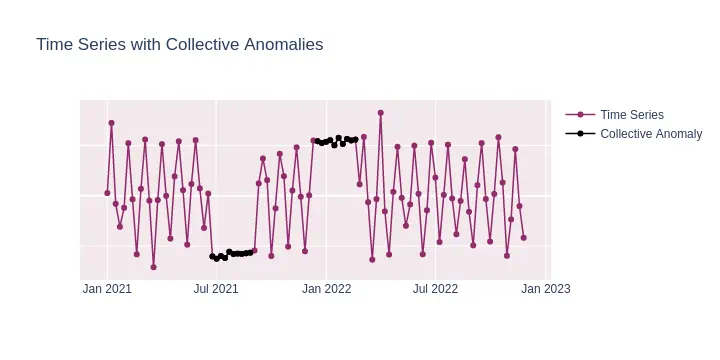
Collective anomalies involve a set of data points that, when considered together, deviate from what is expected, even though individual points may not qualify as anomalies. For instance, multiple small transactions made repeatedly by someone to evade detection would form a collective anomaly.
Example Use Cases
Intrusion Detection: Multiple login attempts originating from the same IP address within a brief time frame could constitute a collective anomaly.
Healthcare: A steady decline in a patient’s vital signs may signal a collective anomaly, indicating a deteriorating health condition.
Financial Markets: Unusual trading patterns, such as synchronized buying and selling of shares, might represent a collective anomaly.
Traffic Management: A sudden and sustained reduction in road traffic could be a collective anomaly possibly due to an unreported event or incident.
Supply Chain: Consistently late deliveries from a supplier over a short period may not be individually significant but collectively could indicate a larger logistical issue.
For collective anomalies, the emphasis should be on identifying patterns or sequences of values that, as a collective, deviate from the expected, rather than individual outlier values. Here’s an adapted version focusing on the anomaly_score and ensuring alerts capture prolonged anomalous behaviors:
Properties: Able to analyze sequences and capture temporal dependencies, often requiring training on longer sequences to understand the collective behavior properly.
Models:
- Prophet, Seasonal-Trend decomposition using LOESS (STL)
- Much more sophisticated models like LSTM or Autoencoder-based neural networks.
- As in contextual anomaly case, forecasting-based methods should perform reasonably well, combined with proper alerting.
Alerting heuristics:
Use roll-up functions to monitor the anomality of data points that exceed a threshold in the
anomaly_score. A high proportion might indicate a collective anomaly. For instance:- alert: YourAwesomeAlertName expr: quantile_over_time(0.5, anomaly_score[period]) > 1This inspects if the roughly
q=50%of data points overperiodwindow had high anomaly_scores > 1.To account for proportion of anomalies over longer windows use share_gt_over_time:
- alert: YourAwesomeAlertName
  expr: share_gt_over_time(anomaly_score[period], 1) > 0.5
This looks at a
periodwindow and triggers if more thanshare = 50%of the data points in that window had ananomaly_scoregreater than 1.
Novelties
#
Novelty is an unobserved pattern in the data that occurs for the first time. Unlike outliers, novelties represent changes in the underlying system that produces the data, suggesting a new, previously unobserved state of the system.
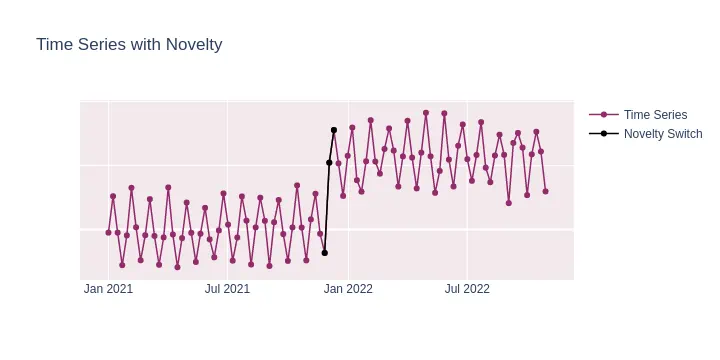
For example, when there is a distinct switch from one regime to another, even if both regimes are individually considered normal, the transition point between them (the change point) introduces a “newness” or unexpected behavior in the data. This sudden change in behavior or structure is what makes it a novelty.
In time series analysis, change points often signify structural breaks, shifts in the mean, variance, or other properties of the series. The key aspect of a novelty, in this context, is that it represents a previously unobserved state or behavior of the system, even if that state or behavior itself is within normal bounds. The sudden and unexpected transition between two such states is what makes the change point a novelty.
From that perspective, novelties can be seen as a special case of collective anomaly
Example Use Cases
E-commerce: Previously steady sales of a product are disrupted by a sudden and sustained increase, possibly indicating a successful marketing campaign or an external event boosting its popularity.
Social Media: A brand that usually receives a consistent number of mentions per day suddenly experiences a prolonged surge, potentially due to a viral trend or significant event related to the brand.
Stock Market: A stock that traded within a narrow range for months breaks out sharply, suggesting a regime change perhaps due to significant company news, acquisitions, or broader market shifts.
Healthcare: In a region where certain diseases have been stable or declining, there’s a sudden and consistent rise in specific ailment cases, indicating a potential outbreak or a new environmental factor at play.
Transportation: After years of steady growth, public transit ridership unexpectedly plateaus or declines over several months, hinting at a shift in commuter behavior, possibly due to factors like increased remote work or new transportation alternatives.
Properties:
- Focuses on the identification of new patterns that haven’t been observed before.
- Often requires a continuous retraining or adaptation of the model to account for the new patterns in the data.
- Needs a mechanism to distinguish between temporary shifts and lasting changes in the data.
Models:
- One-Class SVM: Used for detecting the “newness” in the data.
- Isolation Forest: Can be adapted for novelty detection by focusing on new patterns.
- Autoencoders: By training on “normal” data, the high reconstruction error can indicate novel patterns.
- Any other novelty detection model that operates under the assumption that its training data represents “normal” behavior. This helps the model effectively delineate the boundary between normal observations and potential (previously unobserved) anomalies.
- Any models, specifically developed for changepoint detection in time series, like Cumulative Sum (CUSUM)
Note: VictoriaMetrics Anomaly Detection allows for the integration of custom Machine Learning models that adhere to a straightforward API, featuring .fit() and .infer() methods. This flexibility enables users to incorporate tailored models that better address their specific tasks.
Alerting heuristics:
It is safe to apply the same alerting heuristics as for point anomalies to catch short-range novelties
Would you like to test how VictoriaMetrics Anomaly Detection can enhance your monitoring? Request a trial here or contact us if you have any questions.
Leave a comment below or Contact Us if you have any questions!
comments powered by Disqus