- Blog /
- Anomaly Detection for Time Series Data: An Introduction
Anomaly Detection for Time Series Data: An Introduction
Share:


Welcome to the handbook on Anomaly Detection for Time Series Data!
This series of blog posts aims to provide an in-depth look into the fundamentals of anomaly detection and root cause analysis. It will also address the challenges posed by the time-series characteristics of the data and demystify technical jargon by breaking it down into easily understandable language.
Blog Series Navigation:
- Chapter 1: An Introduction (you are here)
- Chapter 2: Anomaly Types
- Chapter 3: Techniques and Models
- Stay tuned for the next chapter on anomaly detection: Root Cause Analysis!
This blog post (Chapter 1) is focused on:
- Fundamentals of anomaly detection.
- The role and objectives of anomaly detection within your observability system.
- The glossary which serves as a foundational reference for terminology used in our articles. While it’s not mandatory to read it in its entirety all at once, you will find that we consistently use the terms defined therein to maintain a unified language throughout our publications on anomaly detection topics.
What is Anomaly Detection?
#
Generally speaking, anomaly detection refers to the task of identifying unusual patterns that do not conform to expected behavior. As you may have noticed, this definition is pretty broad, and in reality it heavily depends on:
- The nature of your data.
- The industry your company operates in.
- On particular business context you have.
However, regardless of the definition variations, anomalous events can have significant implications on your business, especially if they go undetected or are misinterpreted.
Examples of (time series) anomalies
Hardware Monitoring System
Scenario: Overheating in Data Centers
Anomaly: Sensors detect temperatures exceeding safe thresholds in specific server racks.
Consequence if Untreated: Potential hardware damage, data loss, and extended downtime.
Intention: "Keep your hardware cool and operational. Detect temperature spikes before they burn your assets."
Energy Provider
Scenario: Unusual Energy Consumption
Anomaly: A sudden drop in energy use in a major city district.
Consequence if Untreated: Misallocation of energy resources, causing potential blackouts elsewhere.
Intention: “Keep the lights on everywhere. Detect anomalies before they become outages.”
Online Streaming Service
Scenario: Streaming Quality Drops
Anomaly: A sudden increase in buffering complaints from a specific region.
Consequence if Untreated: Loss of subscribers due to poor user experience.
Intention: “Every second of buffering costs. Ensure seamless streaming with real-time anomaly detection.”
Financial Institution
Scenario: Credit Card Fraud
Anomaly: Unusual spending patterns on a customer’s credit card.
Consequence if Untreated: Financial losses and eroded customer trust.
Intention: “Protect your customers’ wallets and trust. Spot anomalies before they escalate.”
Supply Chain Management
Scenario: Shipping Delays
Anomaly: A sudden increase in shipping times from a specific warehouse.
Consequence if Untreated: Dissatisfied customers, increased return rates, and potential contract penalties.
Intention: “Keep your shipments on track. Detect disruptions before they derail your business.”
Social Media Platform
Scenario: Drop in User Engagement
Anomaly: A sudden decline in daily active users for a popular feature.
Consequence if Untreated: Lost advertising revenue and potentially losing users to competitors.
Intention: “Engagement drops can be silent killers. Stay ahead with timely anomaly alerts.”
Companies must detect anomalies quickly and accurately to reduce and prevent future losses.
Anomaly detection, therefore, becomes an important topic in data science.
The main challenge of anomaly detection modeling is either taking anomalies as normal patterns, or normal patterns as anomalies.
If a model mis-classifies an anomaly as normal and lets it go unnoticed, the business may result in an unrecoverable loss based on the severity of a case
(for a second, consider malfunctions on nuclear power plants).
On the other hand, a model that creates too many false alarms is not helpful because it constantly disrupts regular operation routines, prompting users to “silence” such tools.
Time Series Data
#
Detecting anomalies is hard. Detecting anomalies in time series data is even harder, as it adds an extra layer of complexity due to the nature of the underlying data.
Time series data, unlike regular numeric datasets, comes with a chronological order, a time axis, that adds an additional dimension to the data. This time component can introduce trends, seasonality, and the other patterns that complicate the detection of anomalies.
Why is Anomaly Detection Not Enough?
#
While anomaly detection is an outstanding and critical component of any observability system, it is not sufficient by itself. Anomalies signify deviations from the norm, but understanding the implications of these deviations requires a robust monitoring and alerting system.
A comprehensive monitoring solution allows you to observe your data, providing valuable context for the anomalies detected. Furthermore, alerting tools ensure that you are promptly informed when an anomaly occurs, enabling quick response and mitigation.
In essence, integrating anomaly detection with robust monitoring and alerting mechanisms creates an end-to-end observability system.
This system not only identifies anomalies but also offers actionable insights, making it a vital asset in managing and understanding your data.
As an example, the VictoriaMetrics product ecosystem, which includes Anomaly Detection and Alerting, is designed to provide such a comprehensive solution.
Why is Simple Rule-Based Alerting Not Enough?
#
While simpler rule-based alerting systems with constant thresholds on raw or pre-aggregated metrics can be effective in certain situations, they often fall short when dealing with complex time series data.
Such rule-based systems rely on predefined thresholds or conditions to trigger alerts.
However, time series data often exhibit complex behaviors and patterns that can’t be effectively captured by simple rules, thus requiring Machine Learning (ML)-based alerting:
- For instance, time series data may contain seasonal patterns where data behaves differently depending on the time of the year, part of the day, etc.
A simple threshold-based rule might then generate false alerts during peak seasons, or fail to detect anomalies during off-peak seasons. - Also, there exists different types of anomalies, where some are hard to track
- the input data can introduce multivariate dependencies, thus, requiring appropriate models to train on to take such patterns into account.
Thus, a more sophisticated approach is needed, and that’s where anomaly detection comes into play.
Hereinafter, we will be talking about anomaly detection in greater details and in the context of
vmanomaly, which is an enterprise-grade solution of VictoriaMetrics that leverages modern anomaly detection algorithms to effectively identify anomalies in your time series data. It integrates seamlessly with other VictoriaMetrics ecosystem components, providing you with a complete end-to-end solution for your monitoring and observability needs.
Would you like to test how VictoriaMetrics Anomaly Detection can enhance your monitoring? Request a trial here or contact us if you have any questions.
Glossary
#
While it may initially appear inconsequential, a glossary serves as an invaluable resource for grasping domain-specific terminology, enhancing your professional vocabulary, and aligning your language with that of subject matter experts. In this section, we offer definitions for essential terms and concepts in the following areas:
- Time Series Data
- Anomaly Detection
- Machine Learning
- VictoriaMetrics Ecosystem Components that are used in anomaly detection tasks.
Time Series Specifics
#
Here is a group of concepts from the time series analysis so we know the building blocks of forecasting and anomaly detection
Time Series
#
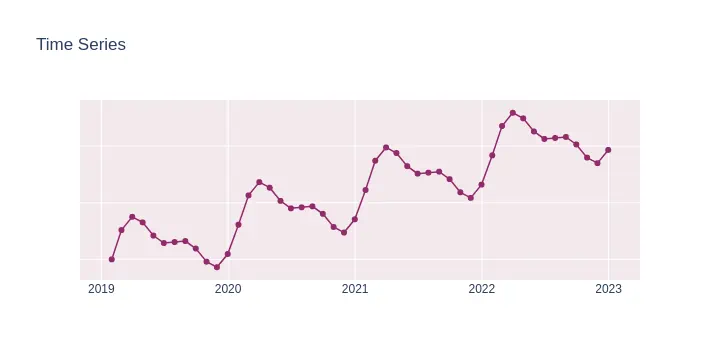
A time series is a sequence of numerical data points in successive order, usually equally spaced in time (i.e. daily, hourly).
In a time series, time is often the independent variable and the goal is usually to make a forecast for the future.
Time series can also have trend and seasonality components present in its data.
For example, for a time series Y:
Ystands for its nameYₜdenotes value of a seriesYat particular time pointt.tgenerally denotes time axis
Examples of time series data:
- RAM utilization
- Weather data
- Hourly Temperature readings
- Heart rate monitoring (EKG)
- Brain monitoring (EEG)
- Quarterly sales
- Daily stock prices
Trend
#
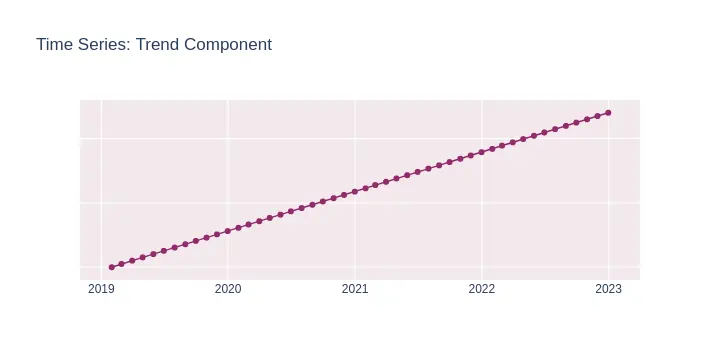
A trend in time series data is a long-term increase or decrease in the data. It does not have to be linear and can be a curve-like.
An example of a linear trend can be seen on a graph below
Seasonality
#
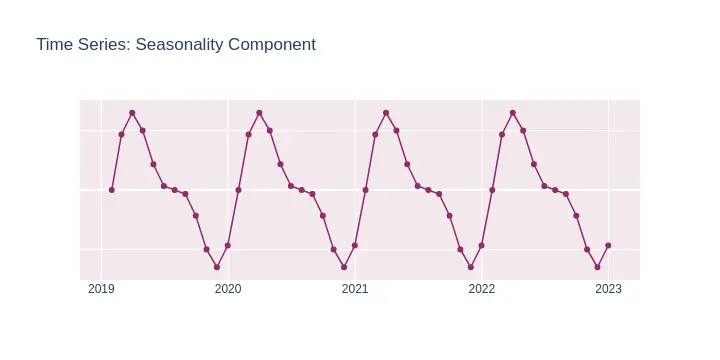
Seasonality refers to predictable and recurring patterns in time series data that occur periodically over a day, week, month, season, year, etc.
The key for time-series analysis is to understand how the seasonality affects the series, therefore allowing to produce better forecasts for the future.
Examples of seasonal time series:
- Factory machines (hourly)
- Road traffic (daily)
- Electricity consumption (monthly)
- Retail sales (yearly)
Intermittent Time Series
#
An intermittent time series is a time series with non-zero values occurring at irregular intervals interspersed with a sequence of zeros. Often there are also missing data or irregular values present in a series.
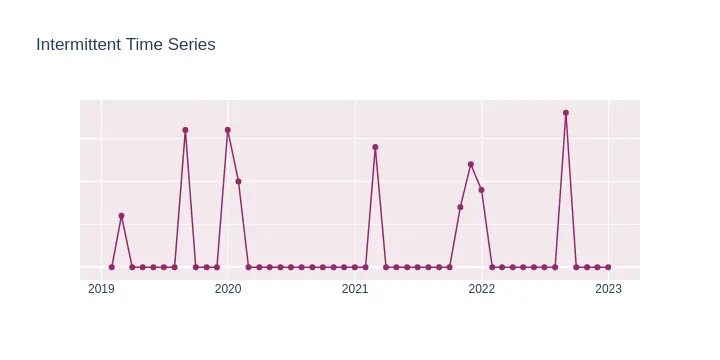
Examples of intermittent time series:
- Rainfall measurements
- Sales of SKUs with slow sales frequency or irregularly demanded patterns
Anomaly Specifics
#
Here is a group of concepts from anomaly detection world, so we know what problem we are solving
Anomaly
#
An anomaly is a data point or a pattern that deviates significantly from expected behavior of the rest of the data.
In time series data, an anomaly could be a sudden spike in traffic, a dip in sales, or any other significant change that is out of the ordinary.
There are, in general, two types of anomalies from the business perspective - outliers and novelties.
Also, there 3 most common types of anomalies from the context perspective:
- Point Anomalies: These occur when a data sample significantly differs from the distribution of the data, leading to flagging as a point or global anomaly.
- Collective Anomalies: In this case, individual data points may not appear anomalous, but a sequence of points is labeled as an anomaly
- Contextual Anomalies: Some data points may be considered normal in one context but identified as anomalies in another context.
Anomaly Score
#
The anomaly score is typically a measure of how much a data point deviates from the expected value or pattern, with higher scores indicating a higher likelihood of being an anomaly.
By setting a threshold on the anomaly score, the alerting system can trigger alerts for the most significant anomalies.
In VictoriaMetrics Anomaly Detection scores are usually distributed in [0, inf) interval having [0, 1) for non-anomalies and [1, inf) for anomalies with varying severity, thus, allowing simpler rules as reasonable defaults, such as trigger an alert if anomaly_score > 1"
Anomaly Threshold
#
The numerical value that defines the border, points with anomaly scores to the left will be considered “normal”, while points to the right will be considered “anomalous”.
Note: Pay attention that increasing the threshold will reduce the amount of false positives but increase the amount of false negatives found in data (and vice versa)
Outlier
#
An outlier is a type of anomaly that appears as a data point that deviates significantly from other similar observations.
Outliers could be caused by variability in the data or due to measurement errors.
Outlier Detection
#
Outlier detection is a set of (usually) unsupervised anomaly detection algorithms, where the training data contains anomalies which are defined as observations that “are far from the others” in some sense.
Outlier detection estimators thus try to fit the regions where the training data is the most concentrated, ignoring the deviant observations.
In this context an anomaly is also called an outlier.
Novelty
#
A novelty is an unobserved pattern in the data that occurs for the first time.
Unlike outliers, novelties represent changes in the underlying system that produces the data, suggesting a new, previously unobserved state of the system.
Novelty Detection
#
Novelty detection is a set of (usually) semi-supervised anomaly detection algorithms, where the training data is not polluted by outliers and we are interested in detecting whether a new observation is an outlier.
In this context an anomaly is also called a novelty.
Machine Learning Specifics
#
Here is a group of concepts from data science, machine learning and statistics, that help to know what’s under the hood of anomaly detection solution better.
Univariate Data
#
Univariate data consist of observations on only one attribute or variable.
For example, a weather forecast model uses past recorded temperature values to predict future temperatures
Multivariate Data
#
Multivariate data consist of observations on multiple variables or attributes.
A Multivariate time series has more than one univariate time series variable.
Each of them depends not only on its past values but also has some dependency on other variables.
This dependency is used for forecasting future values
For example, using perspiration percent, dew point, wind speed, cloud cover percentage, etc., and the past temperature values themselves
can be used to predict future temperature more precisely than just using past recorded temperature
Supervised Learning
#
Supervised learning, also known as supervised machine learning, is a subcategory of machine learning.
It is defined by its use of labeled datasets to train algorithms:
- To classify the data (i.e. classification task
outlier/non-outlierfrom[0, 1]domain) - To predict outcomes (i.e. regression task,
outlier scorefrom[0, inf))
Thus, to train and use such algorithms, labeled (supervised) dataset with features (X) and known ground truth (target, y, i.e. is_anomaly = {0, 1}) should be available
Unsupervised Learning
#
Unsupervised learning, also known as unsupervised machine learning, uses machine learning algorithms to analyze and cluster unlabeled datasets, perform dimensionality reduction and discover hidden patterns or data groupings without the need for human intervention:
- to find anomalous points in a dataset using hidden patterns in data and proximity-based criteria (i.e. find the data points that are “far away” from central group)
So, to train and use such algorithms, unlabeled (unsupervised) datasets with only features (X) are only needed.
Semi-Supervised Learning
#
Weak supervision, also called semi-supervised learning, is a branch of machine learning that combines a small amount of labeled data (or other implicit information about the data) with a large amount of unlabeled data during training.
Semi-supervised learning falls between unsupervised learning (with no labeled training data) and supervised learning (with only labeled training data) and aims to alleviate the issue of having limited amounts of labeled data available for training:
- Use “normal” group of data points with no anomalies within to train a model to classify new data points being “inline” (regular observation) or “outline” (novelty)
- Use small subset of labeled anomalies to found similar ones in a dataset for further refinement and subject matter expert estimate.
Self-Supervised Learning
#
Self-supervised learning is a machine learning process where the model trains itself to learn one part of the input from another part of the input. It is also known as predictive or pretext learning. In this process, the unsupervised problem is transformed into a supervised problem by auto-generating the labels.
Time Series Forecasting
#
In the simplest terms, time-series forecasting is a technique that utilizes historical and current data to predict future values over a period of time or a specific point in the future.
There exists different methods capable of predicting from univariate-input/univariate-output to multivariate-input/multivariate-output setups
Time series forecasting by itself can be used in anomaly detection tasks, when we train a model on past time series’ data, forecast the future and calculate anomaly score based on
Imbalanced Data
#
Imbalanced data refers to those types of datasets where the target class has an uneven distribution of data points, i.e one class label has a very high number of observations and the other has a very low number of observations. In the context of anomaly detection, the example is labeled dataset with thousands of data points of “normal” type (is_anomaly=0) while only few of the points were marked as an “anomaly” (is_anomaly=1)
False Positive
#
A false positive (referred also as false positive error or first type error) is an error in binary classification supervised problem, in which a test result incorrectly indicates the presence of a condition when it is actually absent (such as predicting an anomaly when the actual data point is normal)
False Negative
#
A false negative (referred also as false negative error or second type error) is an error in binary classification supervised problem, which is the opposite to false positive - in which the test result incorrectly indicates the absence of a condition when it is actually present (such as classifying a point as “normal” while it is anomalous in ground truth data)
Precision
#
Precision (also called positive predictive value) is the fraction of relevant instances among the retrieved instances:
- this metric varies from 0 to 1 (perfect classification of data points)
- In the context of anomaly detection it can be calculated as a fraction of
points predicted as anomaliestothe number of real anomalies in ground truth retrieved data
Example:
- There are 100 data points, 10 of them are real anomalies.
- The model predicts 10 anomalies.
- 7 out of these 10 predictions are correct (intersects with ground truth labels) and 3 are incorrect (false positives)
- Precision is then number of correctly predicted anomalies / number of predicted anomalies = 7/10 = 0.7
Recall
#
Recall (also known as sensitivity) is the fraction of relevant instances that were retrieved:
- This metric varies from 0 to 1 (perfect retrieval)
- In the context of anomaly detection it can be calculated as a fraction of
points predicted as anomaliestothe number of all real anomalies in all ground truth data
Example:
- There are 100 data points, 10 of them are real anomalies.
- The model predicts 12 anomalies.
- 8 out of these 12 predictions are correct (intersects with ground truth labels)
- Recall is then = number of found anomalies / number of all anomalies = 8/10 = 0.8
VictoriaMetrics Product Ecosystem
#
Here is a list of terms that corresponds to VM components, often used together to solve end-to-end observability tasks:
- Anomaly detection itself
- Alerting
- Metric collection
- Inter-service communication, etc.
Please find tech-savvy use case of those services working together as AD & alerting system here
VictoriaMetrics (VM)
#
VictoriaMetrics is a fast, cost-effective and scalable monitoring solution and time series database.
It can handle millions of metrics with high query speed, optimal resource usage and provides long-term retention of your data.
You can configure finding anomalies on data stored in VM, calculate anomaly scores and push it back as new metrics to VM database, staying within the same convenient ecosystem for time series monitoring
VictoriaMetrics Anomaly Detection
#
vmanomaly is an enterprise-level solution crafted by VictoriaMetrics specifically for anomaly detection in time-series data. Utilizing state-of-the-art algorithms, it efficiently pinpoints anomalies with minimal configuration, yet offers the flexibility for customization. Additionally, customers have the option to integrate their own detection algorithms through a straightforward API.
Note: vmanomaly is a part of our enterprise offering. Request a trial here.
VMAgent
#
vmagent is a tiny agent which helps you collect metrics from various sources, relabel and filter the collected metrics and store them in VictoriaMetrics or any other storage systems via Prometheus remote_write protocol.
VMAlert
#
VMAlert is a service that evaluates a predefined set of alerting or recording rules against a specified data source. As a critical element in a comprehensive anomaly detection system, VMAlert goes beyond merely identifying and pinpointing anomalies. It generates actionable insights by delivering notifications and recommendations to the system’s end users, enabling them to understand the issue at hand and take appropriate corrective actions.
ML-Based Alerting
#
Machine Learning (ML)-based alerting is a more sophisticated system that leverages machine learning techniques to trigger alerts.
In the context of anomaly detection, ML-based alerting often works by using generated anomaly score produced by downstream anomaly detector for each data point.
If the score exceeds a certain threshold (i.e. anomaly_score > 1), an alert is triggered.
Here’s an example:
Suppose we have a machine learning model that is trained to detect anomalies in the number of daily users of a web application. The model calculates an anomaly score for each day’s user count, based on how much it deviates from the expected number of users. If the anomaly score for a particular day exceeds 1, an alert is triggered. This could indicate a sudden surge in popularity, a successful marketing campaign, or a data error.
Rule-Based Alerting
#
Rule-based alerting is a system that triggers alerts when certain pre-defined conditions are met.
While it may not be ideal for detecting complex anomalies in time series data due to its simplistic nature, rule-based alerting is effective in scenarios where the conditions for abnormal behavior are well-defined and do not change frequently.
Here’s an example:
Consider a server that is hosting a web application. The operations team might set up a rule-based alerting system to monitor the server’s CPU utilization. They could define a rule that triggers an alert if the CPU utilization exceeds 90% for more than five minutes.
In this case, the rule is simple and straightforward: if CPU utilization exceeds a specific threshold for a certain duration, an alert should be triggered.
The ops team can then investigate the cause of the high CPU utilization and take appropriate action to prevent the server from crashing
Leave a comment below or Contact Us if you have any questions!
comments powered by Disqus