- Blog /
- How VictoriaLogs Stores Your Logs in a Columnar Layout
How VictoriaLogs Stores Your Logs in a Columnar Layout
Share:


If you run VictoriaLogs, your day-to-day comes down to three things: sending logs, querying them, and setting retention so the disk does not fill up. Everything else happens quietly on disk.
This post follows a single log line from the moment it arrives to where it finally rests on disk, so you can picture what VictoriaLogs is doing under the hood and explain what you’re seeing: why your queries come back fast, why you sometimes see many files on disk, and which flags and metrics matter when something looks off. This article is for everyone, no programming background needed and no Go code to read. If you do want to go deeper, the VictoriaLogs source is always the reference.
1. A log line arrives
#
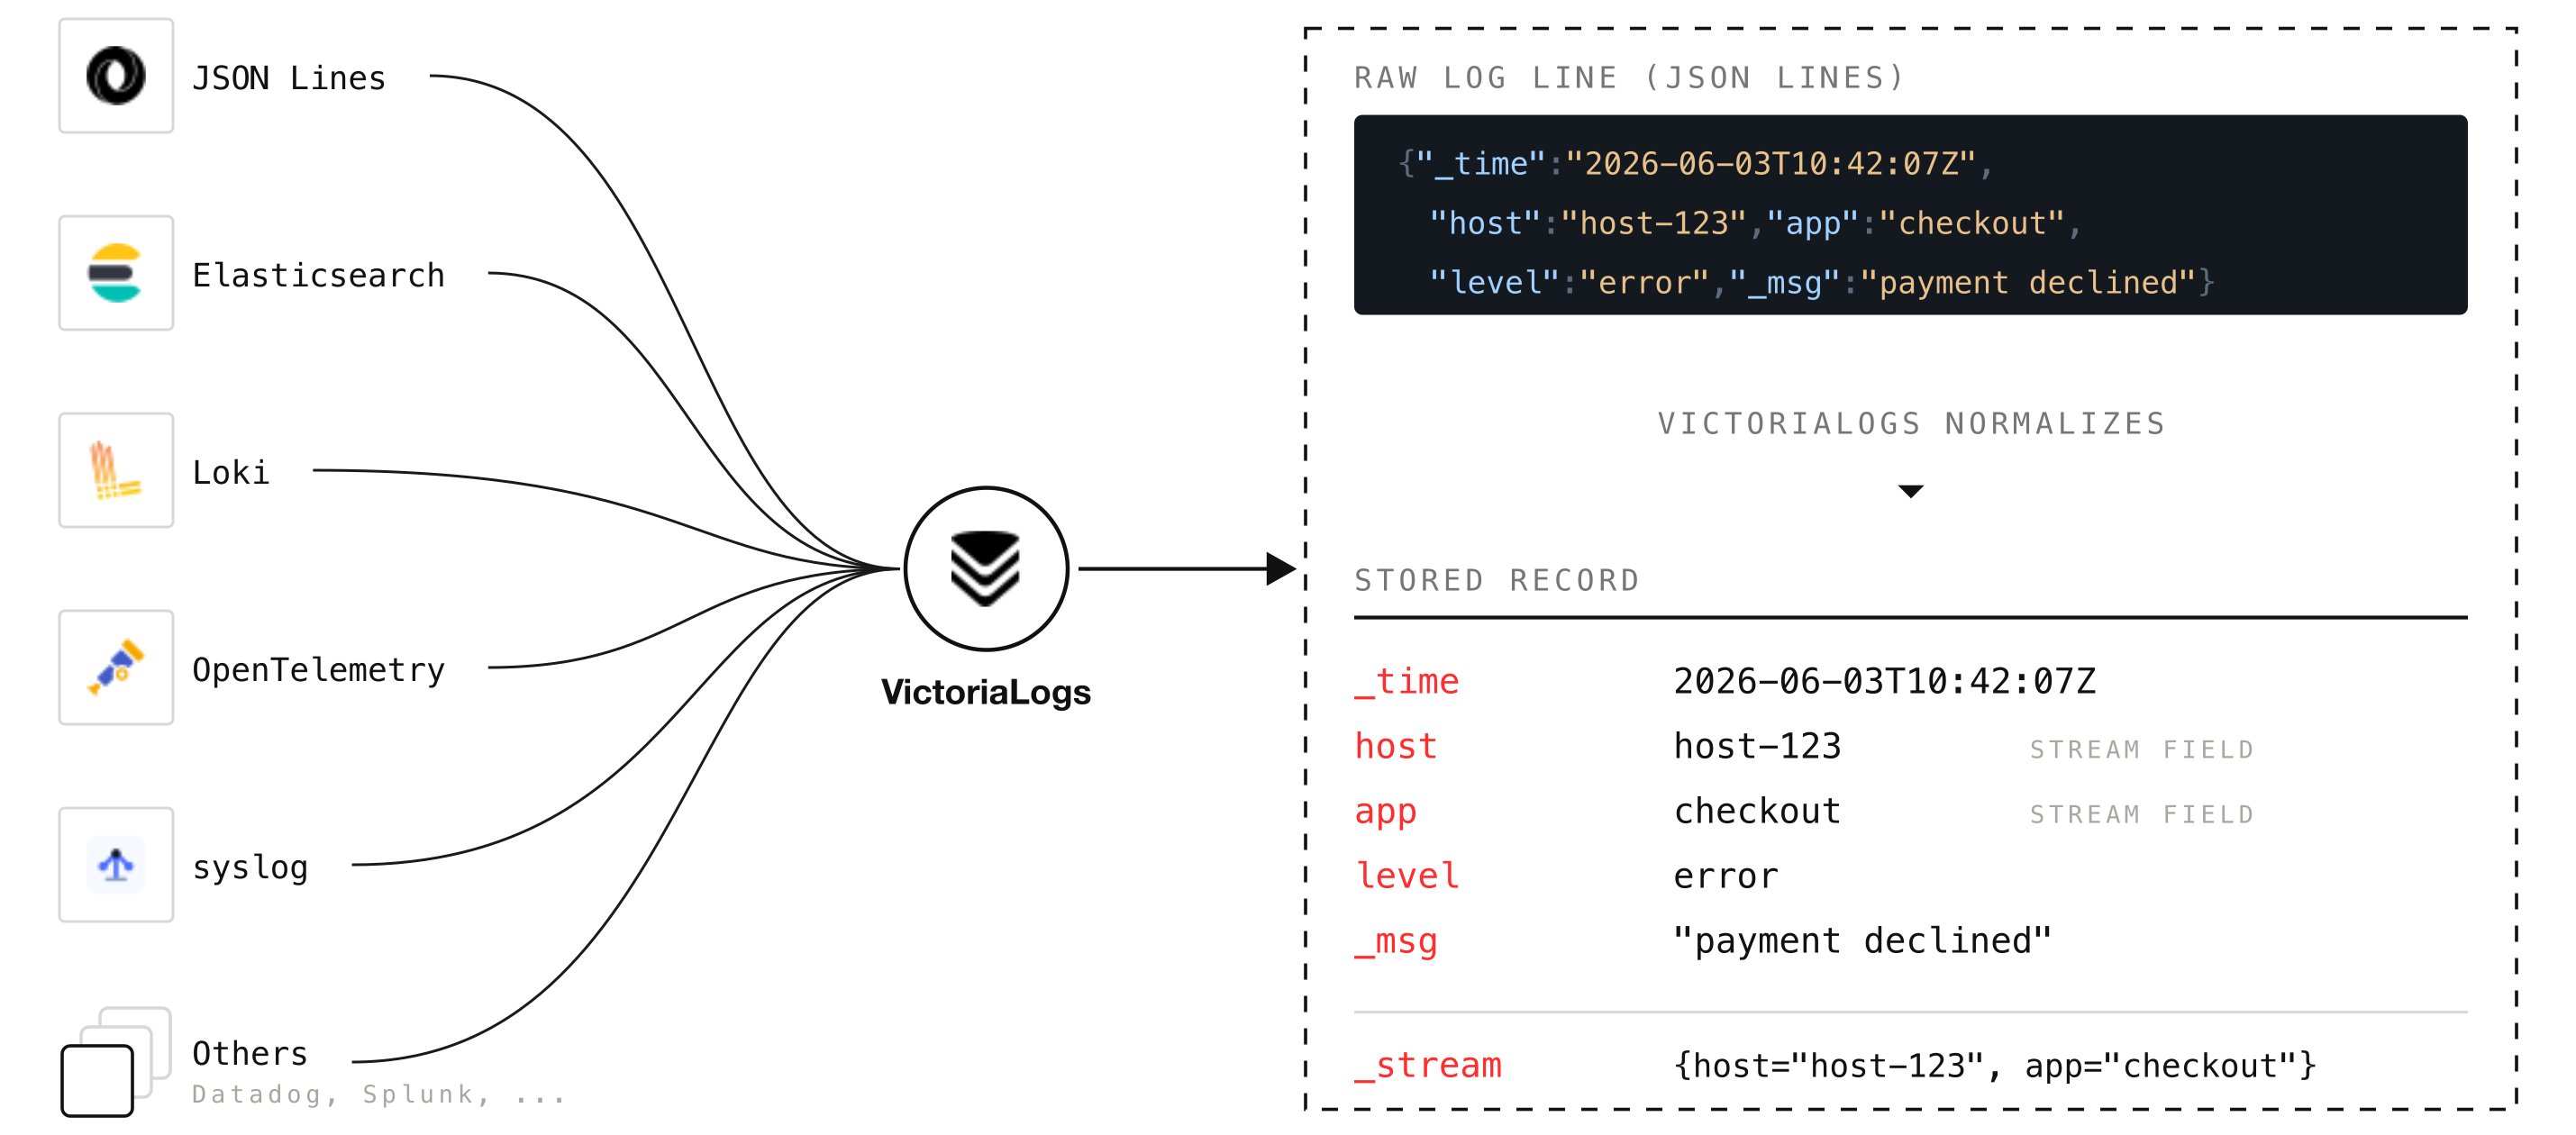
VictoriaLogs accepts logs over many protocols: JSON Lines, Elasticsearch bulk, Loki push, OpenTelemetry, syslog, and more (see the data ingestion docs for the full list).
Whichever one you use, the first thing VictoriaLogs does is translate that record into a single internal shape that the rest of the system understands: a timestamp, a set of named fields, and a “stream identity”.
Each protocol has its own small processor that does this translation, and you can influence it either with query arguments or with headers in the request itself:
- Drop fields you do not want to store with the
ignore_fieldsquery argument or theVL-Ignore-Fieldsheader. - Strip terminal color codes from values with the
decolorize_fieldsquery argument or theVL-Decolorize-Fieldsheader. - Attach extra fields to every record with the
extra_fieldsquery argument or theVL-Extra-Fieldsheader. - Point VictoriaLogs at the main message field (
_msg) with the_msg_fieldquery argument or theVL-Msg-Fieldheader. - Tell it which field holds the timestamp with the
_time_fieldquery argument or theVL-Time-Fieldheader. - Choose which fields define the stream identity with the
_stream_fieldsquery argument or theVL-Stream-Fieldsheader.
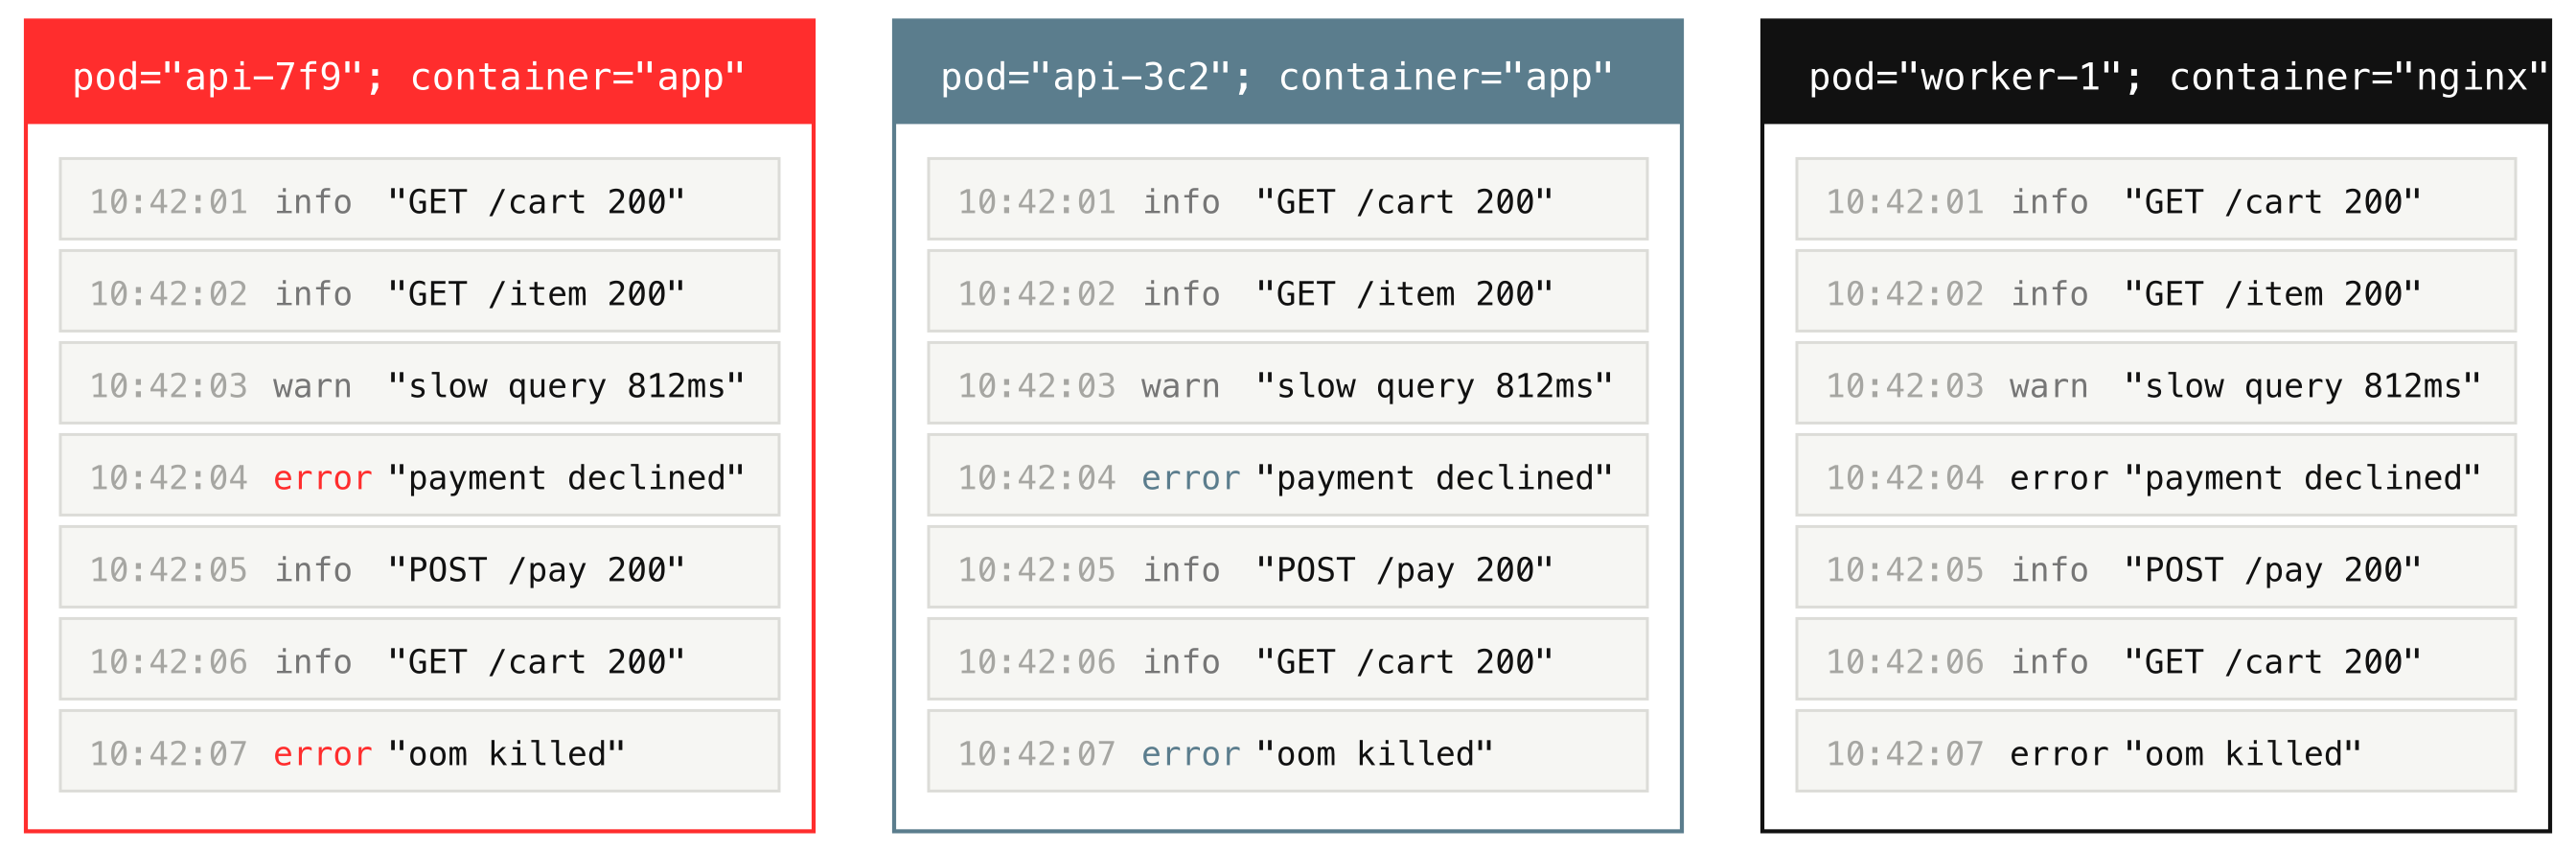
Stream identity is the most important idea in this whole post. Logs that share the same stream fields are treated as a single stream, and you are the one who decides what that stream looks like. For example, set _stream_fields=pod,container, and all logs with the same pod and container form one stream.
VictoriaLogs keeps each stream’s logs together on disk, and that grouping is what makes them compress so well and lets a query touch only the streams it needs instead of scanning everything.
The practical rule for you as an operator: keep stream fields stable and low-cardinality, meaning they should have only a handful of distinct values, such as host, app, pod, or container, and keep high-cardinality values, ones with very many unique entries like trace_id or user_id, as normal fields, not stream fields.
Now, after receiving and normalizing the incoming records, VictoriaLogs does not handle them one at a time either. It accumulates them in an in-memory buffer and, about once a second (or sooner if the buffer fills up), turns the whole batch into a small searchable chunk that still lives in RAM (an in-memory part).
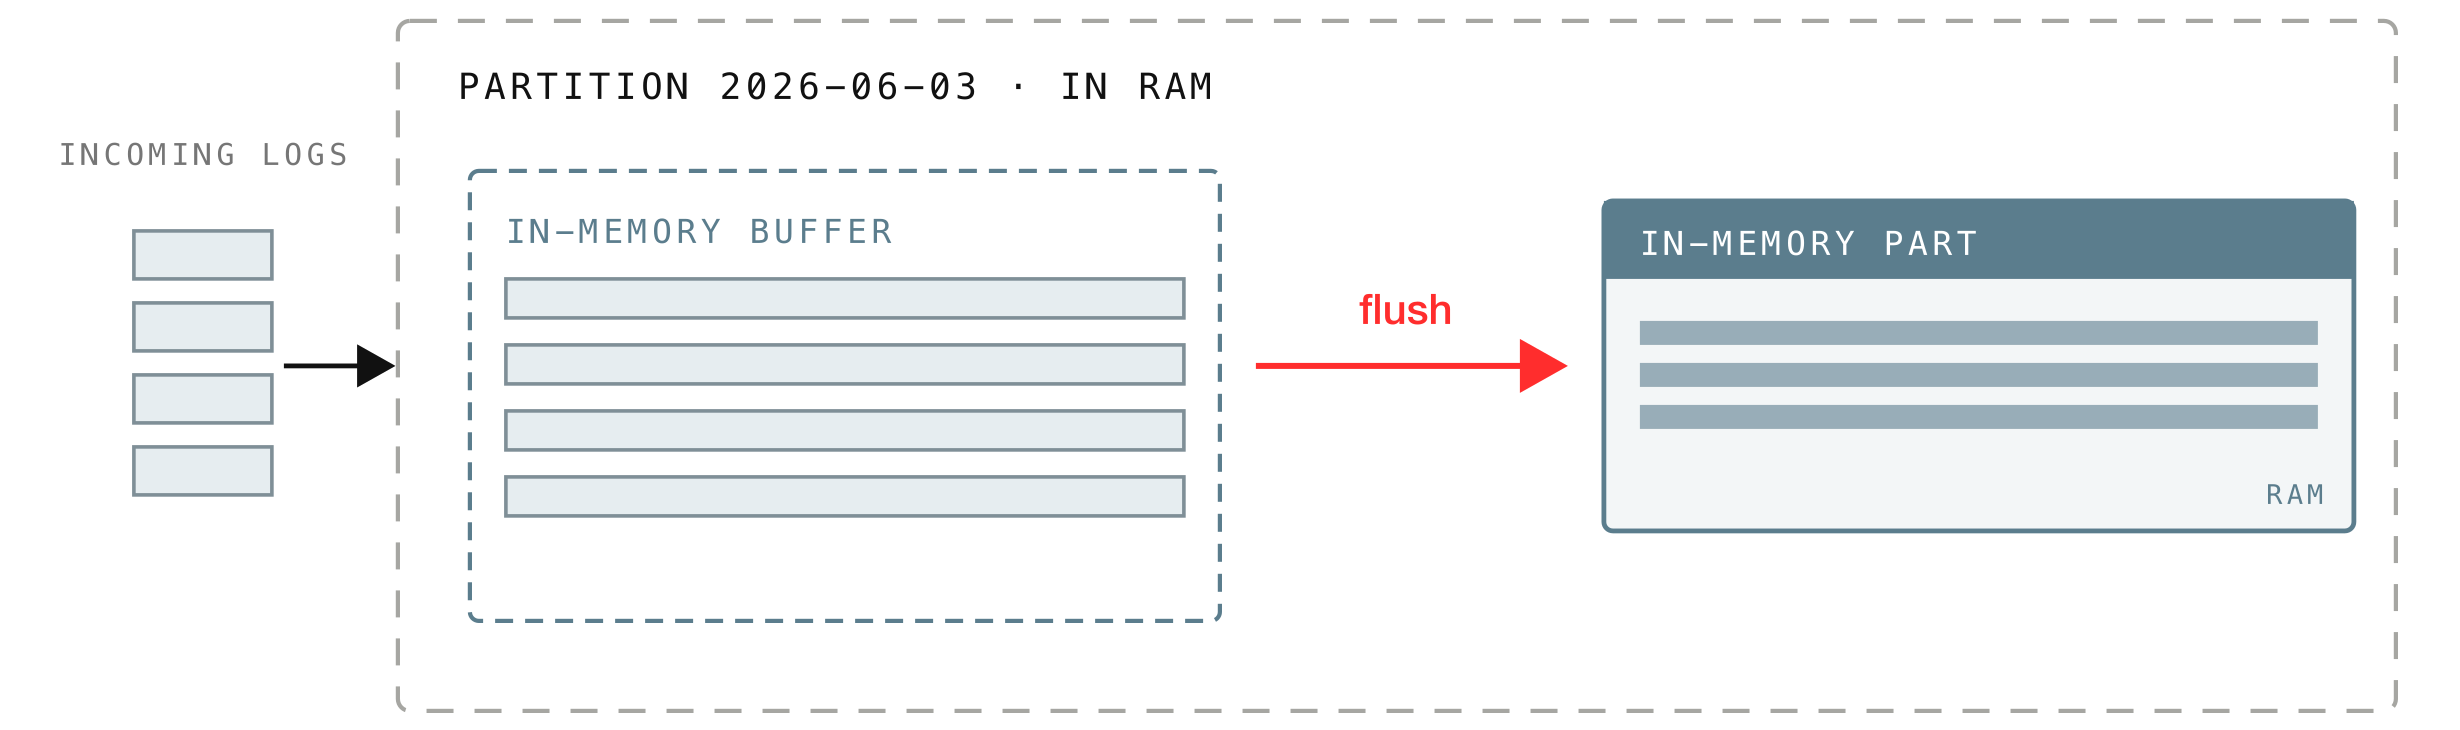
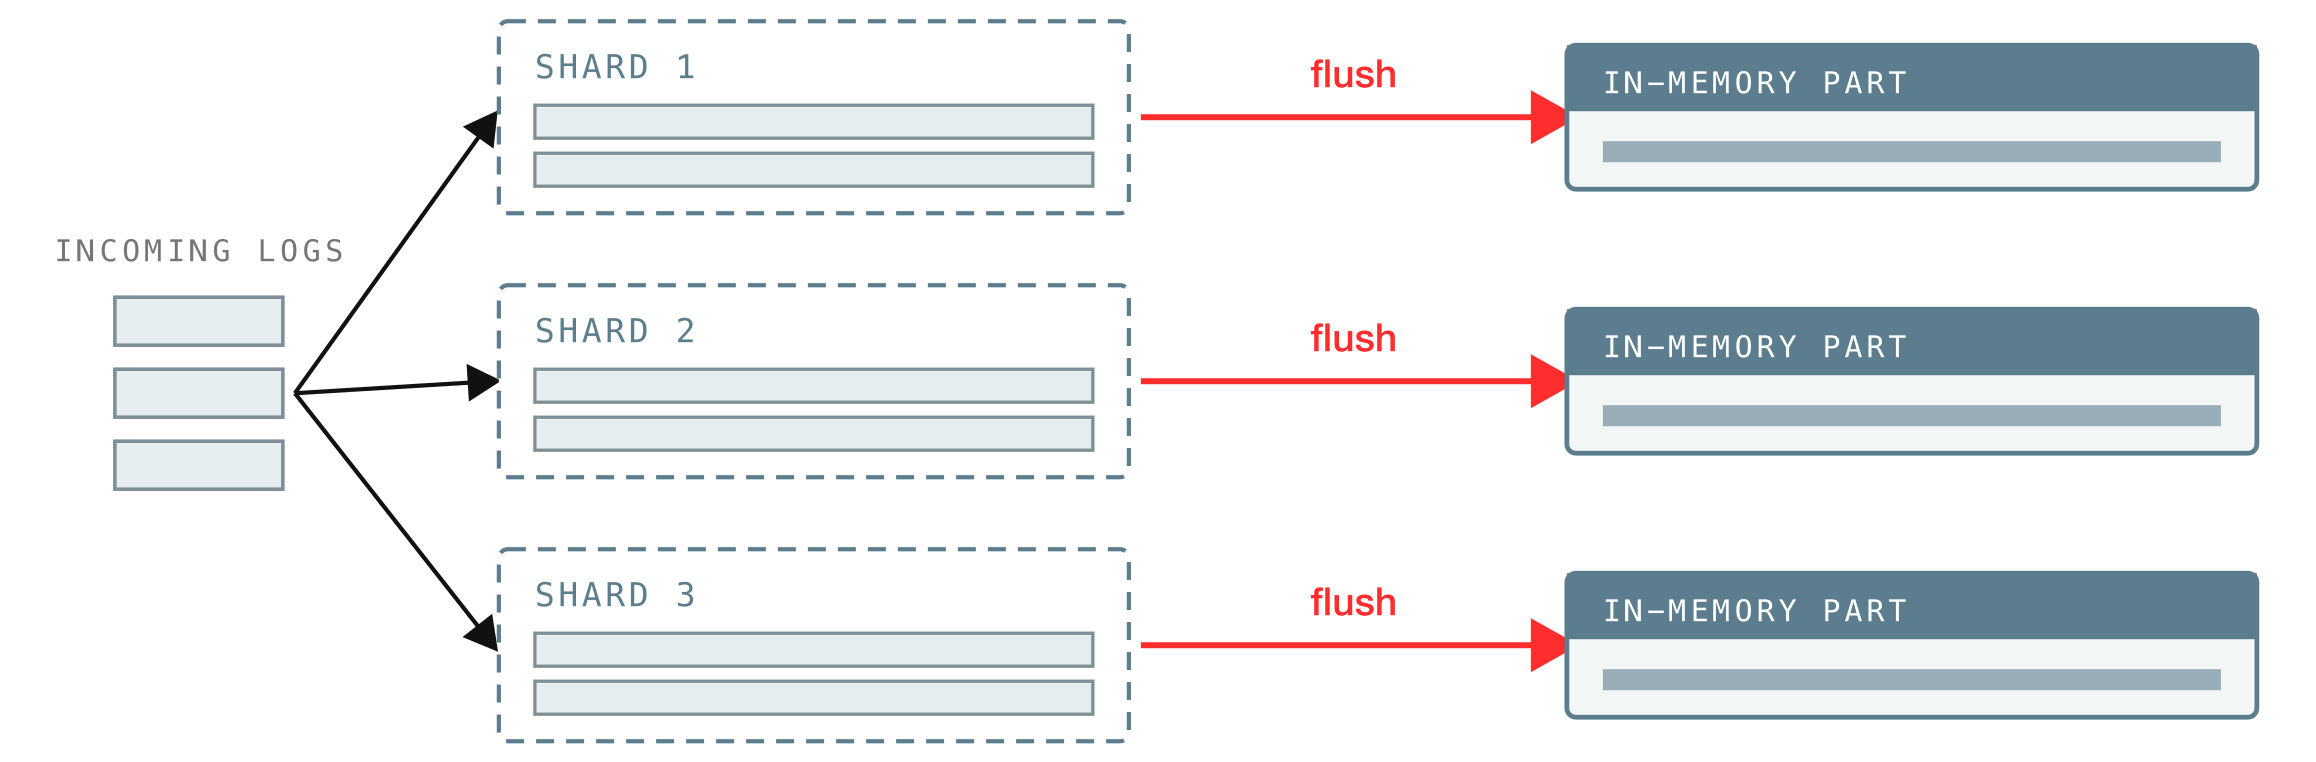
That in-memory buffer is not a single shared queue. If every incoming batch had to line up for the same buffer, they would waste time waiting on each other, so VictoriaLogs splits the buffer into shards, one per CPU core, and spreads incoming batches across them in turn.
So on a 3-CPU machine there are 3 buffer shards filling in parallel, and each shard flushes on its own, writing its batch out as a new in-memory part about once a second:
A part is one of the core data structures across VictoriaLogs (and the other VictoriaMetrics products): a self-contained bundle of data that is searchable, which is to say queryable.
Most of the time, the buffered batch is flushed into an in-memory part, but in some rare cases, if a batch is large enough to exceed the in-memory size limit, the part is written straight to disk as a small or big part instead.
Metric vl_insert_flush_duration_seconds: how long it takes to turn a buffered batch into an in-memory part.
2. Daily partitions
#
When a batch is flushed, VictoriaLogs files each log into a partition, and a partition holds exactly one calendar day of logs (in UTC). It reads each log’s timestamp, works out which day it belongs to, and routes it there.
In other words, your logs are separated by date. You can see this directly on disk, one directory per day:
$ tree victoria-logs-data/

victoria-logs-data/
└── partitions/
    ├── 20260109
    ├── 20260110
    ├── 20260111
    └── 20260112
This per-day layout is not just an implementation detail; it is why two everyday operations are cheap:
- Retention is achieved by deleting whole day directories. When logs age out past
-retentionPeriod(7 days by default), or when disk-based retention kicks in, VictoriaLogs drops entire day folders rather than hunting down individual log lines. - Queries are almost always time-bounded (
_time:1h,_time:5m), so VictoriaLogs only has to open the day partitions that overlap your time range and can ignore the rest.
A partition is not purely a folder on disk. It has two faces: an on-disk side that holds the parts already written out, and an in-memory side that holds the buffer shards and the in-memory parts we just saw.
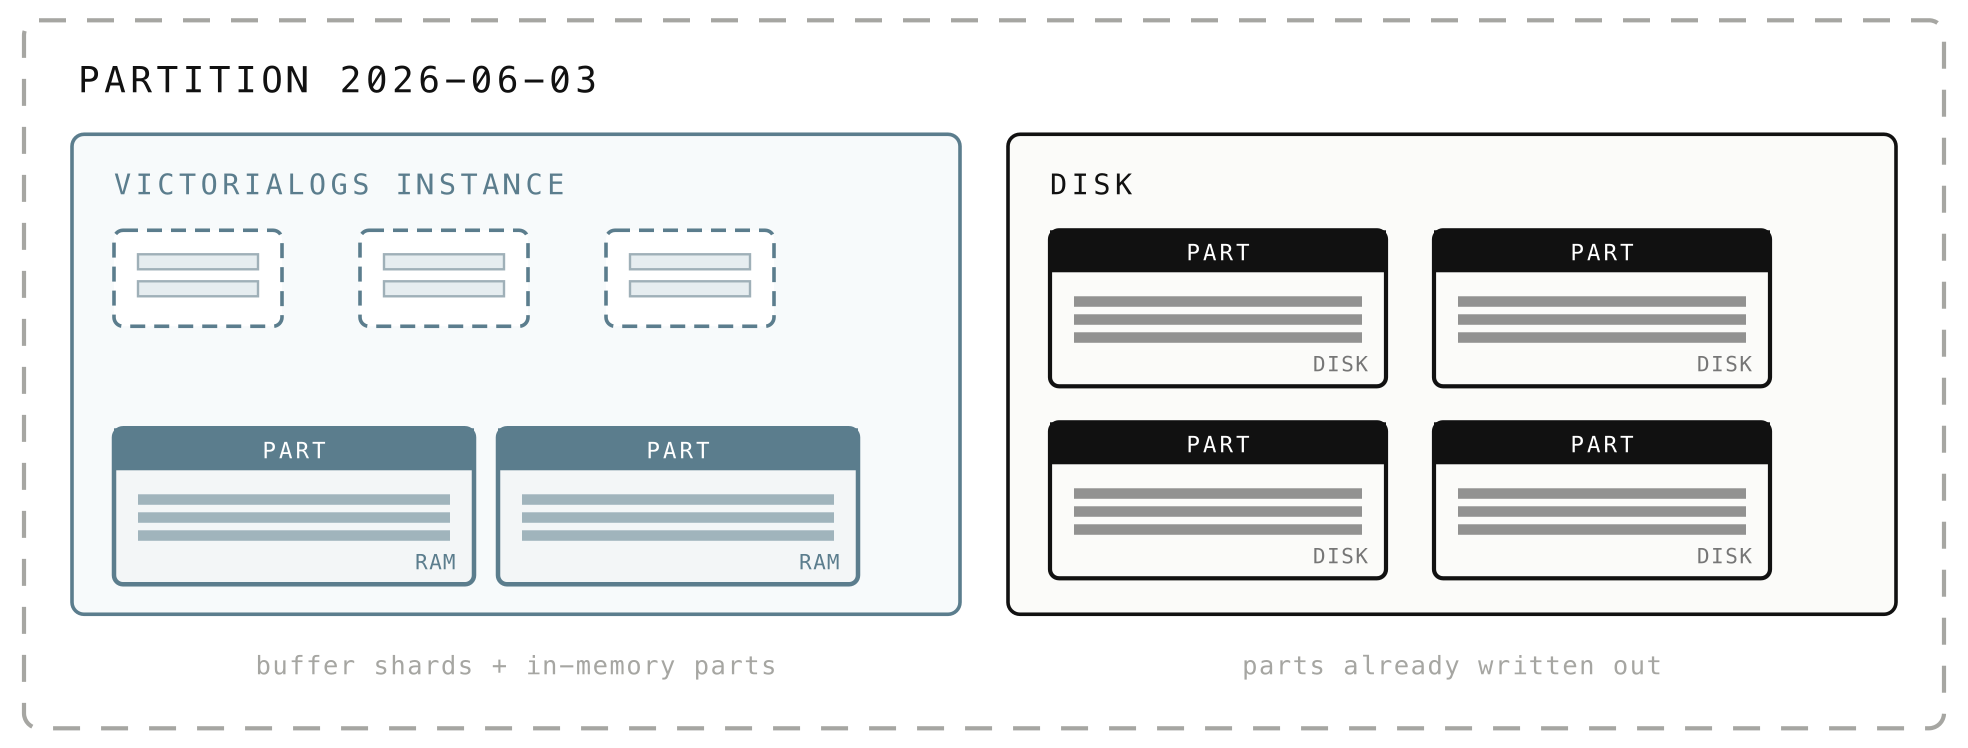
When you query a day, the partition serves results from both sides simultaneously, pulling the relevant parts from disk only when needed.
Metrics vl_storage_parts counts how many parts exist, broken down by where they live: {type="storage/inmemory"} for parts still in memory, {type="storage/small"} and {type="storage/big"} for parts on disk. And vl_pending_rows{type="storage"} counts the rows still sitting in the buffer, not yet turned into a part.
3. Parts: the unit VictoriaLogs actually stores
#
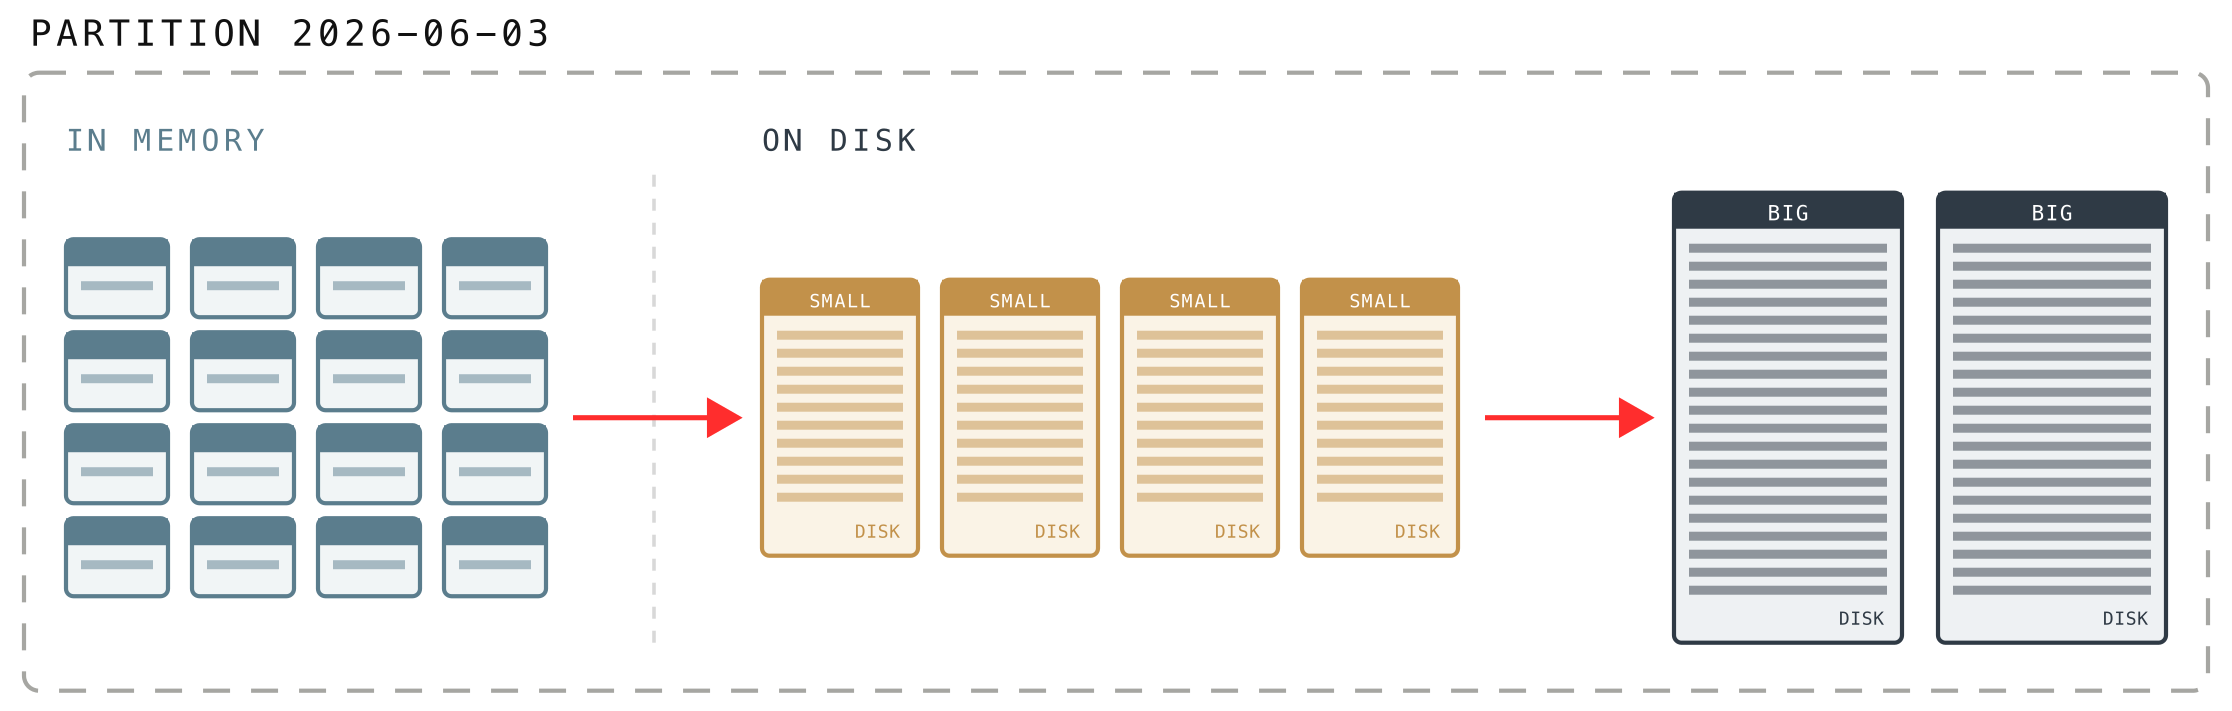
We met parts back in section 1: a part is the self-contained, searchable bundle of logs that a buffer turns into when it flushes. What we did not say is that parts come in three flavors, which are really the same data at different stages of its life:
- In-memory parts are created first, so freshly ingested logs are queryable almost immediately without waiting for disk.
- Small parts are in-memory parts written out to disk for durability.
- Big parts are what you get after small parts are combined together over time.
Logs in the in-memory buffer first flush into in-memory parts before they ever touch the disk, and that is what keeps ingestion cheap.
Parts reach the disk only in big, infrequent chunks, and small parts are merged into bigger ones while still in memory, so VictoriaLogs makes far fewer disk writes and reads. That is how it can absorb around a GiB of logs per second even on slow, low-IOPS HDDs.
There is a trade-off hiding in that first flavor. An in-memory part lives in RAM, so logs become queryable within seconds, but they are not yet safe on disk. VictoriaLogs closes that gap by guaranteeing a flush to disk on a short interval. The flag that controls this is -inmemoryDataFlushInterval (default 5s): how often in-memory data is guaranteed to reach the disk.
On disk, every part is a directory with a 16-character hexadecimal name (just an id), sitting inside the partition’s datadb folder. A separate indexdb folder holds the stream catalog for that day:
$ tree victoria-logs-data/partitions/20260109/

victoria-logs-data/
└── partitions/
    └── 20260109/
        ├── indexdb/
        └── datadb/
            ├── 1882C35B4CE64498/
            ├── 1882C35B4CE664F8/
            ├── 1882C35B4CE66BDB/
            └── parts.json
The parts.json file is simply the list of parts that are currently active, so VictoriaLogs knows which directories to read on startup:
$ cat victoria-logs-data/partitions/20260109/datadb/parts.json

["1882C35B4CE64498", "1882C35B4CE664F8", "1882C35B4CE66BDB"]
A part is immutable: once written, its files never change. That is what makes snapshots and backups safe and cheap.
So what is the difference between small parts and big parts?
It comes down to the operating system’s page cache. In plain terms, that is the slice of RAM the OS uses to hold recently read file data, so reading the same bytes again comes from memory rather than the disk. The more RAM the machine has, the larger this cache is, and the more of your logs are served straight from memory.
Small parts are written through that cache and kept deliberately small, so they usually stay in RAM and read back quickly. Their size scales with the RAM VictoriaLogs leaves free for the OS to cache (at least 10 MB); anything larger is written as a big part instead. Big parts can grow up to about 1 TB, and they bypass the page cache on write, so a large merge does not evict the hot data that recent queries rely on.
Beside the datadb folder we saw in the snippet above sits an indexdb folder. While datadb holds the parts (the actual logs), indexdb is the per-day catalog of streams: which streams exist and what fields they carry. When you query, VictoriaLogs checks this catalog first to figure out which streams could possibly match, so it never even looks at logs in unrelated streams. It deserves its own post, so we will leave it there.
4. The mental model of VictoriaLogs’ data structure
#
Before we open the actual files, it helps to have a mental model of how a part is laid out. The guiding idea is simple: VictoriaLogs arranges data so that reading it back later touches as little of it as possible. Two ideas do most of the work.
4.1 Logs are grouped into blocks, by stream and by time
#
Inside a part, logs are packed into blocks. A block holds rows from a single stream, and a part contains many blocks. The blocks are arranged by stream and then by time, with the rows inside each block sorted by timestamp.
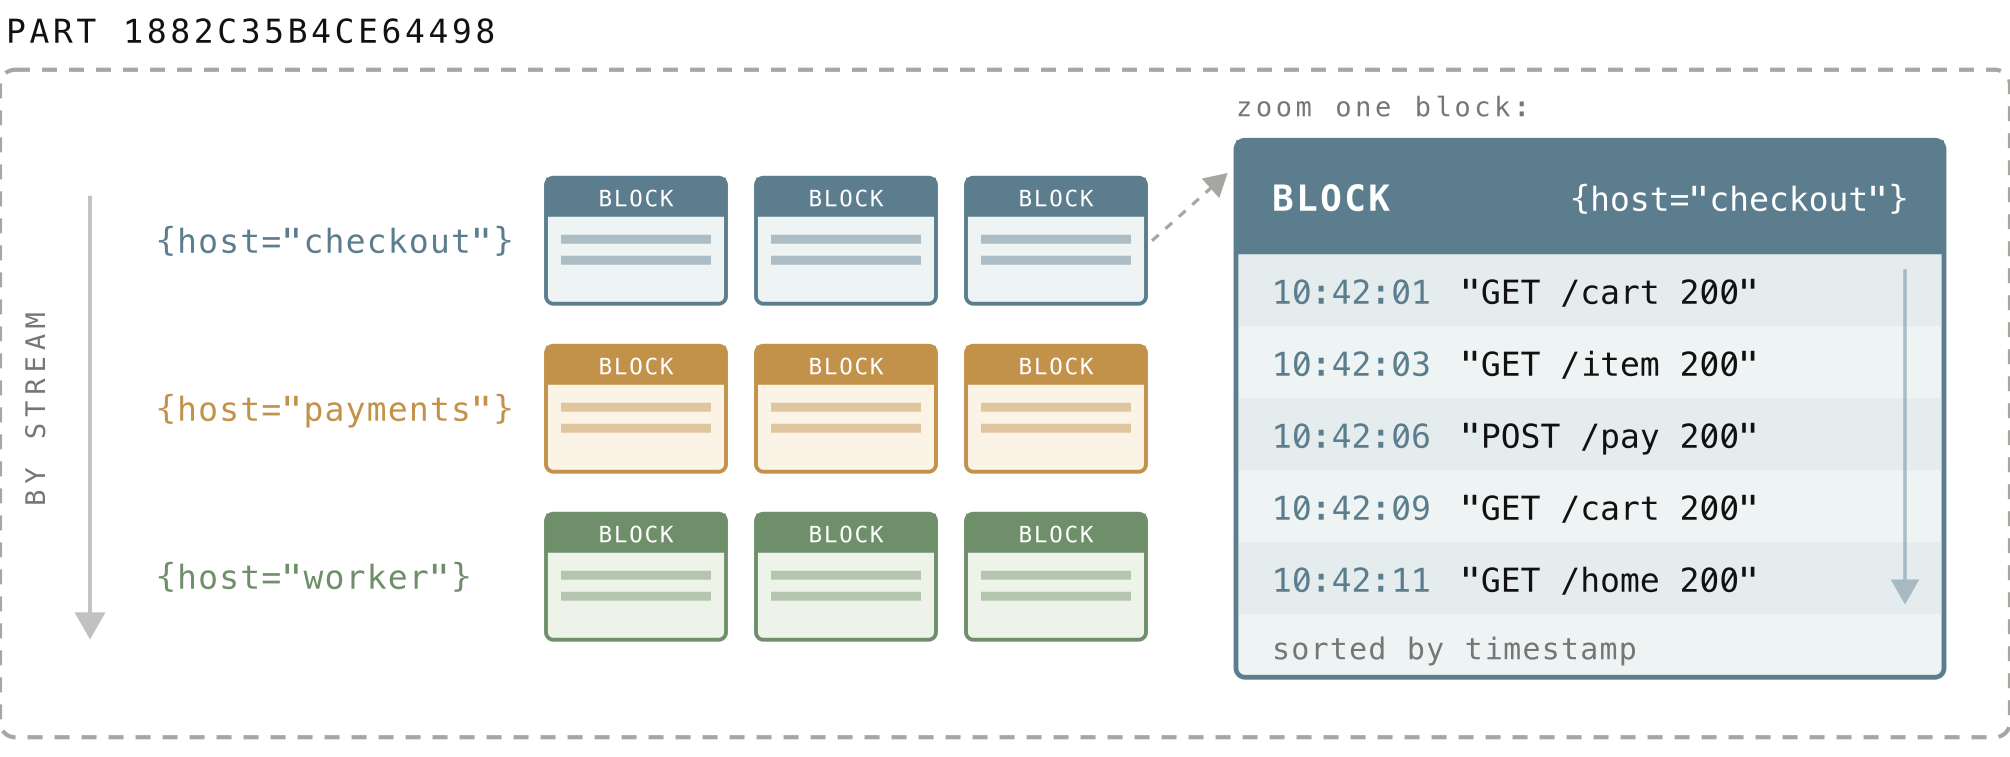
A block is capped at roughly 2 MiB of uncompressed data (it can stretch to almost 4 MiB when parts are combined). Every block carries a small piece of metadata called a block header, kept separate from the logs themselves (in index.bin, which we open up in section 5.8). It records:
- which stream the block belongs to,
- how many rows it holds,
- and the minimum and maximum timestamps in the block.
Since these headers are tiny and stored apart from the actual log data, VictoriaLogs can scan them to decide which blocks are worth reading, without touching a single log line in the blocks it skips.
This is what makes a filtered query cheap. When you ask for one stream over the last hour, VictoriaLogs jumps straight to that stream’s blocks and, using each block header’s min and max timestamp, skips any block whose time range cannot overlap your window. It never reads the unrelated streams or out-of-range blocks at all.
4.2 Each field is a column, so queries read only what they ask for
#
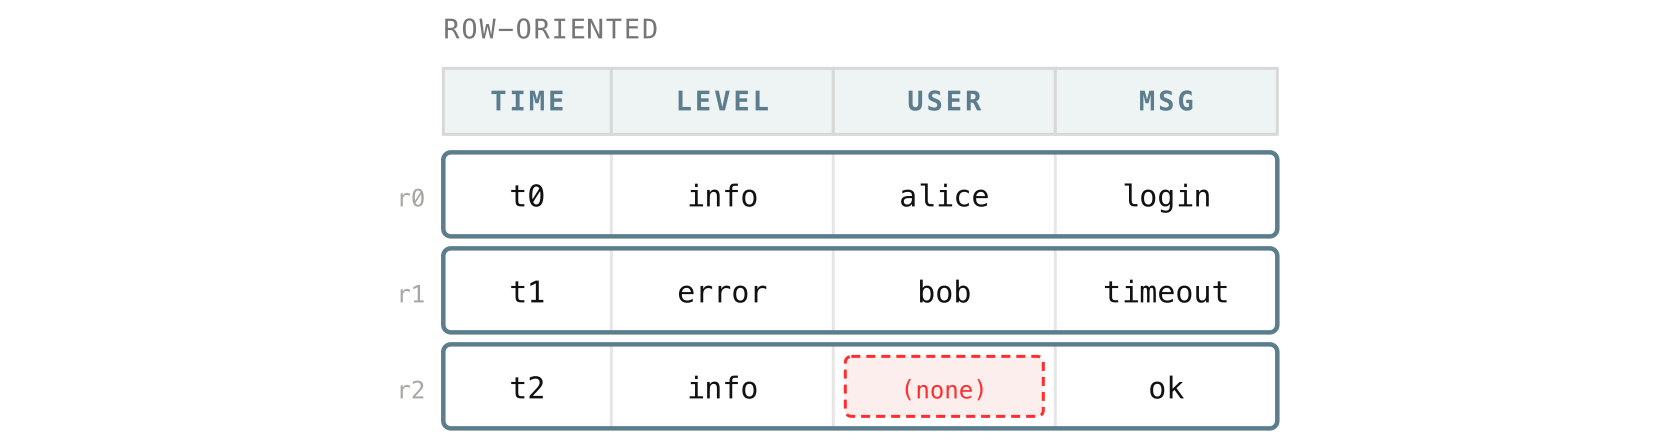
The natural way to picture a few logs is one record per row: each log line is a row, with all of its fields sitting side by side:
Within a block, VictoriaLogs flips this around. Instead of keeping each log together as a row, it stores each field as its own column, with the values still lined up by row:
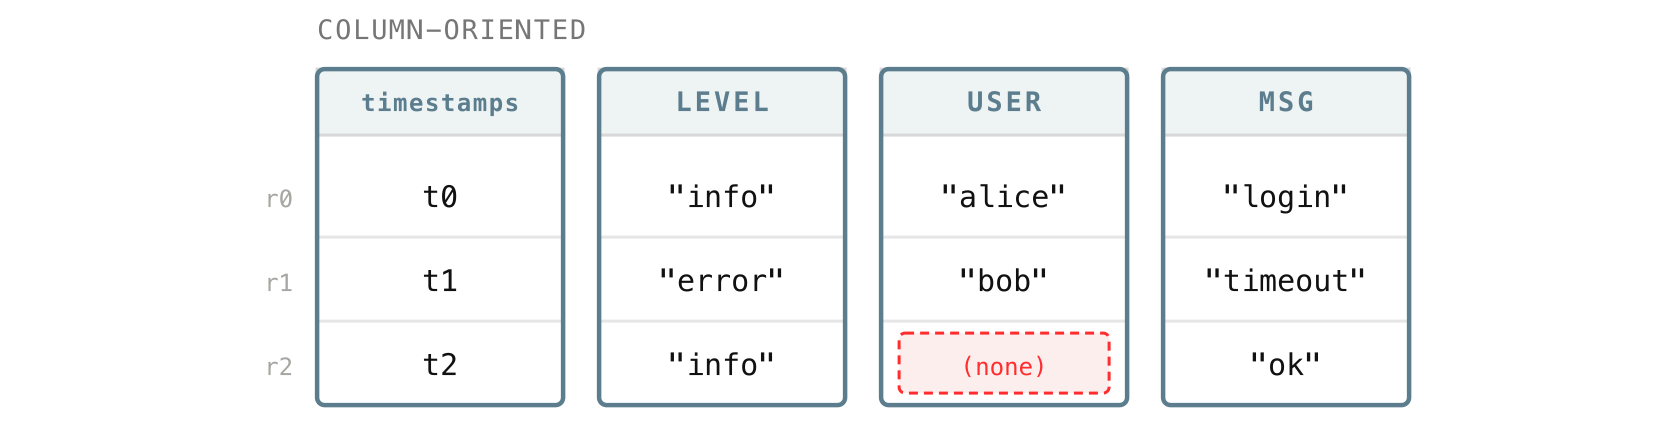
Keeping a field in its own column means VictoriaLogs only has to touch the columns a request actually uses, instead of reading every field of every row. The more fields your logs carry, the more that matters, and it is a big part of why VictoriaLogs handles wide logs with many fields and many distinct values comfortably.
This is also what makes the fields pipe in LogsQL such a cheap way to speed up a query. By default, a query returns every field, which means reading every column. Adding | fields ... (or its alias | keep ...) tells VictoriaLogs to read only the columns you name and skip the rest:
_time:5m error | fields _time, host, _msg
Here VictoriaLogs reads just the _time, host, and _msg columns, instead of pulling every field of every matching row off disk. On wide logs with dozens of fields, narrowing the output to the few you actually need can dramatically cut the amount of data a query reads.
Putting one field’s values together has another payoff: compression. Values of the same field tend to be the same kind of thing:
- A
levelis always one of a few words likeinfoorerror, - a
statusis always a number, - and a
timestampis always a time.
When every value in a column has the same shape or type, it compresses extremely well, and VictoriaLogs leans into this by picking a storage format that fits each column, such as a number, timestamp, IP address, and so on.
On top of that, logs in the same stream look very similar to one another, so neighboring values in a column repeat a lot and squeeze down even further. This is one of the reasons VictoriaLogs can compress your data from several TiB of raw logs down to only a few hundred GiB on disk, or even less.
5. The files inside a part
#
That is the mental model. Now let’s open a part and go through the actual files to see what each one is for and how it serves that model.
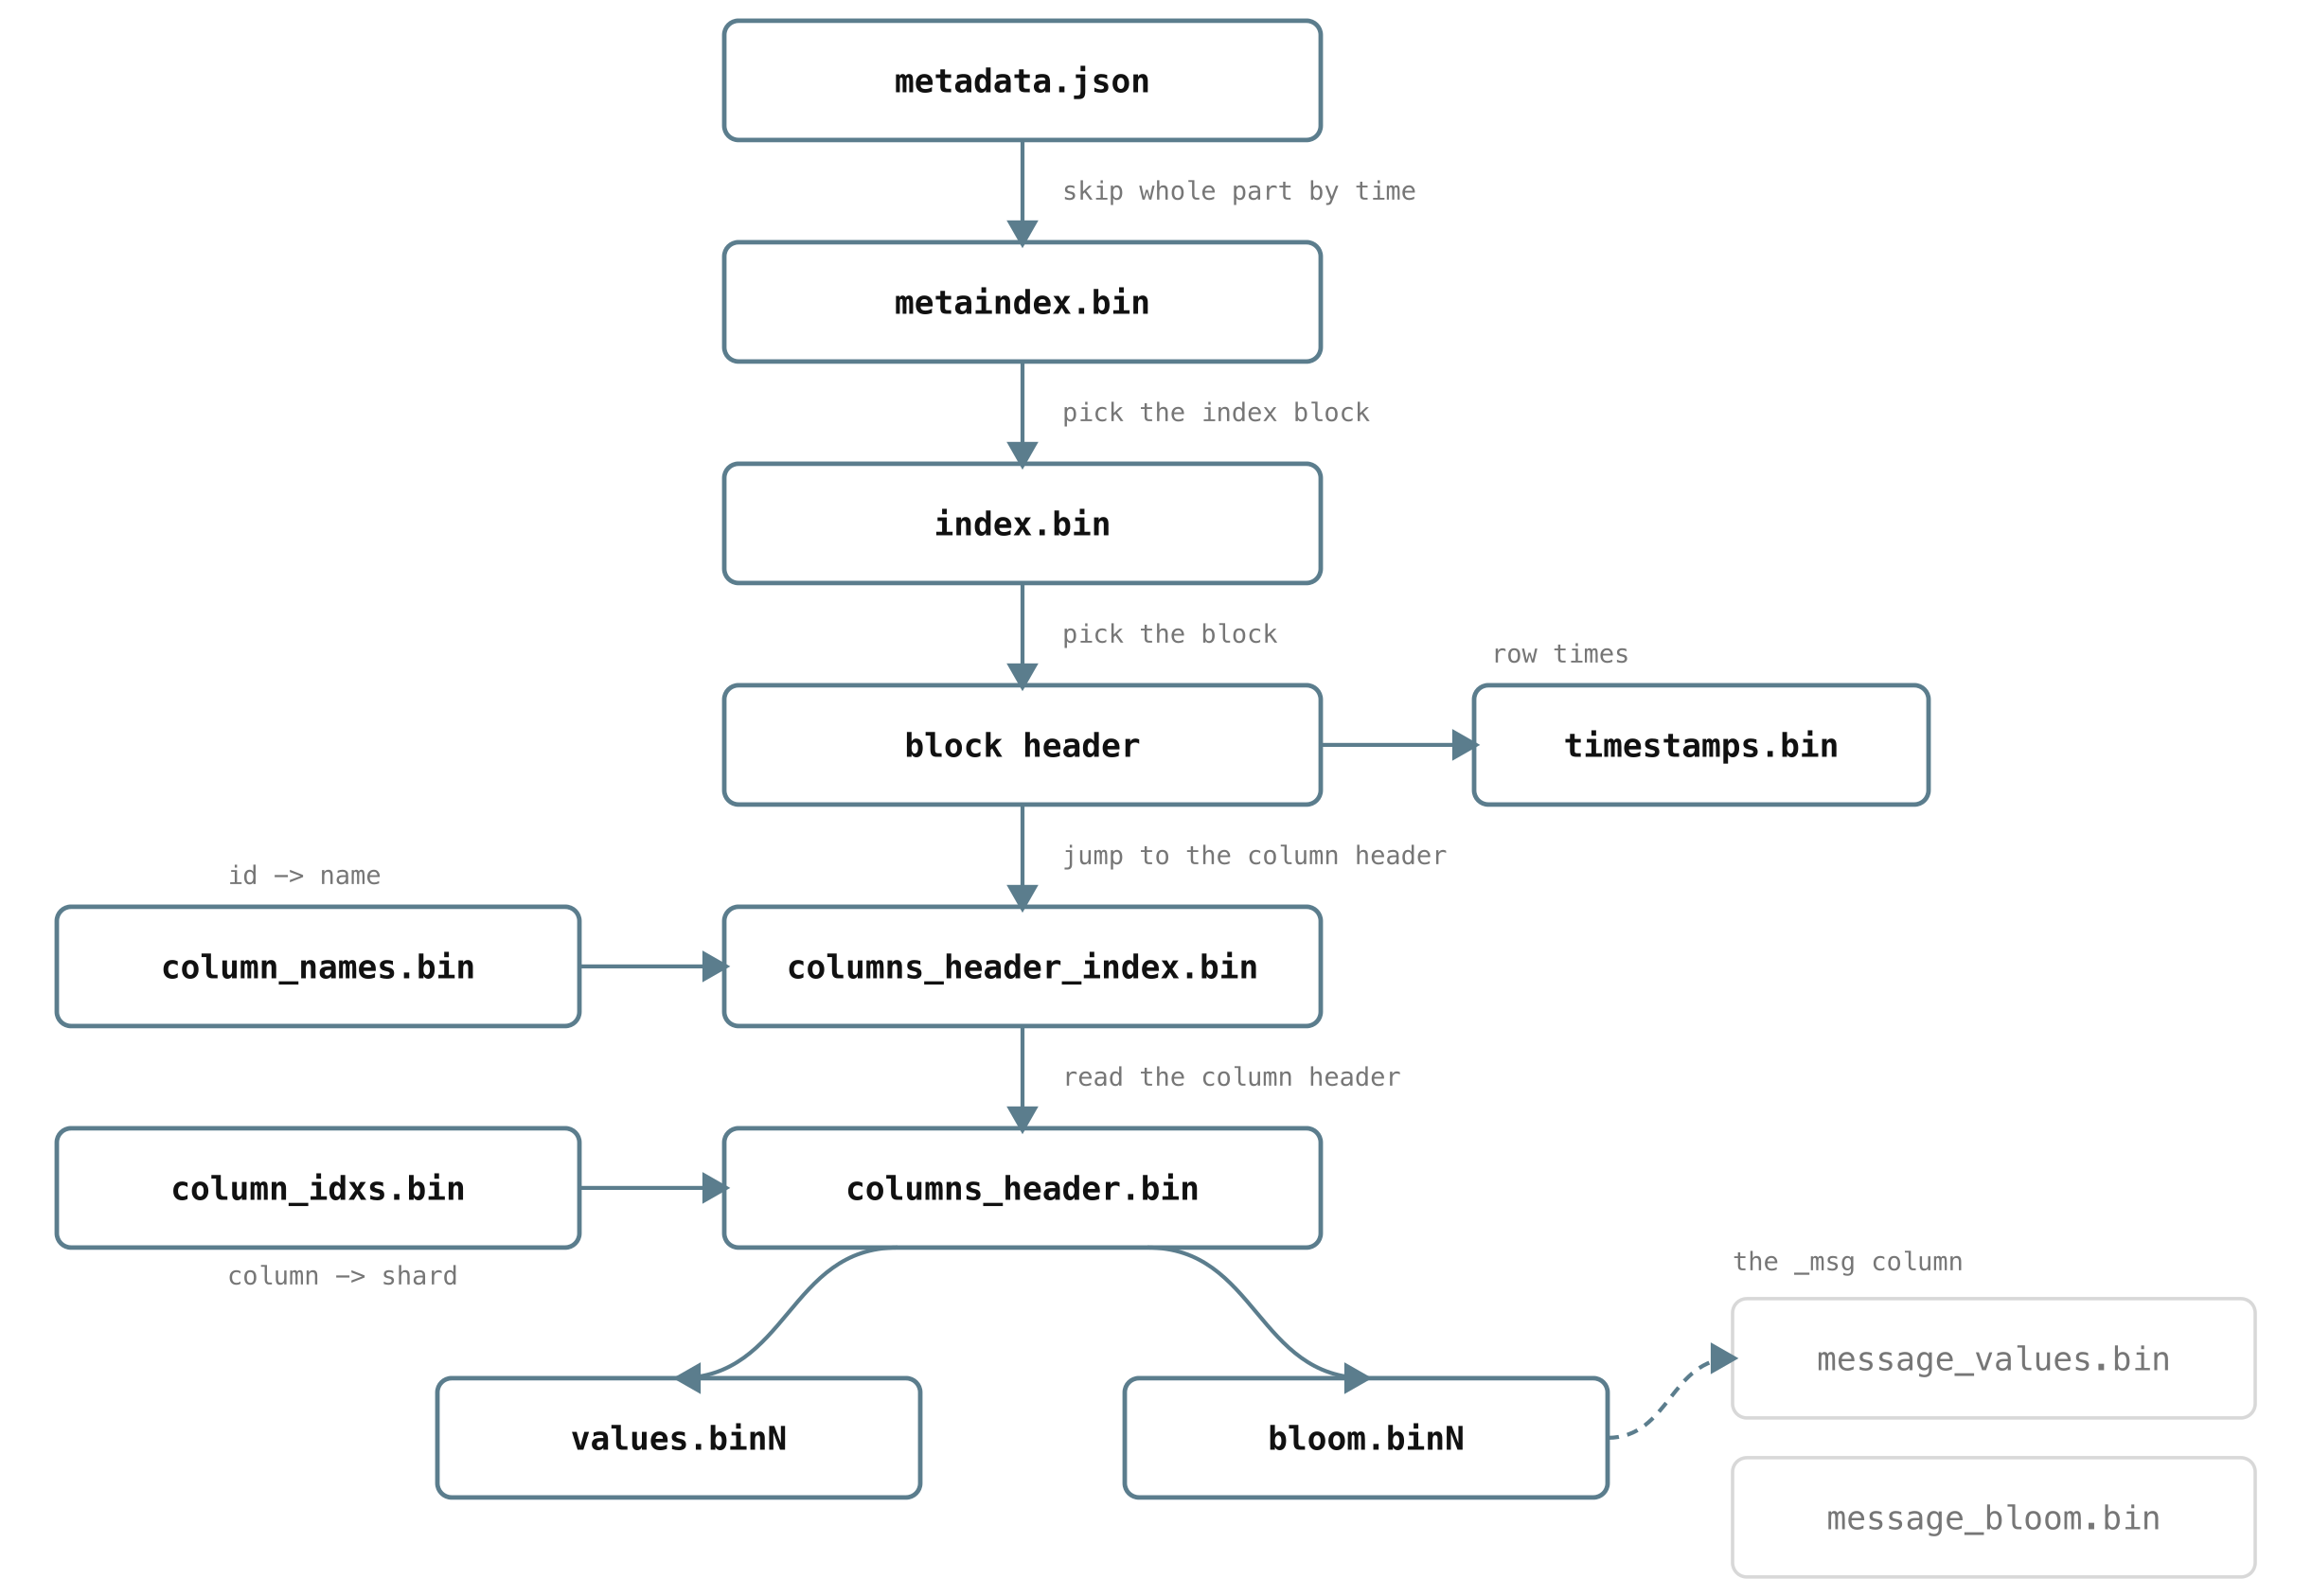
A part is a directory of files. If you list one, you will see something like this:
1882C35B4CE64498/
  ├── metadata.json
  ├── index.bin, metaindex.bin
  ├── timestamps.bin
  ├── values.bin0, values.bin1, ...
  ├── bloom.bin0, bloom.bin1, ...
  ├── message_values.bin, message_bloom.bin
  └── column_names.bin, column_idxs.bin, columns_header.bin, columns_header_index.bin
You do not need to memorize these. Most of them fall into a few groups, and almost every one exists to help VictoriaLogs rule out work before reading any real data.
5.1 metadata.json: the part-level summary
#
Every part has exactly one metadata.json, and it is human-readable, so VictoriaLogs can decide in an instant whether the part is even worth opening:
{
  "FormatVersion": 3,
  "CompressedSizeBytes": 537919490,
  "UncompressedSizeBytes": 6024698288,
  "RowsCount": 4240299,
  "BlocksCount": 1915,
  "MinTimestamp": 1767916800890319297,
  "MaxTimestamp": 1767946621349903397,
  "BloomValuesShardsCount": 60
}
From this alone, VictoriaLogs knows the part holds about 4.24 million rows ("RowsCount": 4240299) in 1915 blocks ("BlocksCount": 1915), takes about 513 MiB on disk ("CompressedSizeBytes": 537919490, from roughly 5.6 GiB of raw logs, so compression is doing real work here), and covers a specific time range (MinTimestamp and MaxTimestamp). If your query’s time range does not overlap that range, the whole part is skipped without reading anything else.
5.2 timestamps.bin: the time of every row
#
Every log has a timestamp, and timestamps.bin is the dedicated column that holds the _time of every row. It is kept separate from the field columns because almost every query filters or sorts by time, so it pays to have all the timestamps in one tight place.
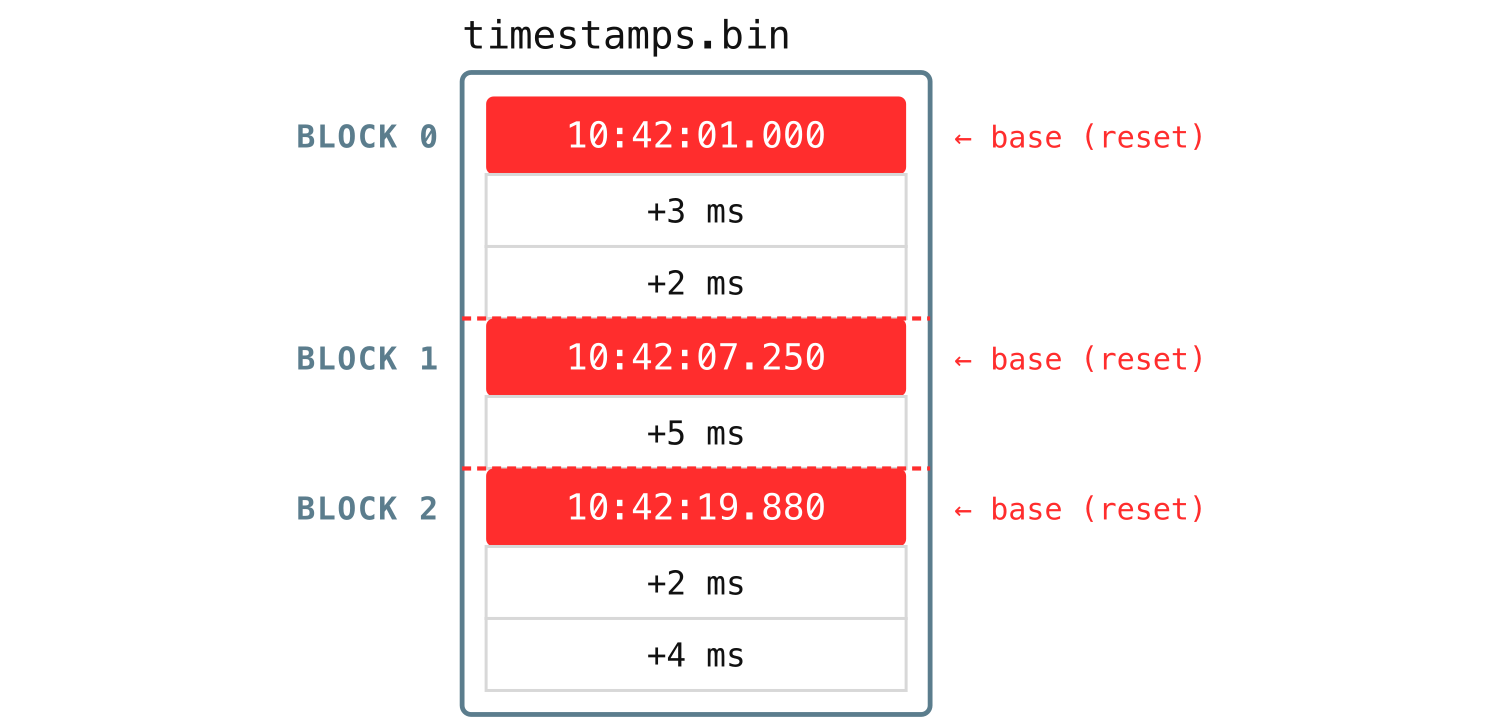
And it is stored compactly: instead of writing out every full timestamp, VictoriaLogs keeps the first one in full as a base and then only the small gap to each following row. A burst of logs a few milliseconds apart turns into a run of small numbers that compresses down to almost nothing.
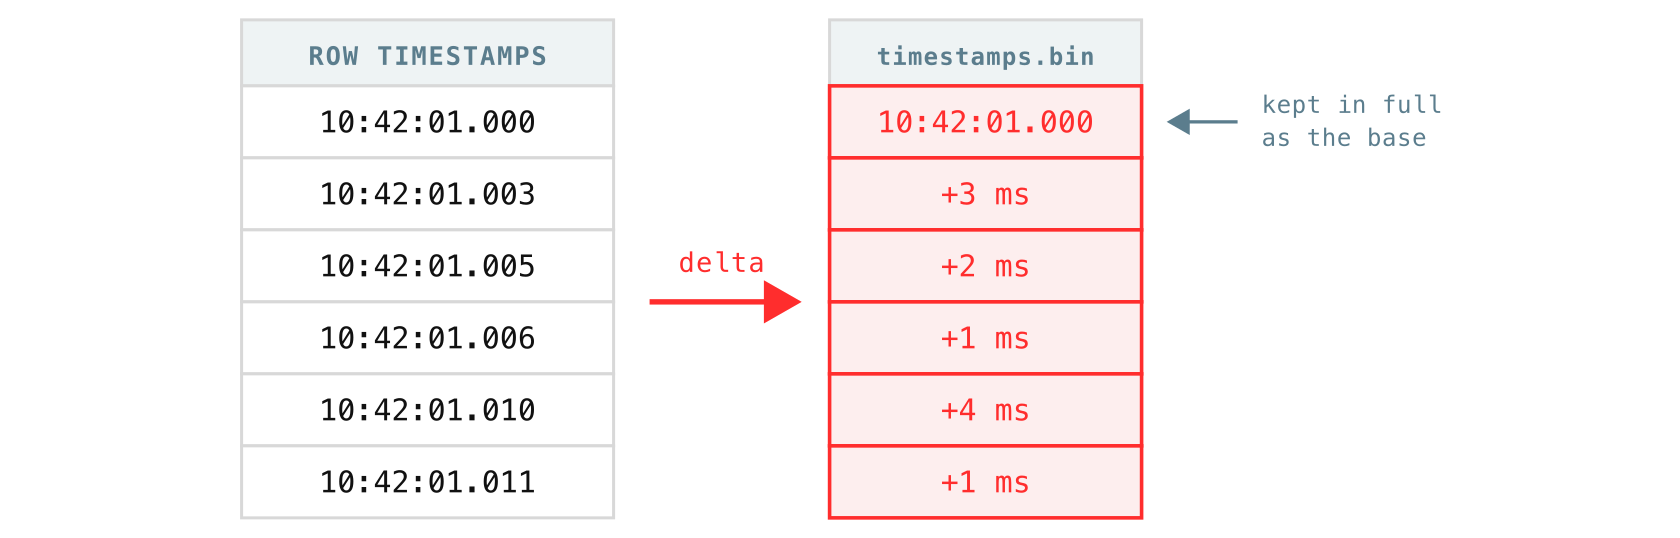
The diagram above shows only one block’s worth of timestamps. Across the whole file, the timestamps are organized the same way the logs are: the blocks are ordered by stream first, and within the same stream by time, and the rows inside each block are sorted by time as well.
The next few files are all about one thing: storing each field’s values and finding them fast. Back in section 4.2 we said each field is its own column, but on disk that column is not a single neat file. Following one field, say pod, through these files is the easiest way to see how they fit.
5.3 column_names.bin: short IDs for column names
#
Field names tend to be long and repetitive. Think of kubernetes.pod.name or kubernetes.labels.app, and remember that a single part can hold thousands or even millions of blocks. If every block had to spell out those names in its own metadata, the same long strings would be duplicated over and over, and the part would grow large and slow to read just from the names alone.
So VictoriaLogs gives every distinct field name in a part a short numeric column ID. column_names.bin is where the mapping lives: it is simply the ordered list of all field names in the part except _msg (it gets its own file), where a name’s position in the list is its ID.
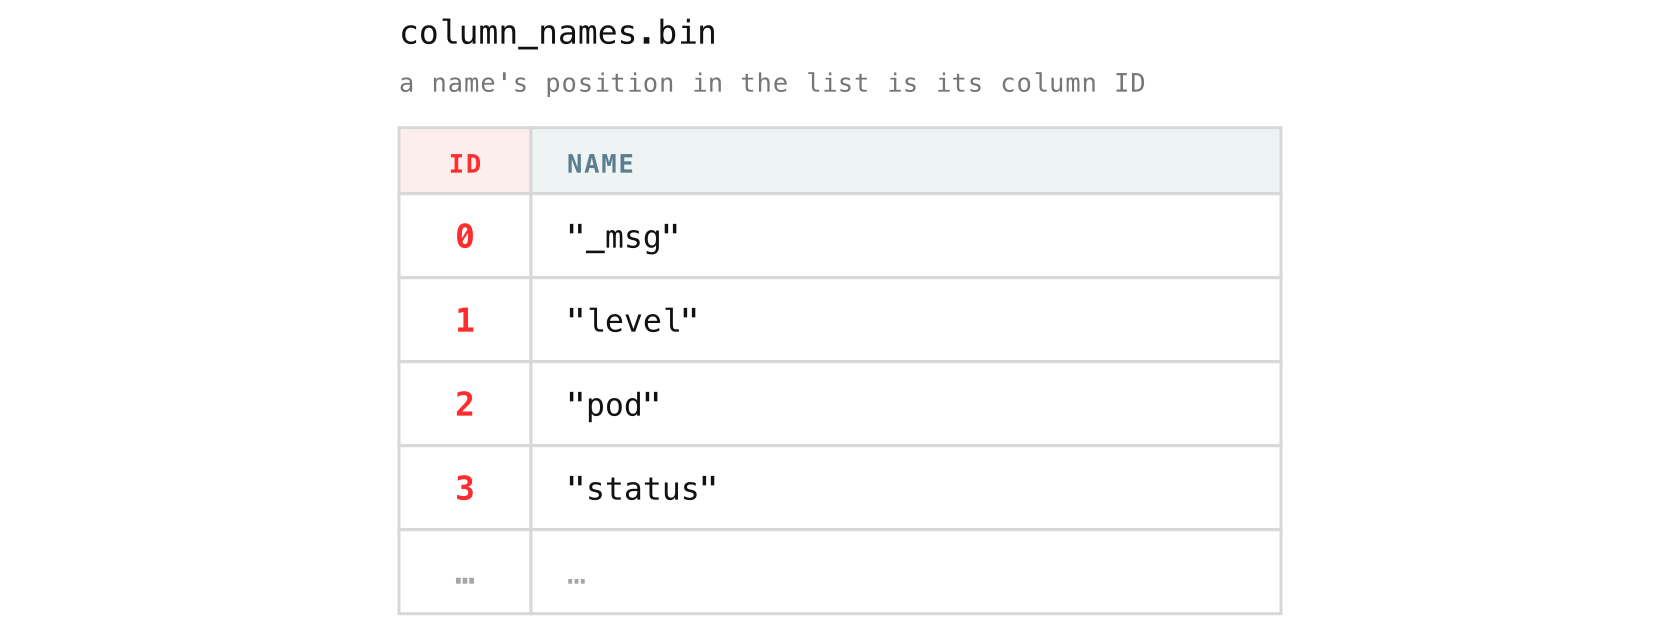
After this, nothing else in the part has to repeat the full name. Blocks and their column headers refer to columns by ID, so kubernetes.pod.name is stored once here and becomes a small integer everywhere else.
5.4 column_idxs.bin: which shard a column lives in
#
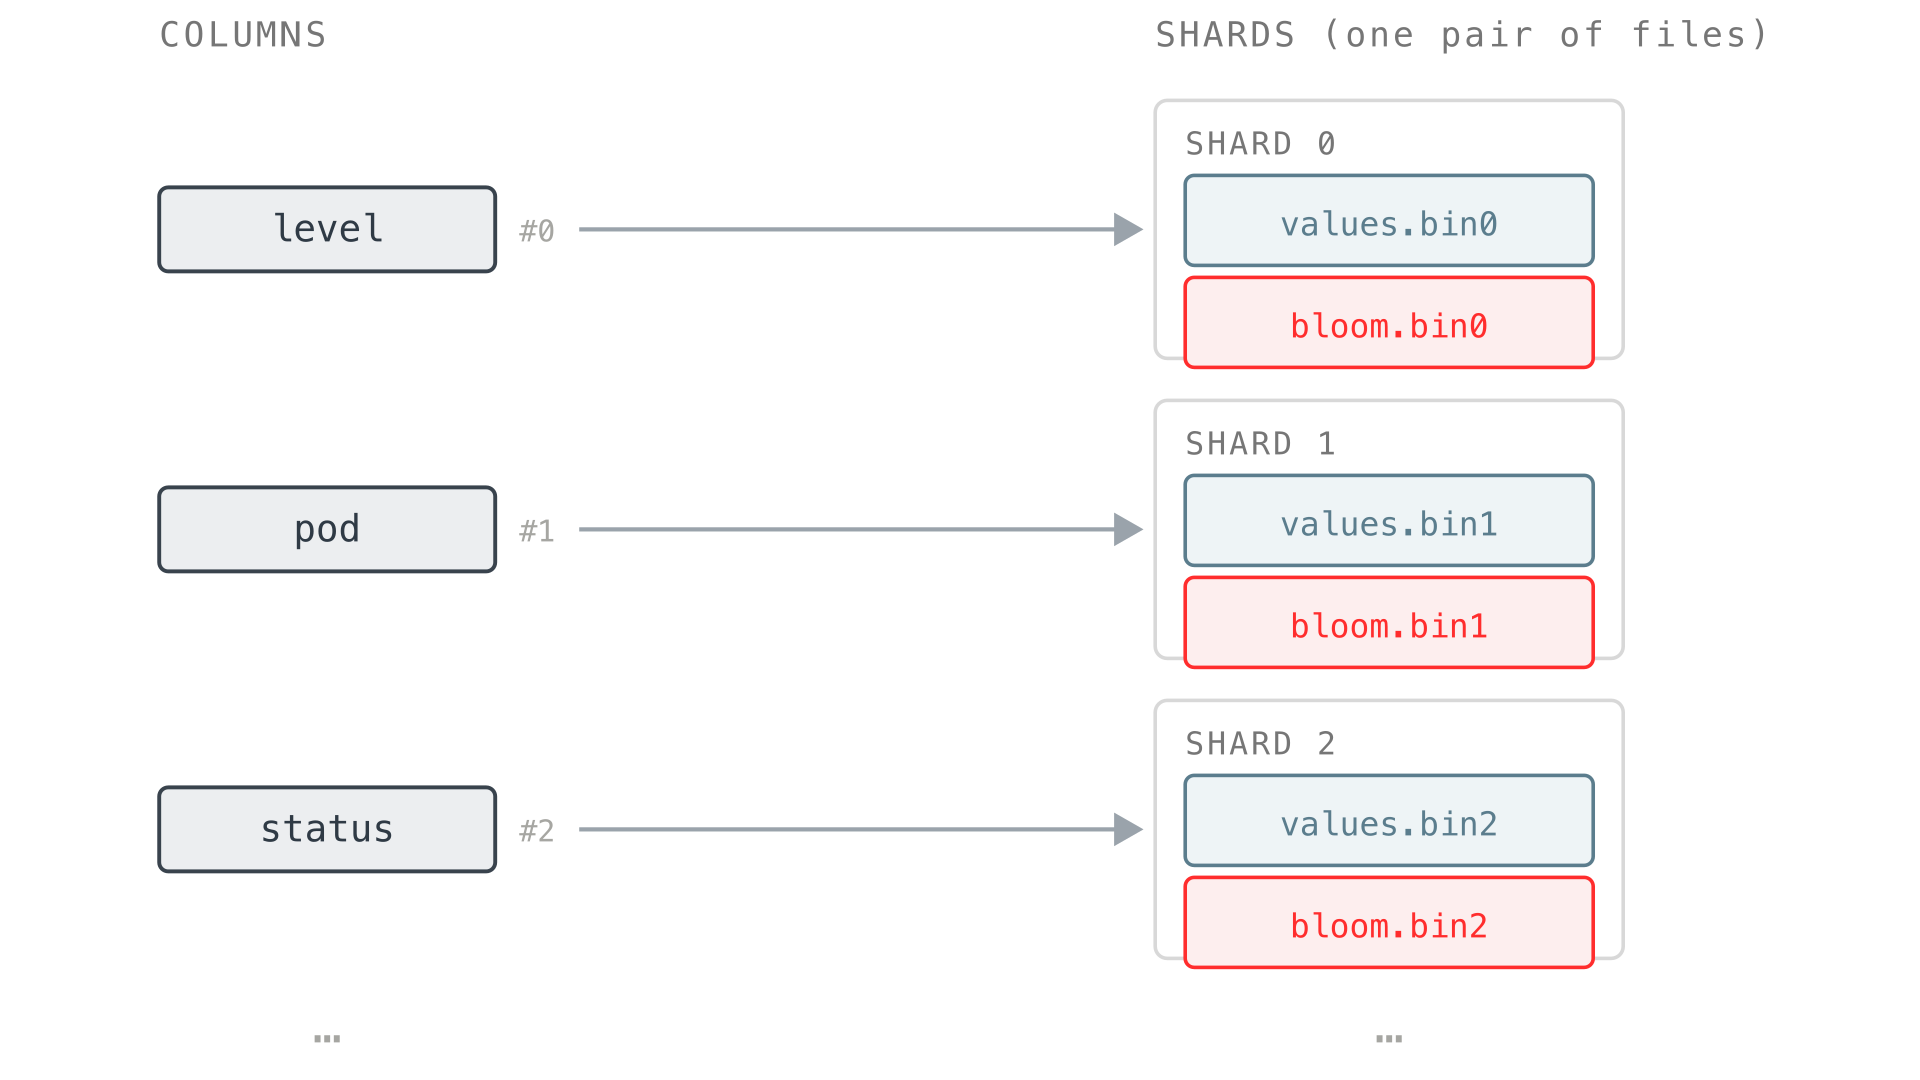
The next question is where a column’s data actually goes. VictoriaLogs does not pile all the field values into one giant file. Instead, it splits them across shards, where each shard is a pair of files:
- a
values.binNfor the values, - a
bloom.binNfor the bloom filter (more on bloom filters shortly).
Each column’s values stay together in a single shard, but different columns are spread across different shards, so a part with many fields ends up with its columns distributed over many shard files instead of crammed into one.
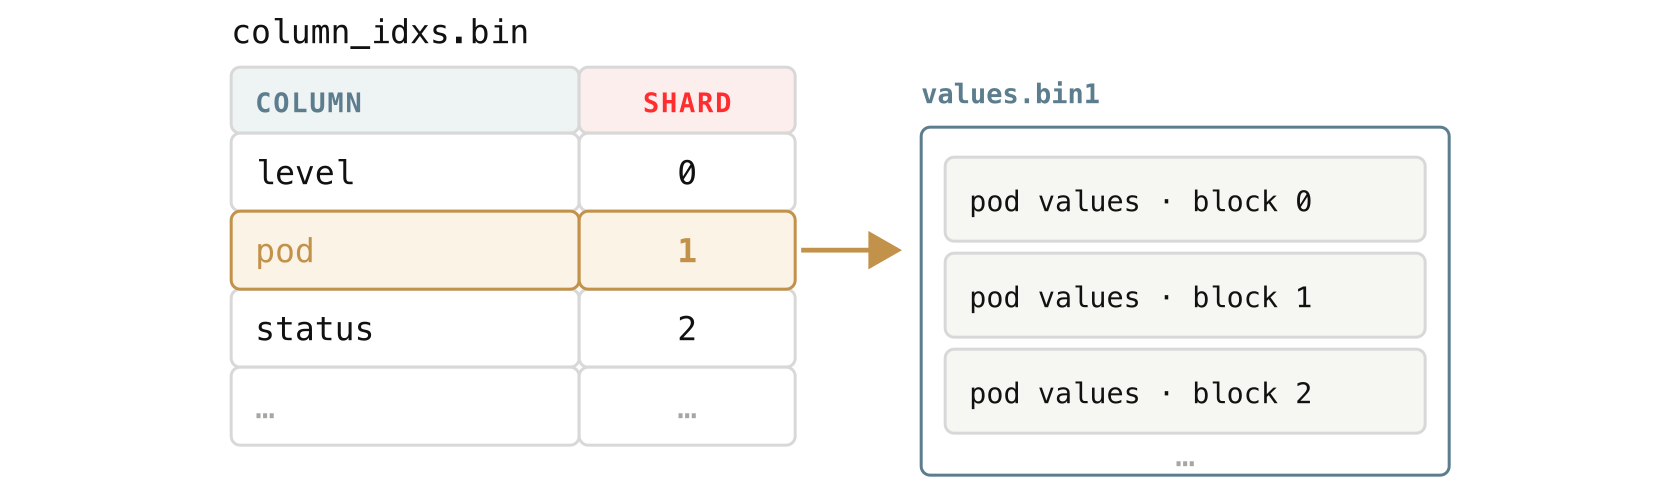
For every distinct field name in the part, VictoriaLogs picks a shard number and records that “column to shard” mapping in column_idxs.bin. The assignment is stable for the whole part, so the same field always ends up in the same shard.
If pod is assigned to shard 1, then every block’s pod values go into values.bin1, each block at its own offset (its own spot in the file).
A part can have up to 128 shards (values.bin0 through values.bin127, and the matching bloom.bin0 through bloom.bin127). They are created as new field names appear, so a small part may have only a few. If a part has more than 128 distinct fields, the shard numbers wrap back around to 0: the 129th field goes into values.bin0 next to the first, the 130th into values.bin1, and so on, so beyond 128 fields some fields simply share a shard.
The exact count is the BloomValuesShardsCount we saw in metadata.json, here it is again so you do not have to scroll back up:
{
  "FormatVersion": 3,
  "CompressedSizeBytes": 537919490,
  "UncompressedSizeBytes": 6024698288,
  "RowsCount": 4240299,
  "BlocksCount": 1915,
  "MinTimestamp": 1767916800890319297,
  "MaxTimestamp": 1767946621349903397,
  "BloomValuesShardsCount": 60
}
The highlighted line is the shard count for this part. 60 means VictoriaLogs created 60 shard pairs here, values.bin0 through values.bin59, each with its matching bloom.bin0 through bloom.bin59. That number is simply how many distinct field names the part has seen: the first field lands in shard 0, the second in shard 1, and so on.
Spreading columns this way keeps any single file from becoming a bottleneck and lets VictoriaLogs read different fields in parallel, since they often live in different shard files.
5.5 values.binN and message_values.bin: the field values
#
This is where the log data itself finally lives. Each block encodes its values for a field into one blob, a single continuous chunk of bytes, and appends it to that field’s shard file.
Because the shard is fixed per field, a single values.binN ends up holding many small blobs, one per block per field that maps to it:
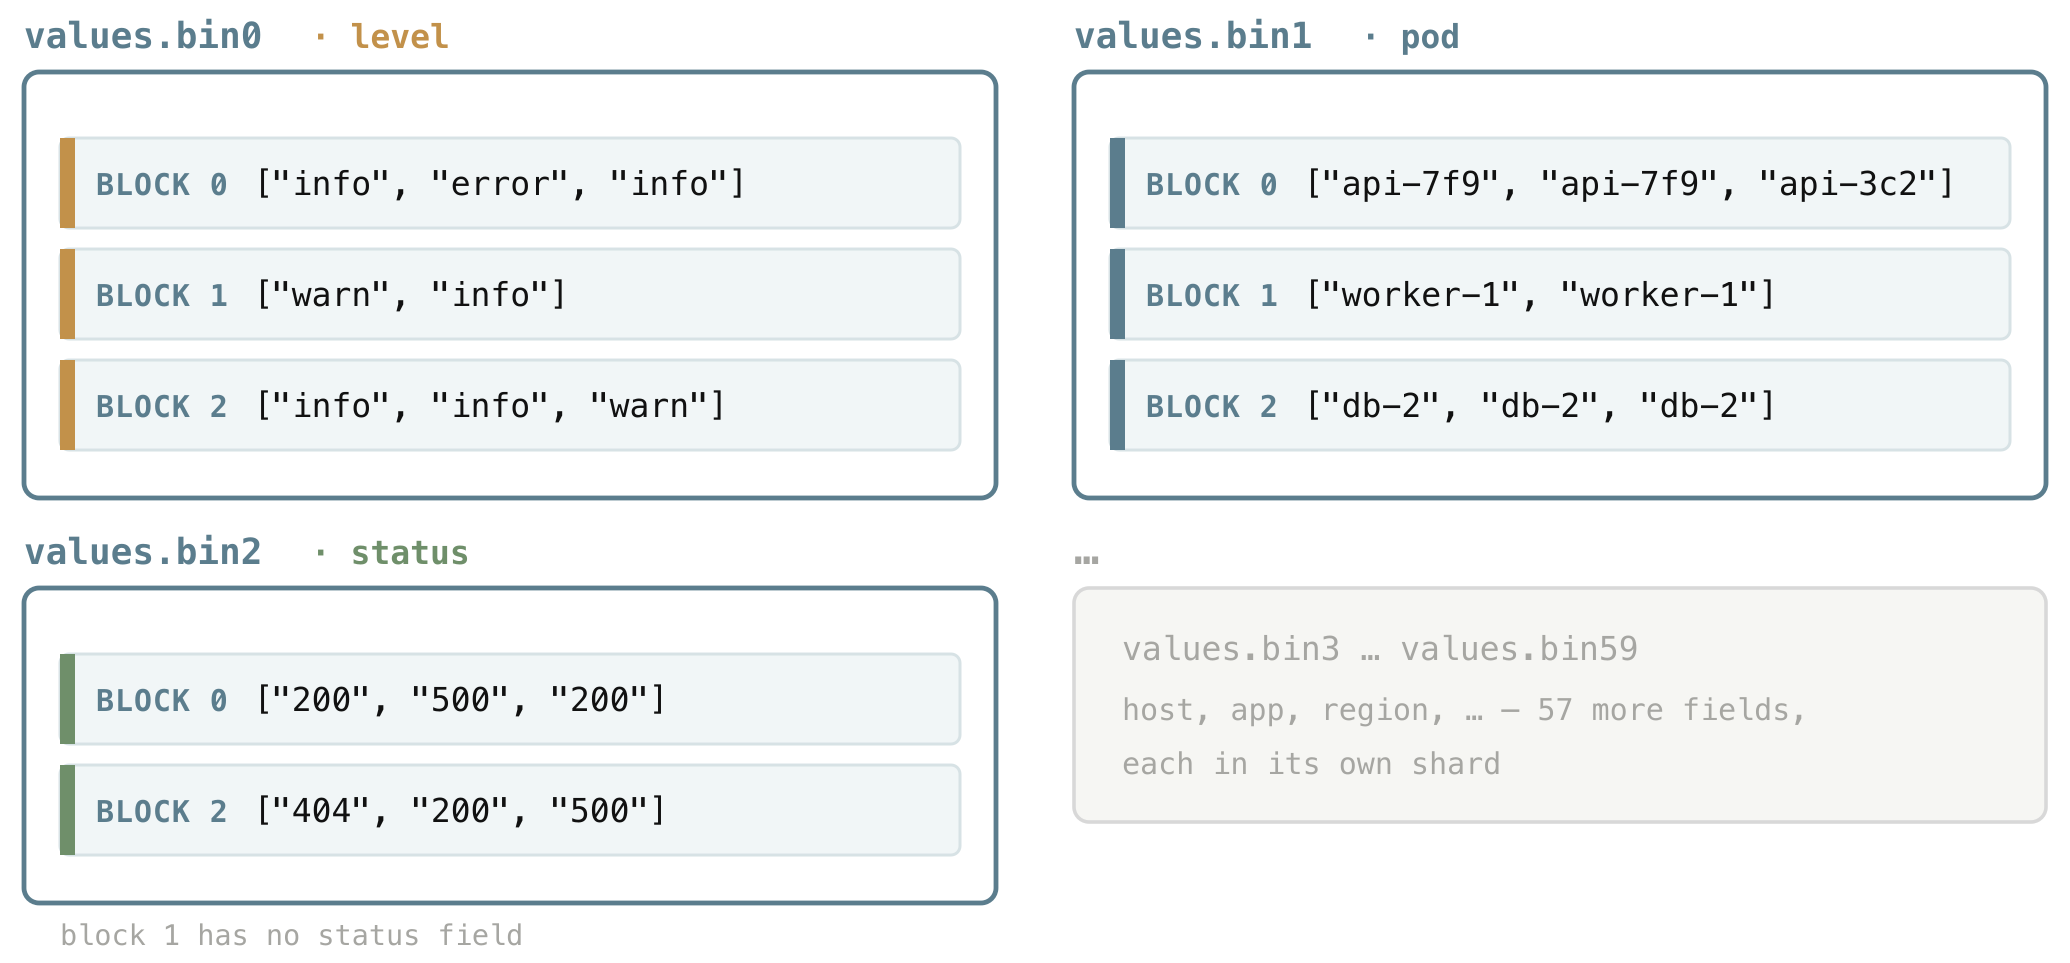
Inside each blob are that column’s values for the block, one per row, packed in whatever way fits what the column holds, exactly as we saw in section 4.2.
- A column of repeated words is stored as a small dictionary plus references to it;
- numbers are stored as numbers;
- values that are all the same become a single constant;
- and types like timestamps or IP addresses get their own compact form.
The point for now is just that each value type is compacted in the way that suits it best, so we will not go down the rabbit hole of every format here.
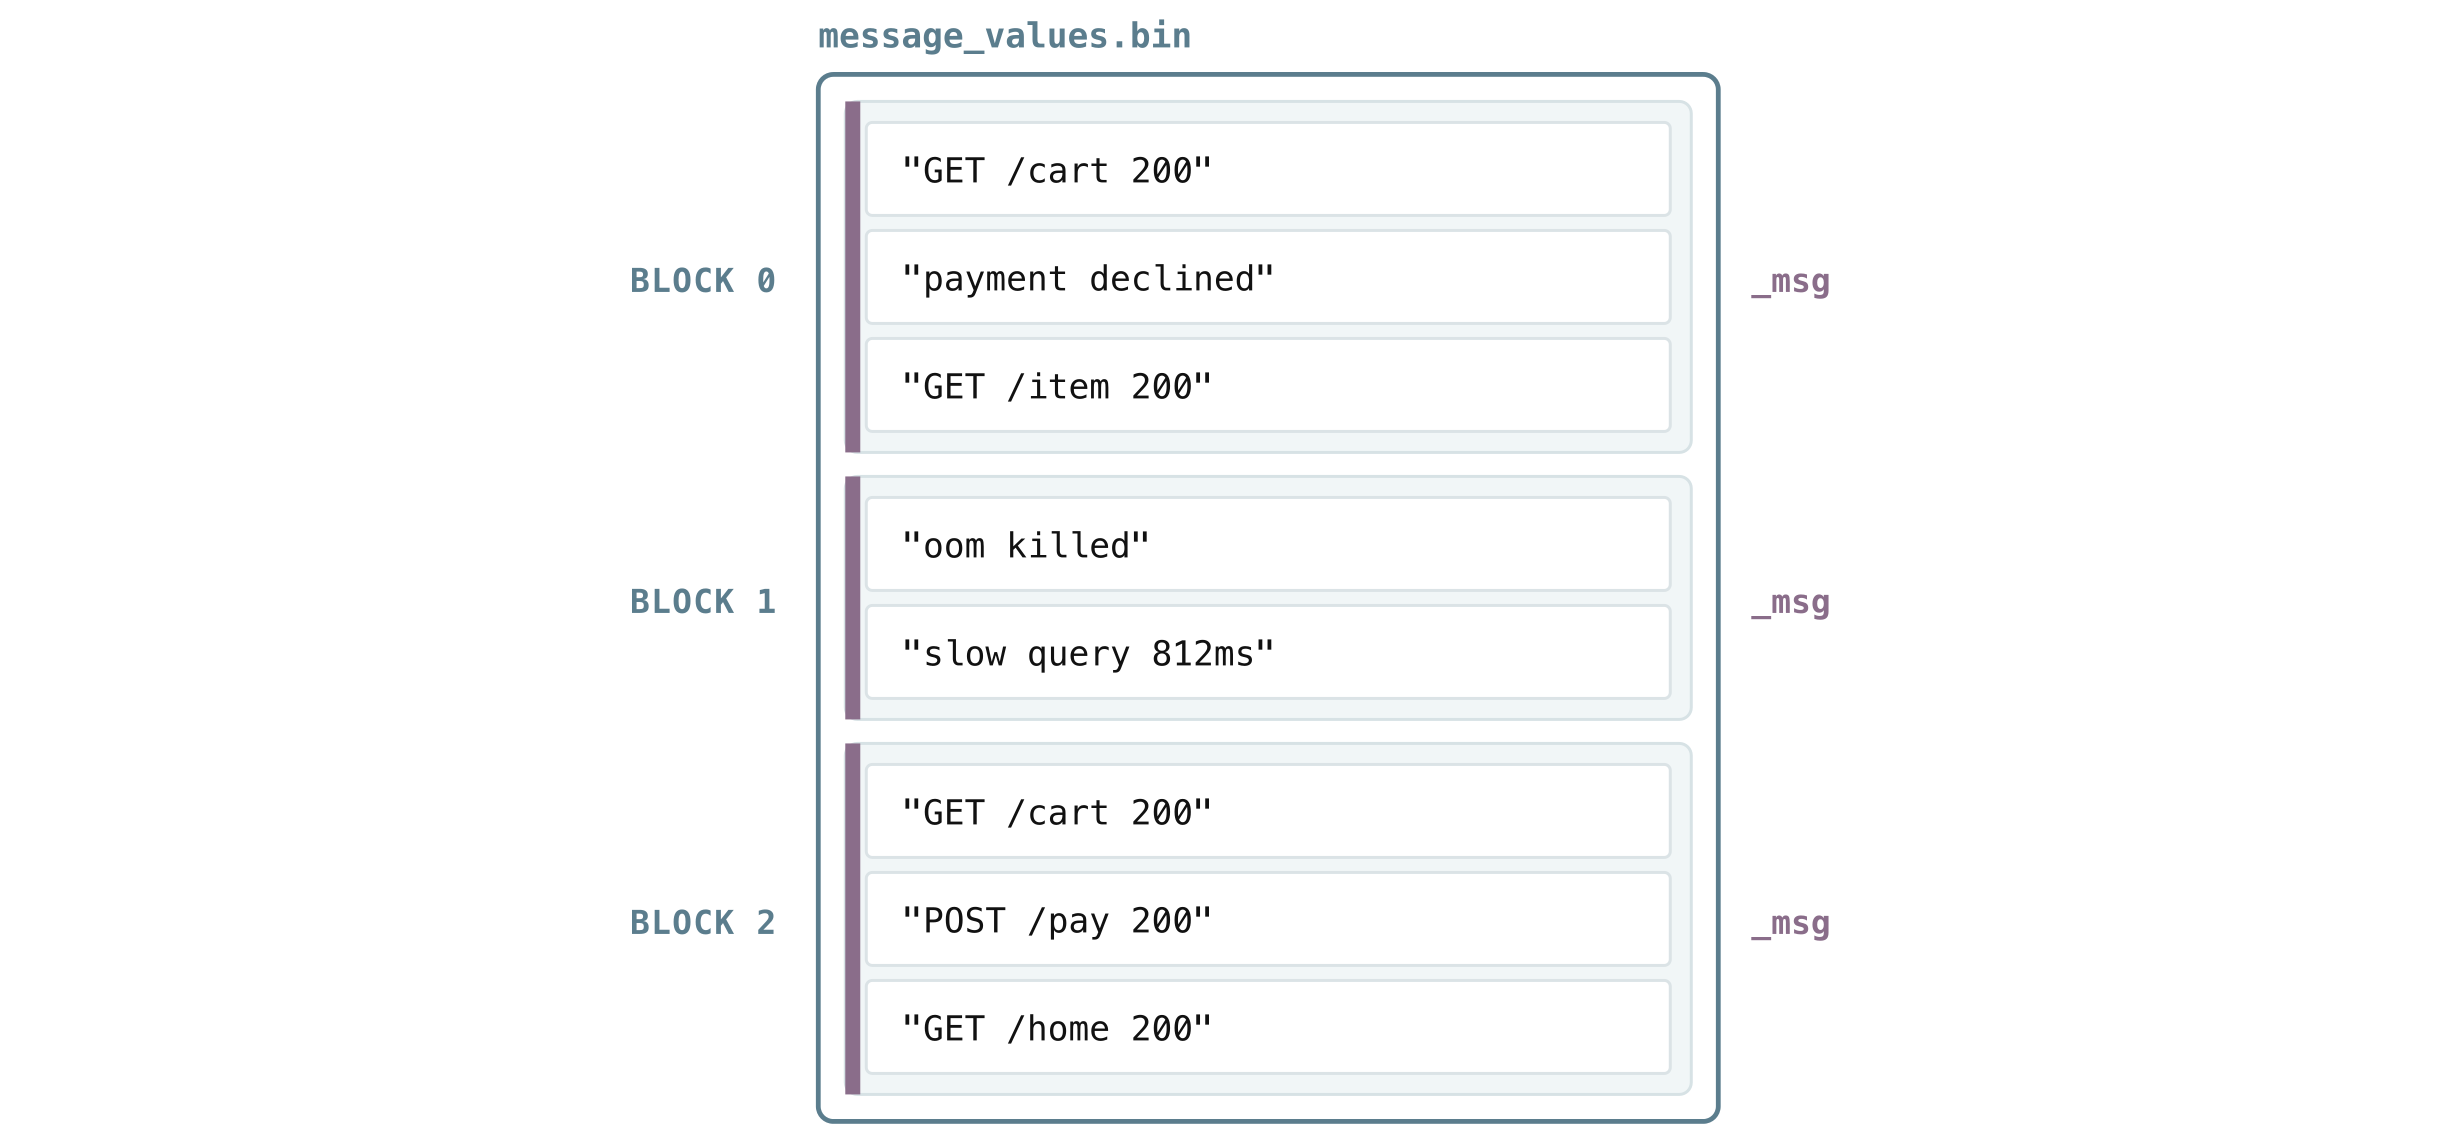
The message field is a special case. Internally VictoriaLogs treats _msg as the “main column” (its column name is actually the empty string, shown as _msg in queries), and it keeps message data in its own file, message_values.bin, instead of mixing it into the shared shards.
Messages are usually the largest and most-read field, so giving them their own file lets VictoriaLogs read and decode them independently from the smaller fields.
5.6 Bloom filters: bloom.bin and message_bloom.bin
#
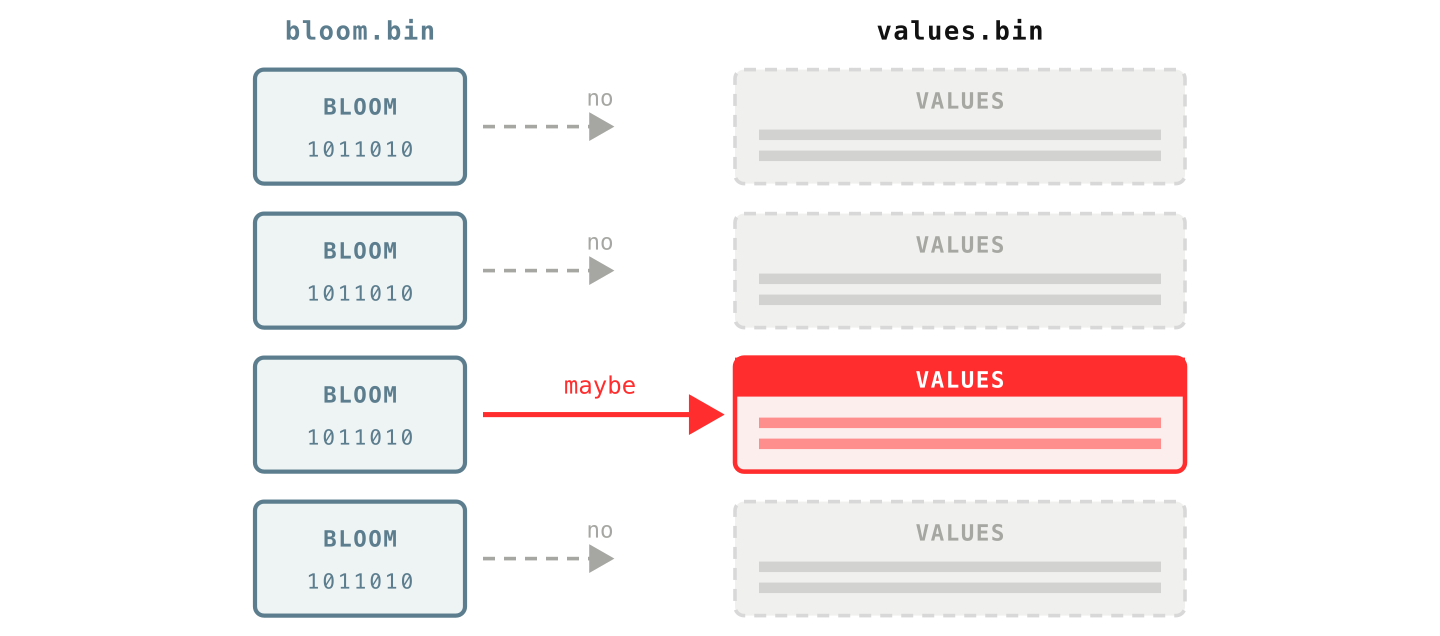
Right beside those values sit the bloom filters, sharded the very same way (bloom.binN pairs with values.binN, and message_bloom.bin covers the message column). Their job is to be a cheap pre-filter: a quick yes/no check that runs before VictoriaLogs reads any real values, so most blocks can be thrown out without ever being opened.
A bloom filter is a tiny fingerprint of all the words in one block’s column. It does not store the words themselves, just enough bits to answer one question: “could this word be in this block?”
The answer is one of two: “definitely not” (with certainty) or “maybe”. It can:
- occasionally say “maybe” when the word is not actually there,
- but never says “no” when it is.
That one-sided guarantee is exactly what a filter needs. So when you search for error, VictoriaLogs asks each block’s bloom filter first, skips every block that answers “definitely not”, and only then reads the actual values from the few blocks that answered “maybe”.
To build it, VictoriaLogs takes one column of a block, say the _msg field, and breaks every value in it into tokens, where a token is a run of letters, digits, or underscores.
For messages like GET /cart 200 and POST /pay 200, the tokens are GET, cart, 200, POST, pay, and so on. It then records the unique tokens of the whole block in that block’s bloom filter. When you later search for error, VictoriaLogs splits your query into tokens the same way and asks the bloom “are these tokens here?”.
Each unique token costs only about 2 bytes, so the size is easy to reason about: a block-column with 1,000 unique words needs roughly 2 KB of bloom, and one with 20,000 unique tokens about 40 KB. That is why full-text search over very wordy logs stays cheap.
You can measure this on your own data. How many unique words live in your messages (an expensive query):
* | unpack_words as words drop_duplicates | unroll words | stats count_uniq(words) as unique_words
The 99th-percentile word count per message (a cheaper one):
* | unpack_words as words drop_duplicates | json_array_len(words) as words_count | stats quantile(0.99, words_count) as p99_words_per_msg
You can try both right now in the VictoriaLogs playground.
Now, the bloom filter is split up exactly like the values: there is one bloom blob per (block, column), a fingerprint of that whole column in that one block.
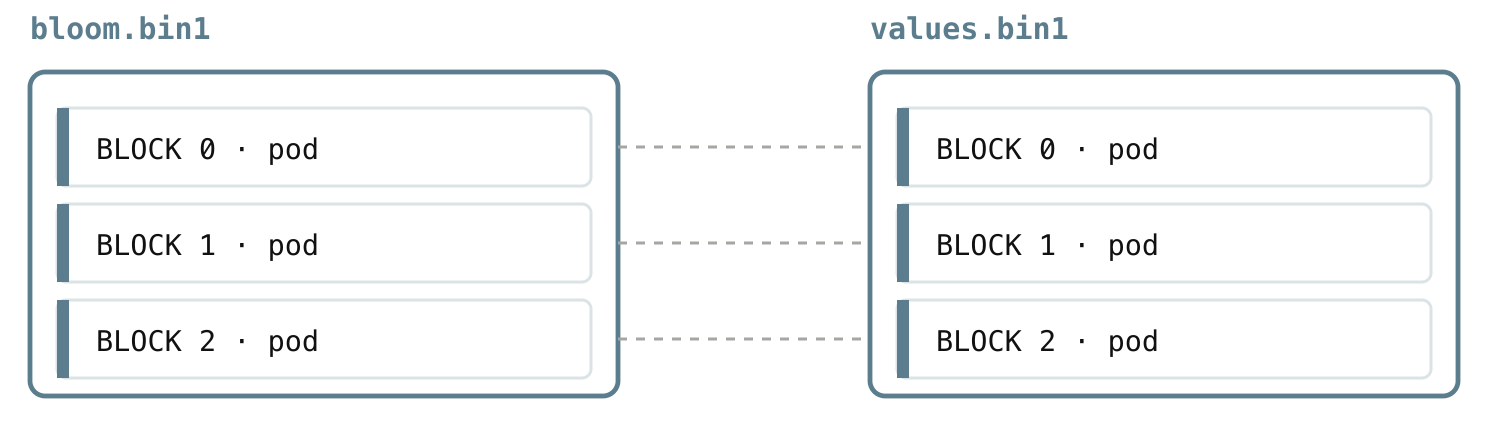
And the two line up one-to-one: bloom.binN and values.binN share the same shard number, so the moment a block’s bloom answers “maybe”, the matching values blob is sitting in the paired file, ready to read.
5.7 columns_header.bin and columns_header_index.bin: locating a column in a block
#
We now have almost everything except the final connection. We have short IDs for field names (5.3), we know which shard a field lives in (5.4), and we know its values and bloom filter sit as paired blobs in values.binN and bloom.binN (5.5, 5.6).
One question is still open: a single values.binN holds many blobs packed back to back, so where exactly does one block’s pod blob start, and how many bytes long is it? Pointing to that exact byte range, so VictoriaLogs can read it without scanning the whole file, is the job of the column header.
A column header is the small record that describes one field inside one block, so there is one of them per (block, column). It is a map rather than data, and it carries just enough to act on the column without reading it blindly:
- the value type (string, dictionary, number, timestamp, IP, and so on), which tells VictoriaLogs how to read the bytes,
- optional min and max values for numeric, timestamp, and IP columns, so a range filter can rule the block out without touching it,
- and the byte offset and size of that column’s value blob, plus the offset and size of its bloom blob.
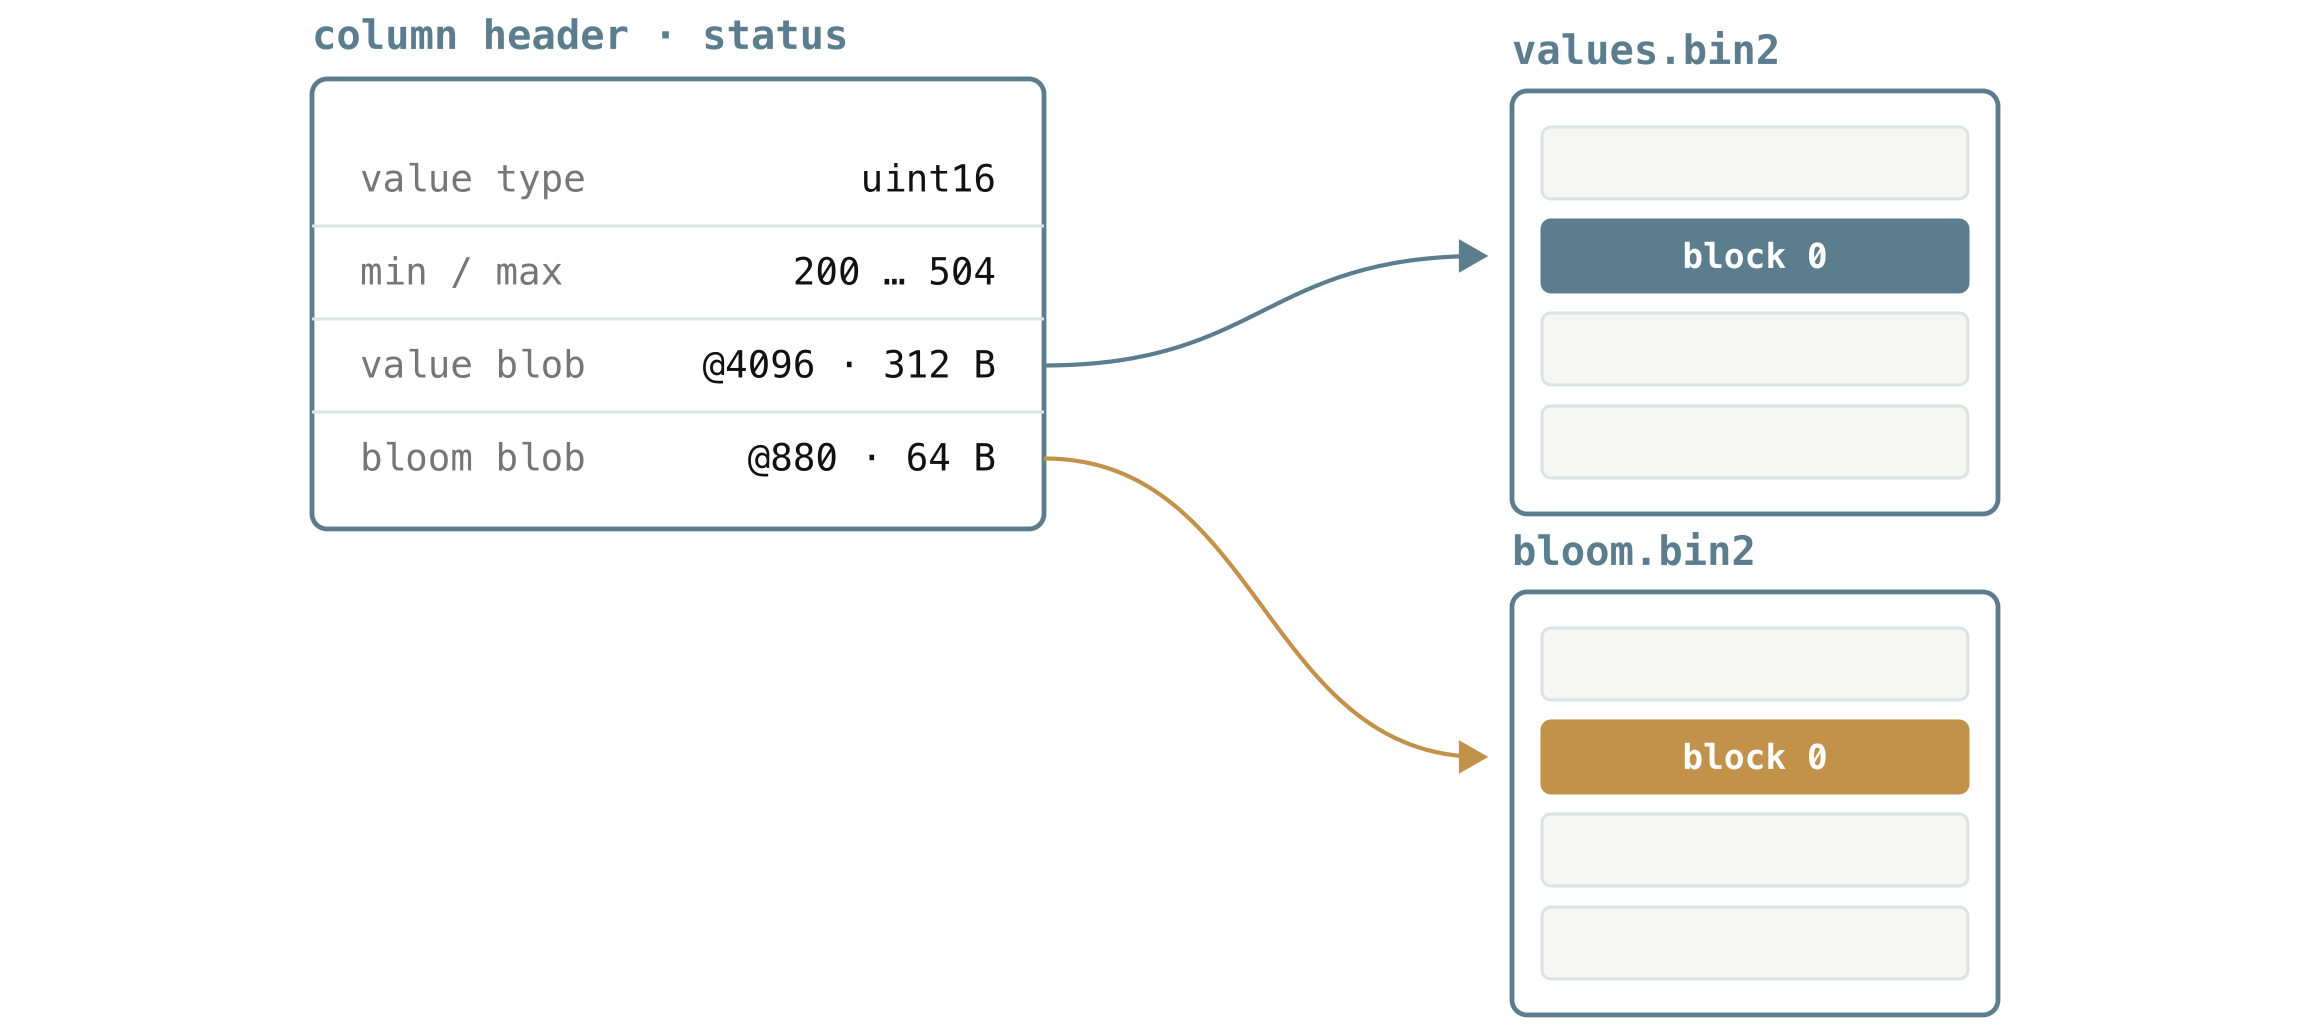
The diagram above is one such header for the status column of a block. It says:
- the values are small whole numbers (the
uint16type), - and they range from
200to504, - that the value blob starts at offset
4096and runs for312bytes invalues.bin2, - and that its bloom blob starts at offset
880and is64bytes inbloom.bin2.
That is all VictoriaLogs needs to either skip the block on a range filter, or seek straight to those two byte ranges and read nothing else.
A block usually holds many columns, so all of its headers are packed together and written as a single blob, one blob per block, in columns_header.bin. The file is laid out in block order, and since different blocks can contain different fields, each block’s blob holds exactly the headers for the columns that block has.
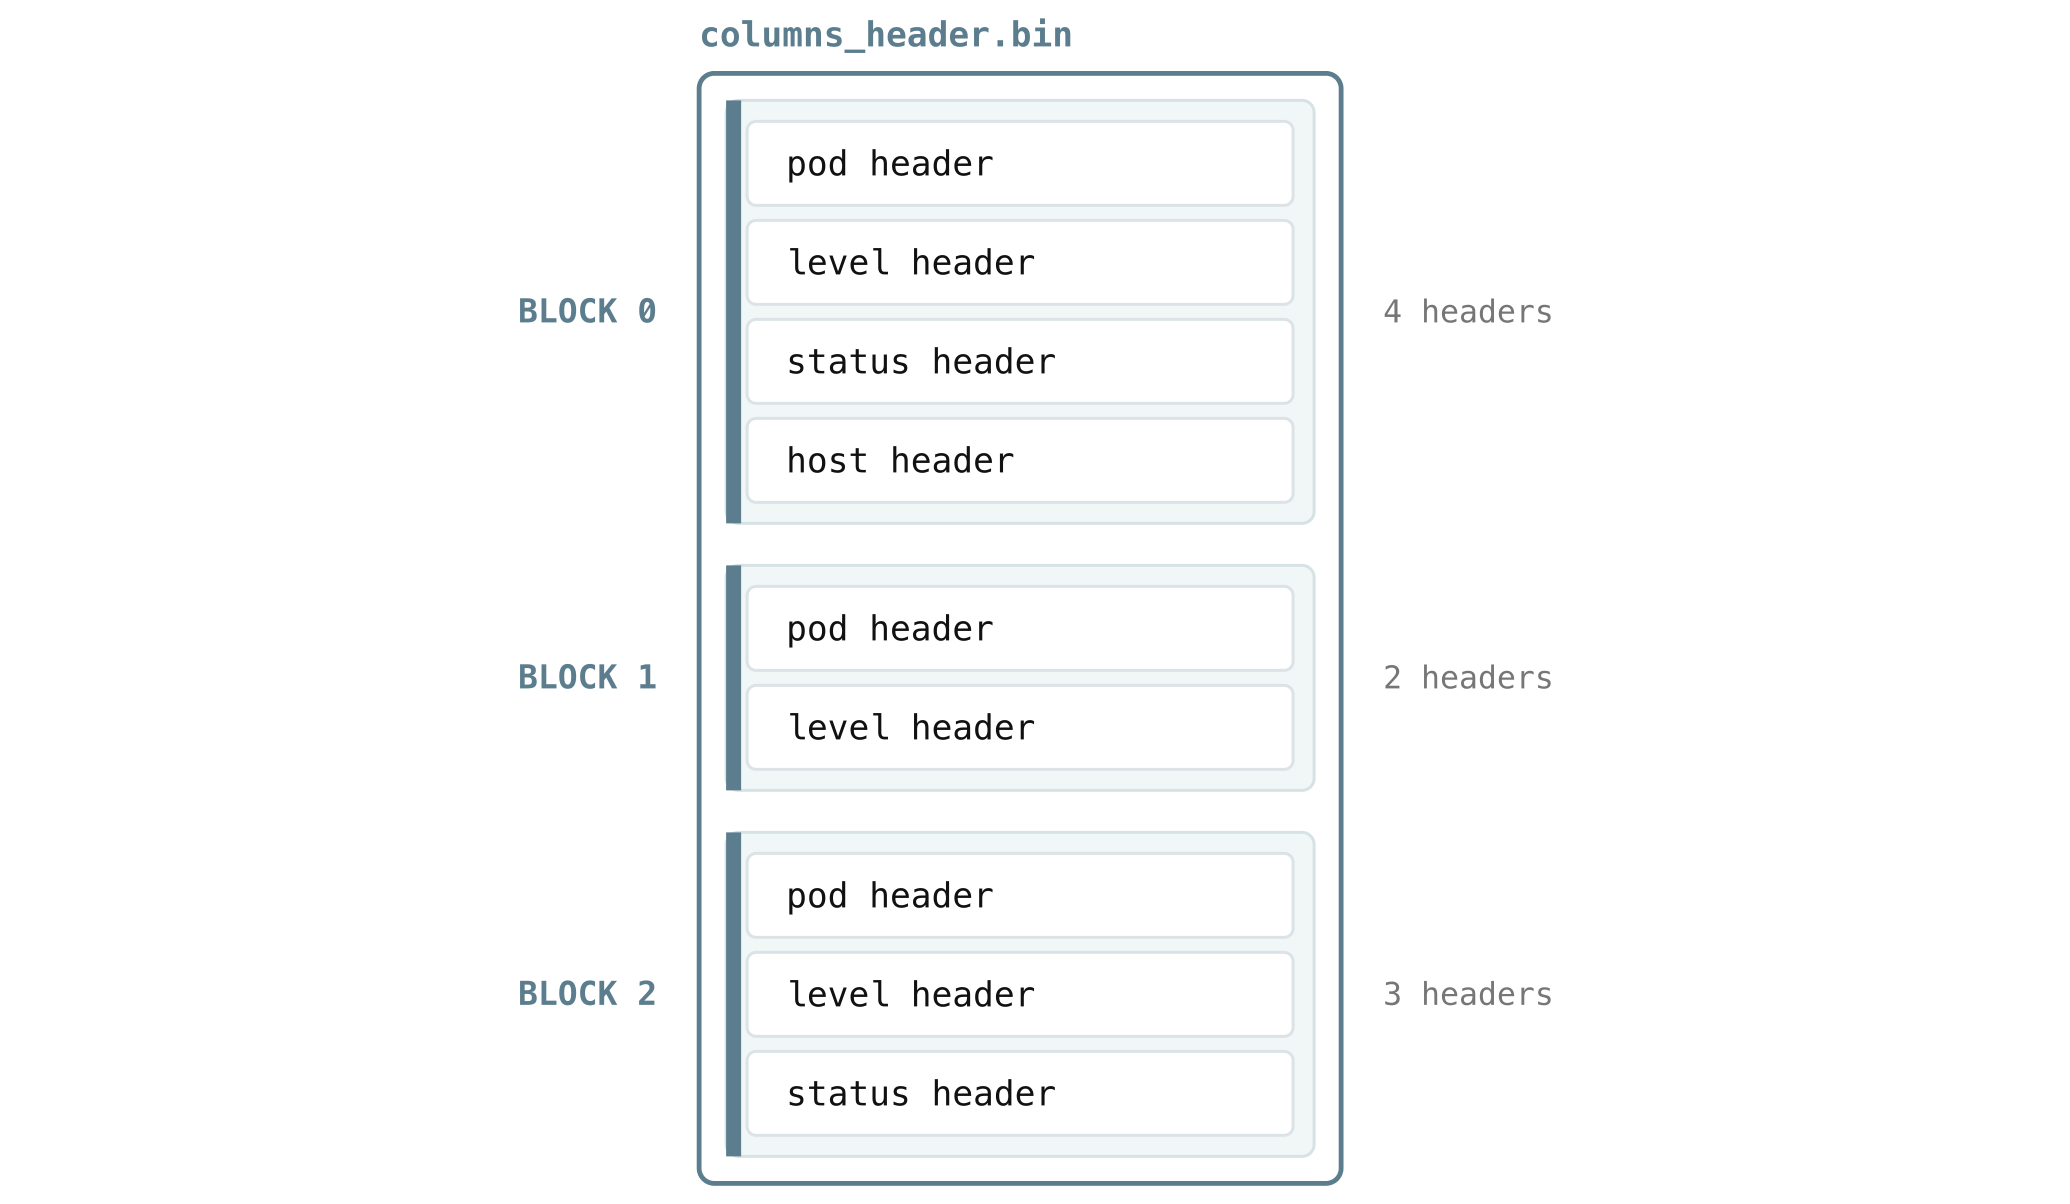
That packing creates a small problem. Say you want only status from block 0, which stores pod, level, status, host in that order. To find it by hand, you would have to start at the first header, read how long pod is to know where level starts, read level to find where status starts, and so on, touching every header that happens to come before the one you actually want.
columns_header_index.bin removes that walk. For each block, it stores a tiny lookup table mapping column IDs to the exact byte offset of each column’s header within the blob. So instead of scanning, VictoriaLogs reads the table, sees that status (column 2) lives at offset 96, and jumps straight there.
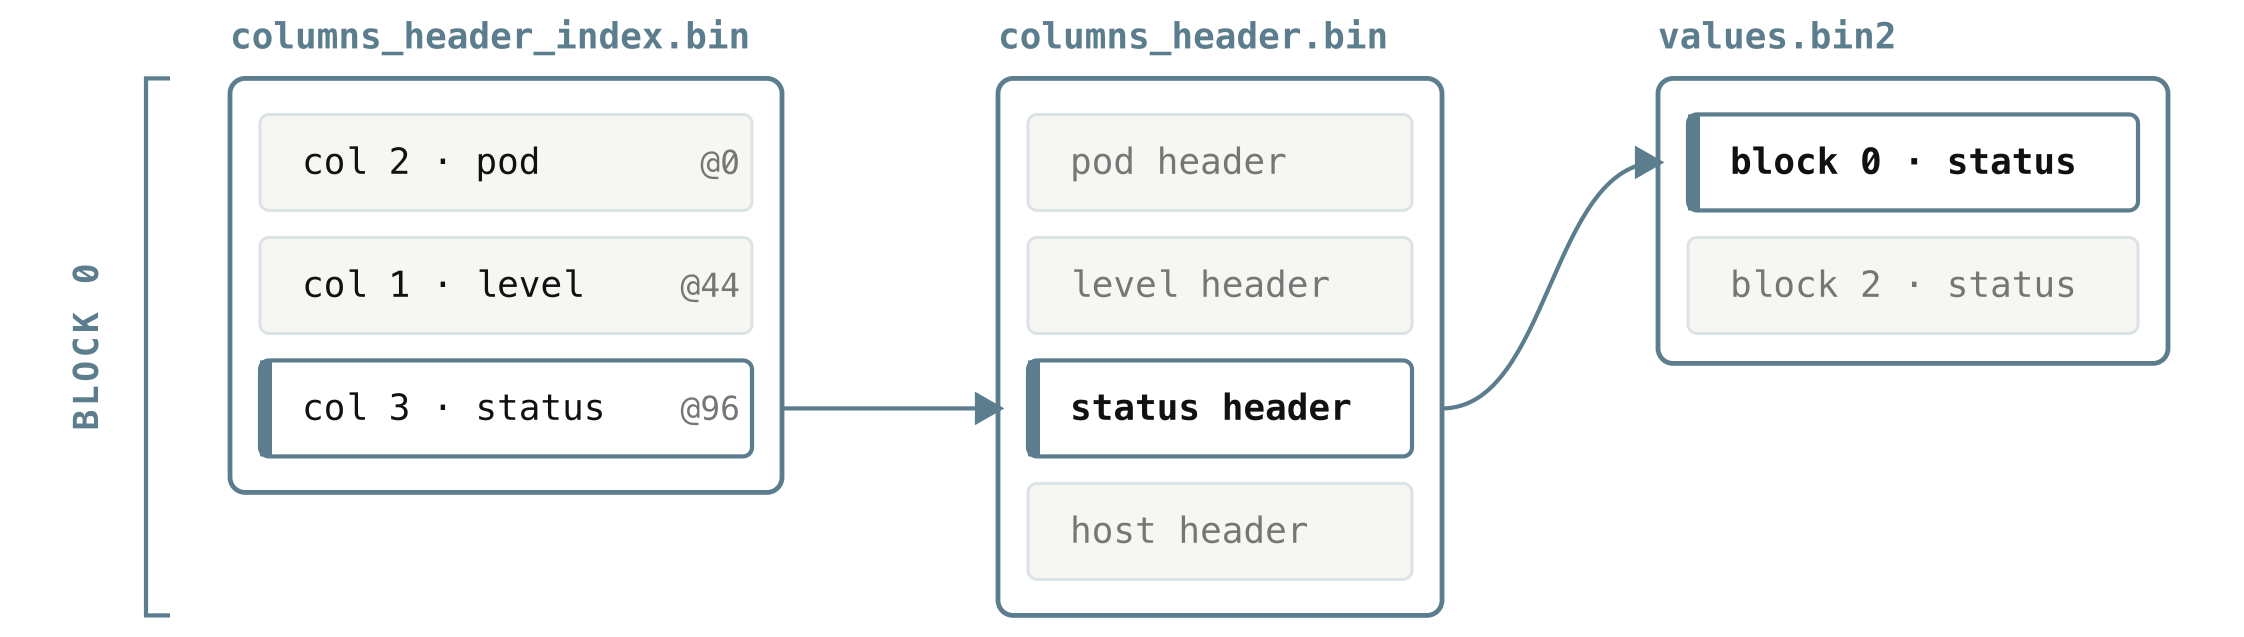
So reading status for one block follows a short, direct chain: look up status’s offset in that block’s entry of columns_header_index.bin, read just that one header from columns_header.bin, and follow its offset and size straight into values.bin2. The only thing left unexplained is how VictoriaLogs knows where a given block’s header blob lives in the first place, and that is the last file.
5.8 index.bin and metaindex.bin: the index that finds blocks
#
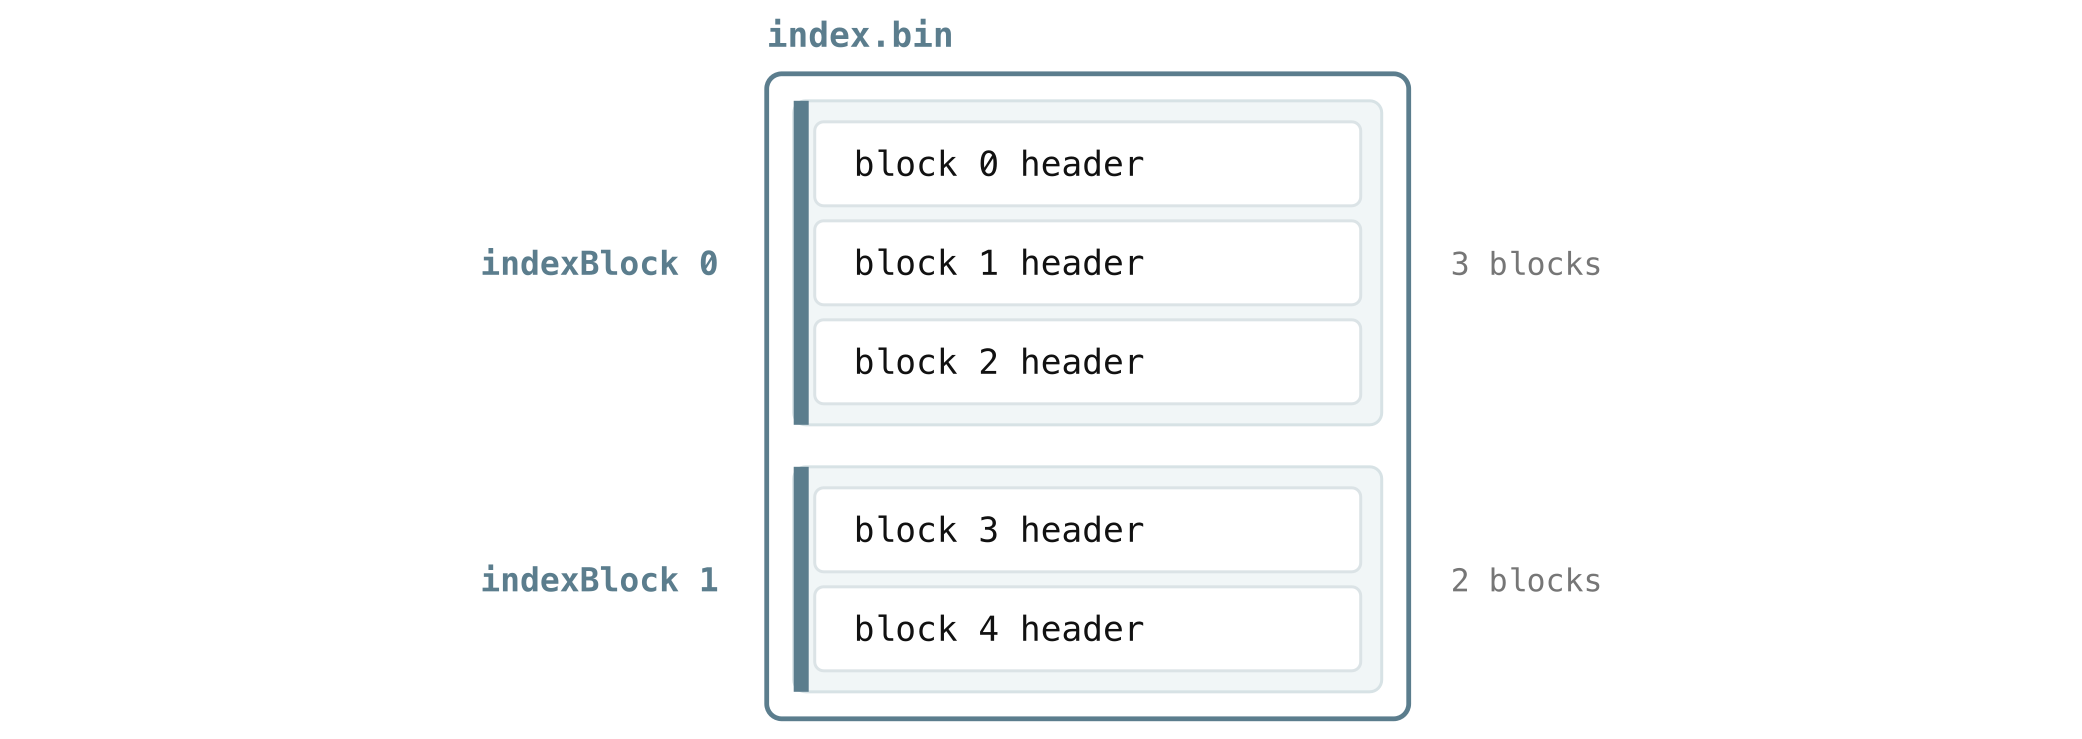
Everything above assumes VictoriaLogs already knows which blocks it cares about. The index is what gets it there. Recall from section 4.1 that every block has a small block header: its stream, time range, row count, and the links to where that block’s timestamps and column headers live.
index.bin is where all of a part’s block headers live, so there is one block header per block. They are grouped into chunks called index blocks:
And we are still not done. By now, you have probably noticed that VictoriaLogs, like the other VictoriaMetrics products, loves the same trick over and over: never scan something big when a smaller thing can point you to the right spot first.
The index blocks (index.bin) are no exception. Scanning every block header to find the few blocks that match your query would itself be slow on a large part with thousands of blocks, so there is one more layer, an index on top of the index, metaindex.bin.
metaindex.bin keeps one small record per index block, and each record stores the location of that index block in index.bin, along with a summary of the streams and time range it covers. The whole thing is small enough that VictoriaLogs keeps it in memory.
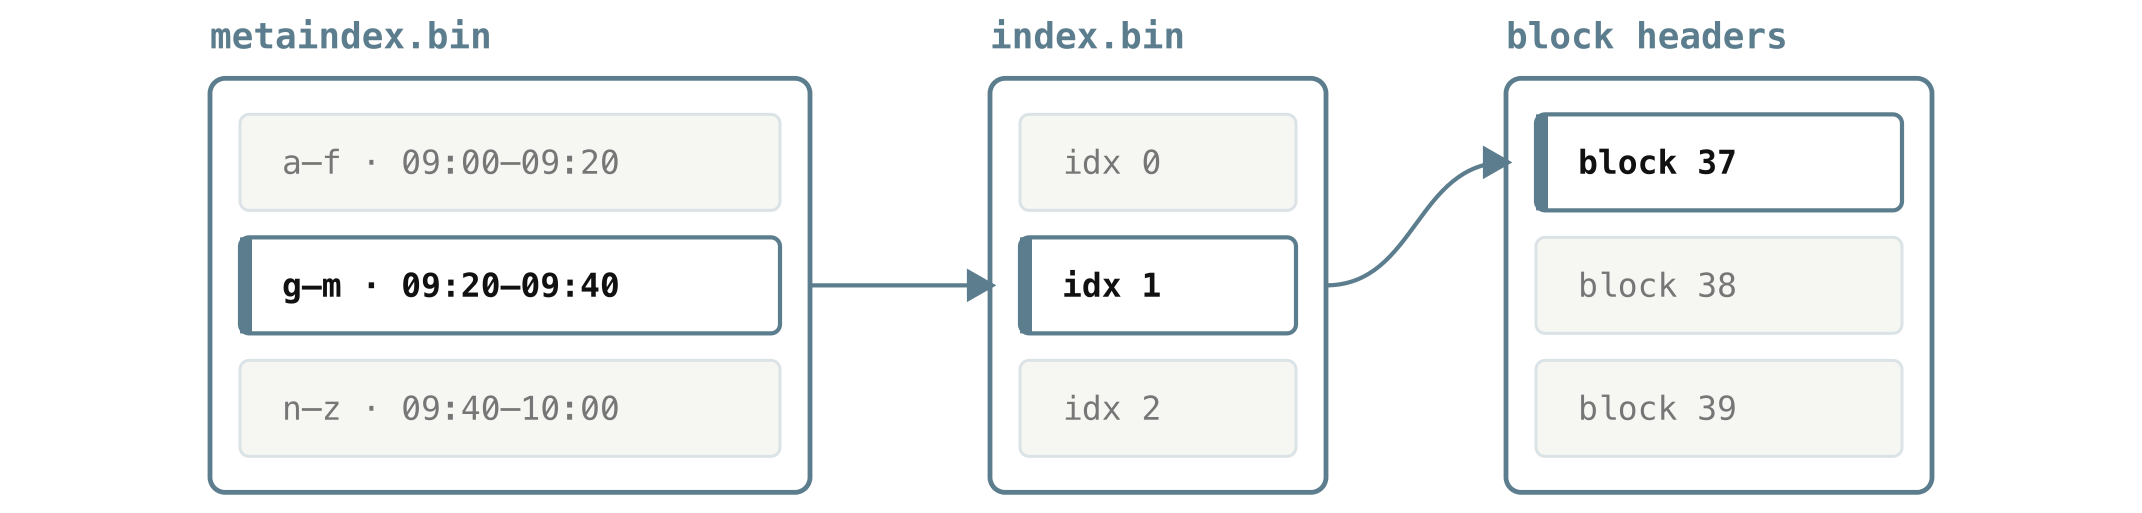
That two-level shape is what makes a query targeted from the very first read. VictoriaLogs scans the in-memory metaindex.bin, where each record is just a stream range, a time range, and a link into index.bin:
metaindex.bin
  streams   time range       index.bin offset   size
  a–f       09:00 – 09:20    0                  4096
  g–m       09:20 – 09:40    4096               4096
  n–z       09:40 – 10:00    8192               3072
From that, it keeps only the index blocks whose streams and time range can overlap the query, reads just those from index.bin to get the relevant block headers, and from each block header follows the links we have already met, into the timestamps, the bloom filters, and the column headers, down to the exact bytes it needs. Every file in the part exists to keep that path short.
What to remember
#
You can run VictoriaLogs well without any of the file-level detail above, but the mental model pays off when you are tuning or troubleshooting. Every file in a part exists for one reason: to read something small and skip something large, so a query only ever touches the bytes it truly needs.
- Logs are grouped into streams, then stored in daily partitions. Keep stream fields stable and low-cardinality.
- Retention deletes whole days, and queries only touch the days in your time range, so time-bounded queries are cheap.
- A day is made of immutable parts, and seeing several parts is normal.
- Queries are fast because VictoriaLogs skips work at every level: whole parts by time range, blocks by stream and time, columns by which fields you query, and keywords by bloom filter.
Leave a comment below or Contact Us if you have any questions!
comments powered by Disqus