- Blog /
- VictoriaLogs Basics: What You Need to Know, with Examples & Visuals

VictoriaLogs Basics: What You Need to Know, with Examples & Visuals
Share:


This post covers ~80% of VictoriaLogs concepts and features people ask about most often. For deeper details and full references, see the official VictoriaLogs documentation.
Part of a series:
- VictoriaLogs Practical Ingestion Guide for Message, Time and Streams
- VictoriaLogs Basics: What You Need to Know, with Examples & Visuals
What is VictoriaLogs?
#
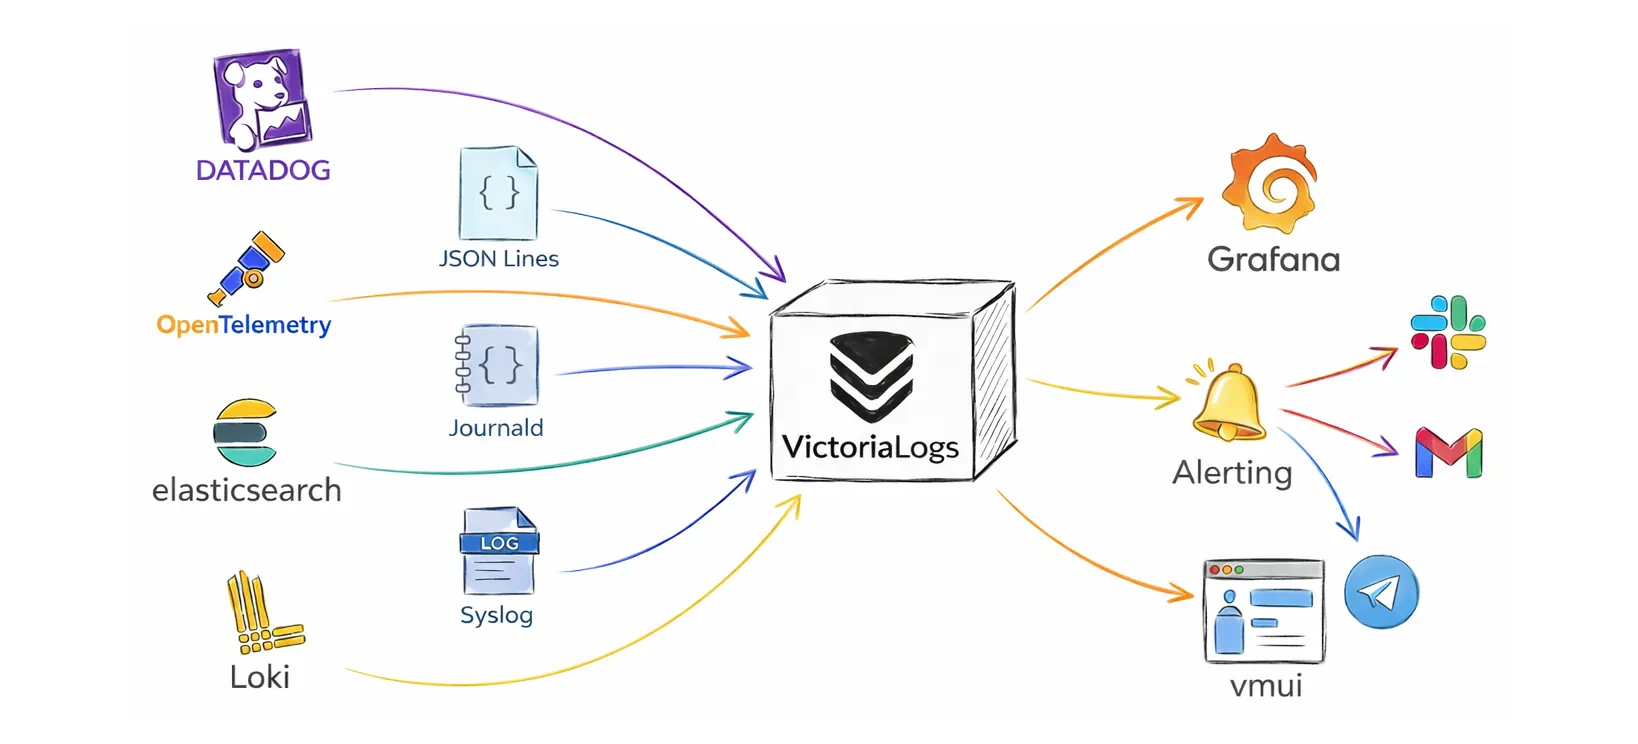
VictoriaLogs is a resource-efficient, fast, lightweight, schemaless, zero-config (single-binary) log database. You can deploy it immediately to:
- accept logs from many sources and formats (Elasticsearch Bulk API, Loki, OpenTelemetry, Datadog, JSON Lines (
jsonline), Journald, Syslog, …) - store logs on disk in compressed form and apply retention so old data is removed automatically
- query and investigate logs in the built-in web UI (
vmui) at/select/vmui/without extra setup - connect to Grafana for dashboards and visual exploration
- integrate with alerting via
vmalert(typically with Alertmanager for Slack, email, and other notification channels)
Single-node vs Cluster
#
You can deploy VictoriaLogs via pre-built binaries or via the Helm chart on Kubernetes. This default deployment mode is usually called single-node VictoriaLogs.
A single-node instance scales vertically with the available resources (CPU, RAM, disk I/O, disk space). It can run on servers with hundreds of CPU cores and, depending on the workload and hardware, can ingest terabytes of logs per day.
If a single-node VictoriaLogs reaches scalability limits (most often disk I/O or disk space), you can scale further by switching to the cluster deployment. Cluster mode enables horizontal scaling by splitting the system into three roles: insert (vlinsert), query (vlselect), and storage (vlstorage):
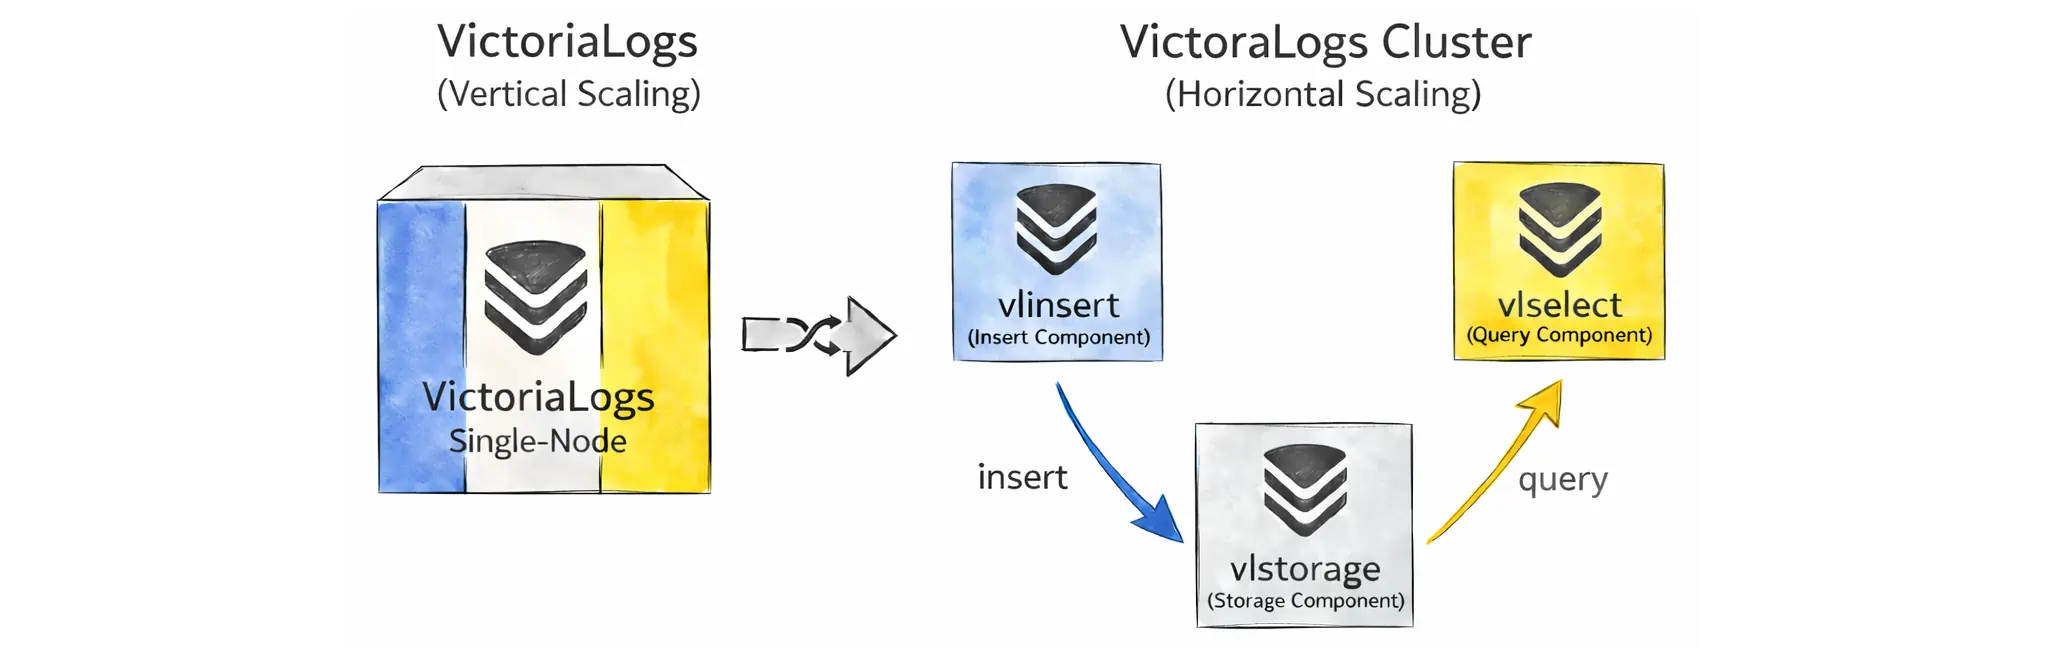
This way, you can scale out with more nodes and use disk I/O in parallel. These components can also scale independently.
It helps to clear up a common question: do you need cluster mode for replication and high availability?
Not necessarily. VictoriaLogs cluster mode doesn’t automatically replicate data between vlstorage nodes. This is different from VictoriaMetrics in cluster mode (our metrics solution), where storage-node replication is built in. VictoriaLogs takes a different approach:
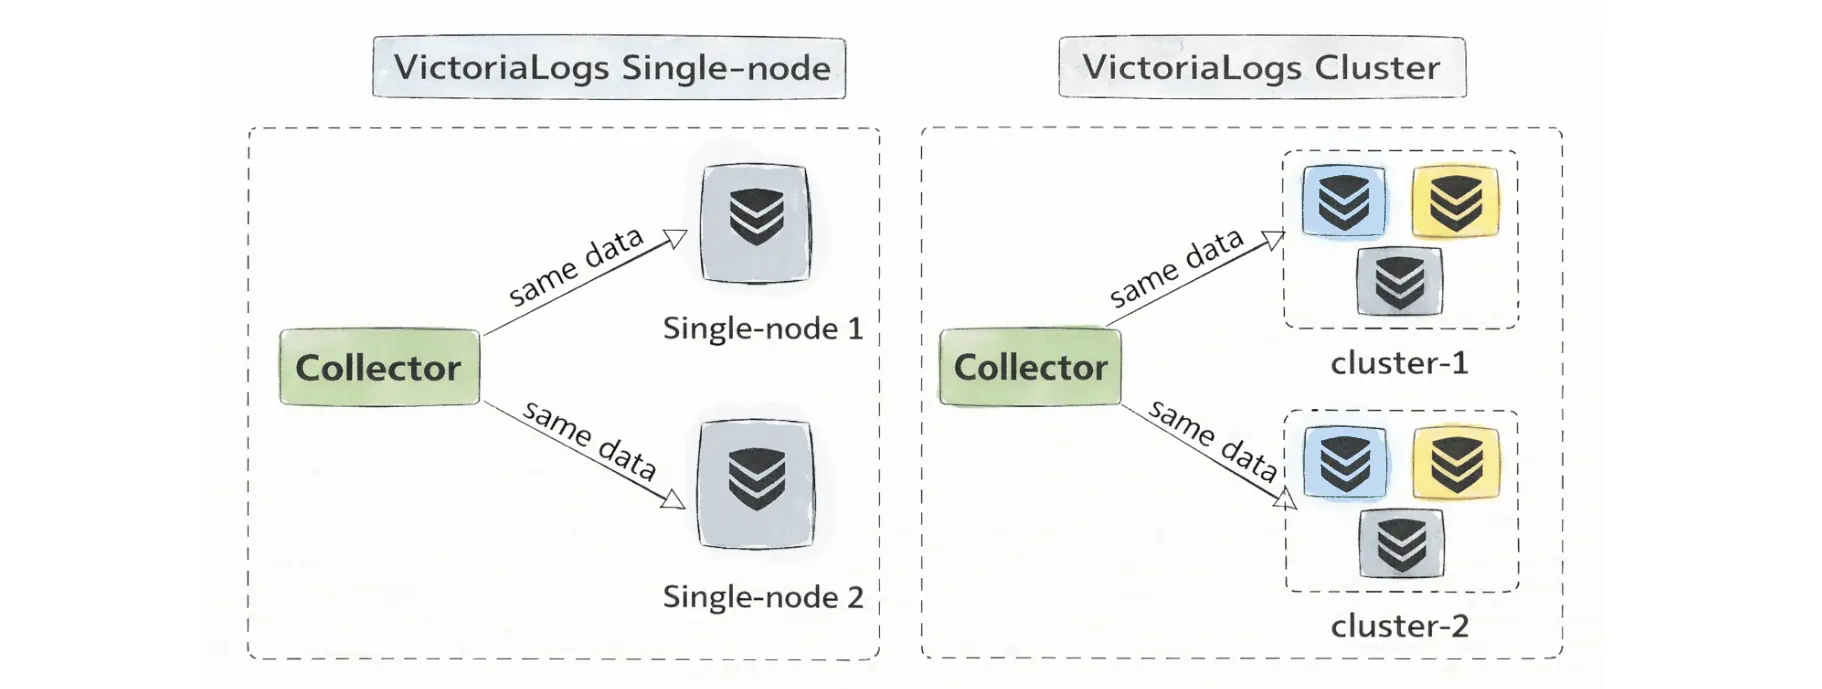
Instead of replicating between storage nodes, VictoriaLogs typically achieves high availability by replicating at the ingestion layer (for example with vlagent) and sending the same logs to multiple independent VictoriaLogs targets—either multiple single-node instances or multiple separate clusters.
Finally, a convenient detail is that all these components (both single-node and cluster mode) are roles in the same executable (victoria-logs):
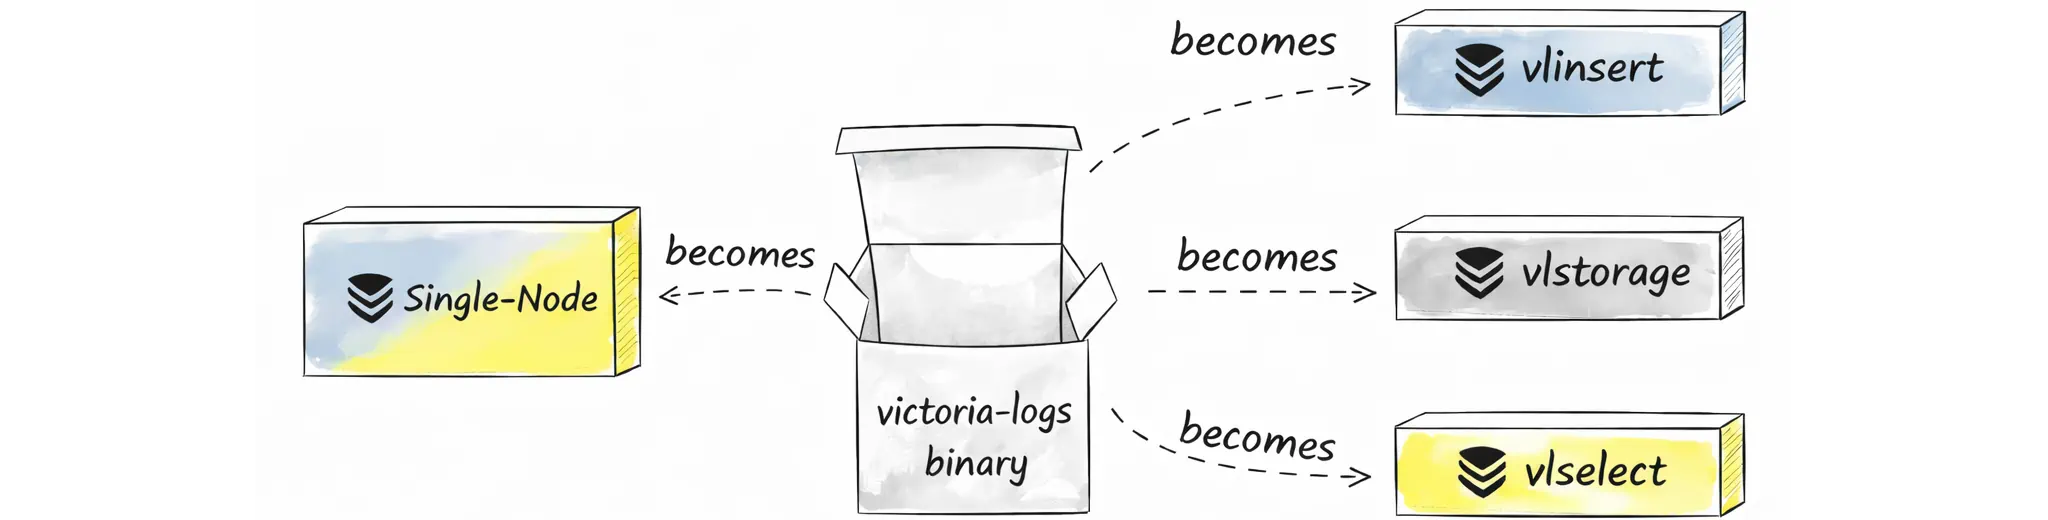
Because it’s the same binary under the hood, the core functionality is shared too. Let’s start with the single-node setup before diving into cluster mode.
VictoriaLogs single-node dashboard is available here
Retention
#
VictoriaLogs works out of the box with sane defaults, so you can start it without any required flags. For production, we strongly recommend reviewing and explicitly setting the flags that control disk usage for your workload.
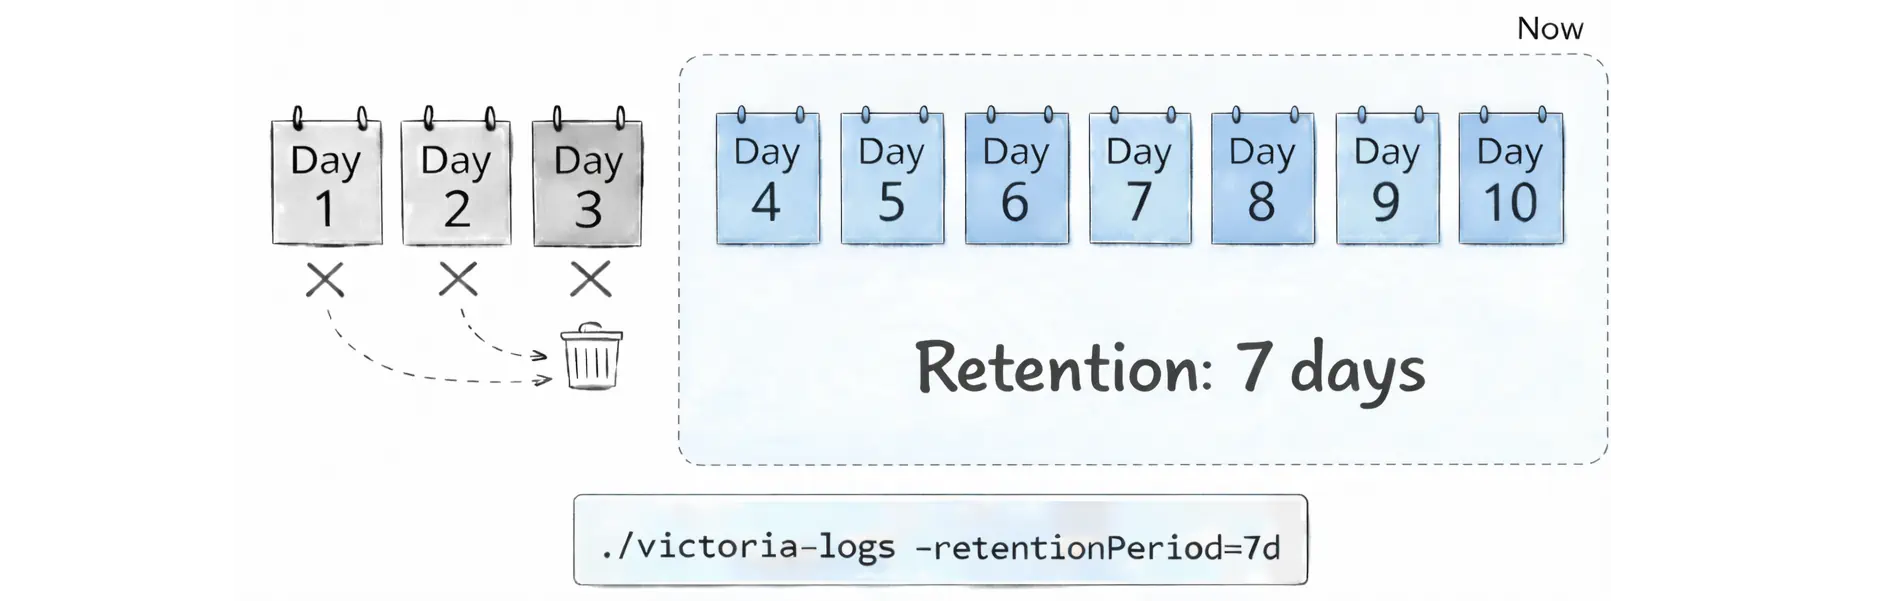
Time-based retention is controlled with the -retentionPeriod flag. By default, VictoriaLogs keeps 7 days of data (the minimum supported value is 1d). You can change it with this flag:
./victoria-logs -retentionPeriod=10d
Under the hood, VictoriaLogs stores data in daily partitions. Each daily partition contains logs for a single calendar day in the UTC time zone (for example, logs from 2025‑12‑12 in UTC). If you are not in UTC, a local calendar day may be split across two UTC daily partitions.
When retention kicks in, VictoriaLogs removes old data by dropping whole partitions (not individual log entries). In practical terms, it deletes the oldest daily partitions/directories first. This is usually faster and more predictable than trying to delete individual log lines scattered across many files:
If you want a simple safety net to prevent logs from growing forever, use disk-based retention. Pick exactly one of these flags:
-retention.maxDiskSpaceUsageBytes: cap storage by an absolute size (for example,100GiB)-retention.maxDiskUsagePercent: cap storage by a percent of the disk (for example,80)
When the configured limit is reached, VictoriaLogs automatically deletes the oldest data first.
# Disk-based retention (absolute limit: 100GiB)
./victoria-logs -retention.maxDiskSpaceUsageBytes=100GiB

# Disk-based retention (percent limit: 80%)
./victoria-logs -retention.maxDiskUsagePercent=80
You can safely combine time-based retention (-retentionPeriod) and disk-based retention (-retention.maxDisk*). They are checked separately, so either one can delete old partitions.
- Time-based retention deletes logs older than
-retentionPeriodeven if the disk usage is below the-retention.maxDisk*limit. - Disk-based retention can delete the oldest partitions earlier when the disk usage goes above the configured limit.
Note that the two disk-based limits are mutually exclusive. You can set -retention.maxDiskSpaceUsageBytes or -retention.maxDiskUsagePercent, but you cannot set both at the same time.
Query Language
#
VictoriaLogs automatically indexes all fields found in your logs. This means you can search and filter by any key/value pair you ingest, without planning a schema up front or manually creating indexes, even if different log lines contain different sets of fields.
Query
#
LogsQL is the query language you use to search, filter, and aggregate logs in VictoriaLogs. You can try it immediately in the built-in web UI at http://<victoria-logs>:9428/select/vmui/.
Try querying at VictoriaLogs Playground without deploying.
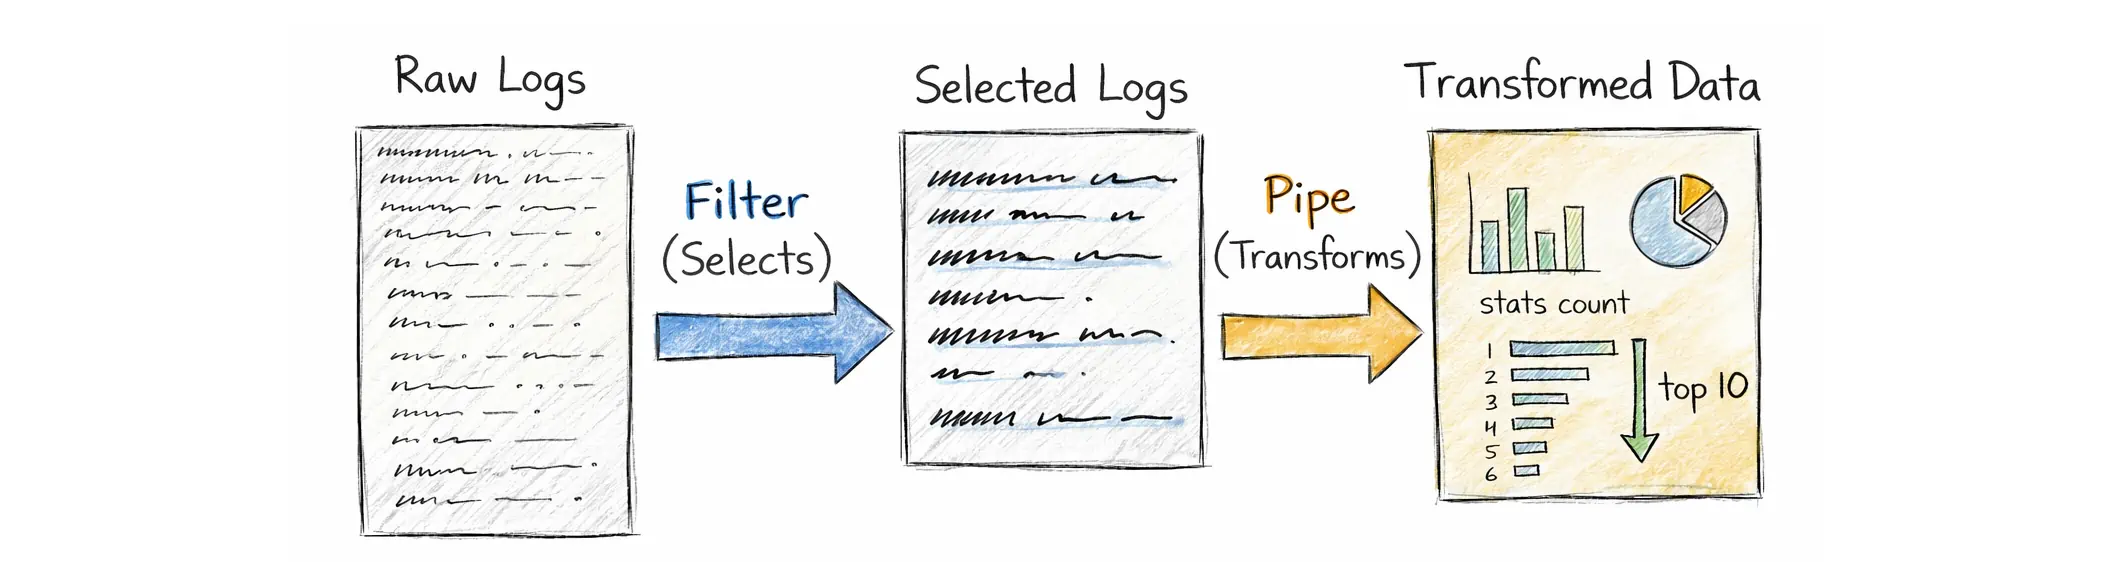
Each query has two parts: a mandatory filter and optional pipes:
- Filters describe what logs to select.
- Pipes describe what to do with those logs once they are selected.
A LogsQL query always starts with at least one filter. A filter can be:
- a free-text search term (searches in the log message,
_msg) - a structured condition on a field, such as
status_code:~"5.."orservice:="checkout" - a time filter, such as
_time:5mfor the last 5 minutes - a stream filter, such as
{app="api"}(equivalent to_stream:{app="api"}), which uses an optimized stream index

You can combine filters with AND, OR, and NOT. In most cases, AND is optional, so you can write _time:5m level:="error" instead of _time:5m AND level:="error".
After the filters have narrowed down the relevant log entries, pipes let you transform and aggregate them. Pipes are chained with the | symbol and executed left‑to‑right, a bit like Unix pipelines.
In the example above, the part after | is the stats pipe. This pipe is used for analytics and aggregations. For convenience, LogsQL also provides shortcuts for common stats queries. For example, these are equivalent:
_time:5m level:="error" | stats count()
_time:5m level:="error" | count()
VictoriaLogs has a lot of filters and pipes, so many that even contributors don’t remember them all. That’s because they’re meant to cover a wide range of needs, from simple log lookup to more complex analysis, and include tools for troubleshooting and understanding how a query behaves and performs. You can find all of these filters and pipes in the LogsQL documentation.
Here are some practical examples that show the typical workflow in LogsQL: first, narrow down the logs you care about, then summarize them with stats, and finally post-process the results (for example, compute a ratio or filter the output).
Let’s keep this section high-level. The goal here is to introduce LogsQL. We will cover the details in a follow-up article.
This query answers a simple question: which payment methods are failing too often (more than 2% failed)?
event:="payment"
  | stats by (payment_method)
      count() as total,
      count() if (status:="failed") as failed
  | math failed * 100 / total as fail_pct
  | fail_pct:> 2
The output includes the total number of payment events, the number of failed events, and the calculated failure percentage. The last line keeps only rows above 2%.
This query helps you spot likely brute-force or credential-stuffing attempts by finding (user_id, ip) pairs with more than 5 failed logins:
event:="login" status:="failed"
  | stats by (user_id, ip)
      count() as failed_logins
  | failed_logins:> 5
This query is useful for security audits: who granted admin or superuser, to whom, and how many times:
event:="role_changed" new_role:in("admin", "superuser")
  | stats by (actor, target_user, new_role) count() as changes
This query finds services with a high error rate. It counts total logs and error logs per service, converts that into a percentage, and then keeps only services above 5%:
* | stats by (service)
    count() as total,
    count() if (log_level:="error") as errors
  | math errors * 100 / total as error_rate_pct
  | error_rate_pct:> 5
The query below shows services with slow requests by computing p95 request latency per service:
* | stats by (service)
    quantile(0.95, request_duration_ms) as p95
  | p95:> 2000
Some fields can have a large number of unique values across log entries. This is called high cardinality. For example, trace_id is often unique per request, and user_id and ip can have many different values in real systems.
Fortunately, VictoriaLogs handles high-cardinality field values very well, so it is practical to keep these fields in your logs. This sounds simple, but it gives you a big advantage. You can start from a chart or an alert that shows something is wrong (for example, payment failures increasing), then use the same data to figure out exactly what is happening. You can see which payment method is affected, which users are impacted, which IPs are involved, and which traces tell the full story end-to-end.
You do not need to redesign your schema or add special indexing rules later. You just query the fields you already have because VictoriaLogs indexes all the fields.
Stream fields and cardinality
The key rule is not to use high-cardinality fields as stream fields. Stream fields should stay stable for a given source, such as a host, instance, pod, or container. If you put trace_id, user_id, or ip into stream fields, VictoriaLogs may create too many streams, which increases resource usage during ingestion and querying.
Visualization
#
Many queries (especially ones ending in | stats ...) return a small table of numbers, which is great for quick checks.
For example, this query returns a single number: how many error logs appeared in the last 5 minutes:
> _time:5m level:="error" | stats count()

{"count(*)":"2090695"}
If you want to see how this changes over time, you can group the result into time buckets. The query below looks at the last hour and returns one point per 5‑minute bucket:
> _time:1h level:="error" | stats by (_time:5m) count()

{"_time":"2025-12-20T14:50:00Z","count(*)":"284"}
{"_time":"2025-12-20T14:45:00Z","count(*)":"3361"}
{"_time":"2025-12-20T14:40:00Z","count(*)":"3270"}
{"_time":"2025-12-20T14:35:00Z","count(*)":"3099"}
{"_time":"2025-12-20T14:30:00Z","count(*)":"3007"}
{"_time":"2025-12-20T14:25:00Z","count(*)":"3220"}
{"_time":"2025-12-20T14:20:00Z","count(*)":"3369"}
{"_time":"2025-12-20T14:15:00Z","count(*)":"3094"}
{"_time":"2025-12-20T14:10:00Z","count(*)":"3115"}
{"_time":"2025-12-20T14:05:00Z","count(*)":"3265"}
{"_time":"2025-12-20T14:00:00Z","count(*)":"3256"}
{"_time":"2025-12-20T13:55:00Z","count(*)":"3275"}
{"_time":"2025-12-20T13:50:00Z","count(*)":"2753"}
If you run these queries via the HTTP endpoint /select/logsql/query, the response is streamed as JSON lines (one JSON object per row). This format is easy to inspect, and it’s actually what vmui uses behind the scenes when you run a query.
However, Grafana panels work better with the dedicated Prometheus-compatible stats APIs:
- Instant stats (
/select/logsql/stats_query): returns a snapshot at evaluation time, similar to a Prometheus instant query.vmalertuses this for most normal alerting, because each evaluation only needs to know if it is above the threshold right now. - Range stats (
/select/logsql/stats_query_range): returns time-series data with astep, similar to a Prometheus range query.vmalertneeds this for cases like replay/backfill, or when a rule needs a sequence of points.
To visualize LogsQL in Grafana (Time series, Stat, Table, etc.), add the VictoriaLogs datasource in Grafana datasource provisioning configuration:
- name: VictoriaLogs
  type: victoriametrics-logs-datasource
  access: proxy
  url: http://victorialogs:9428
Point url to your VictoriaLogs query endpoint. In some setups, Grafana talks to VictoriaLogs through a proxy such as vmauth.
Grafana uses the same LogsQL expressions, including the stats pipe and its shortcuts (such as | count()). For Range queries, Grafana passes a step (bucket size), and VictoriaLogs automatically groups the stats by that step, so you usually do not need to write by (_time:5m) yourself.
For example, you can use level:="error" | count() and select the Range query type:
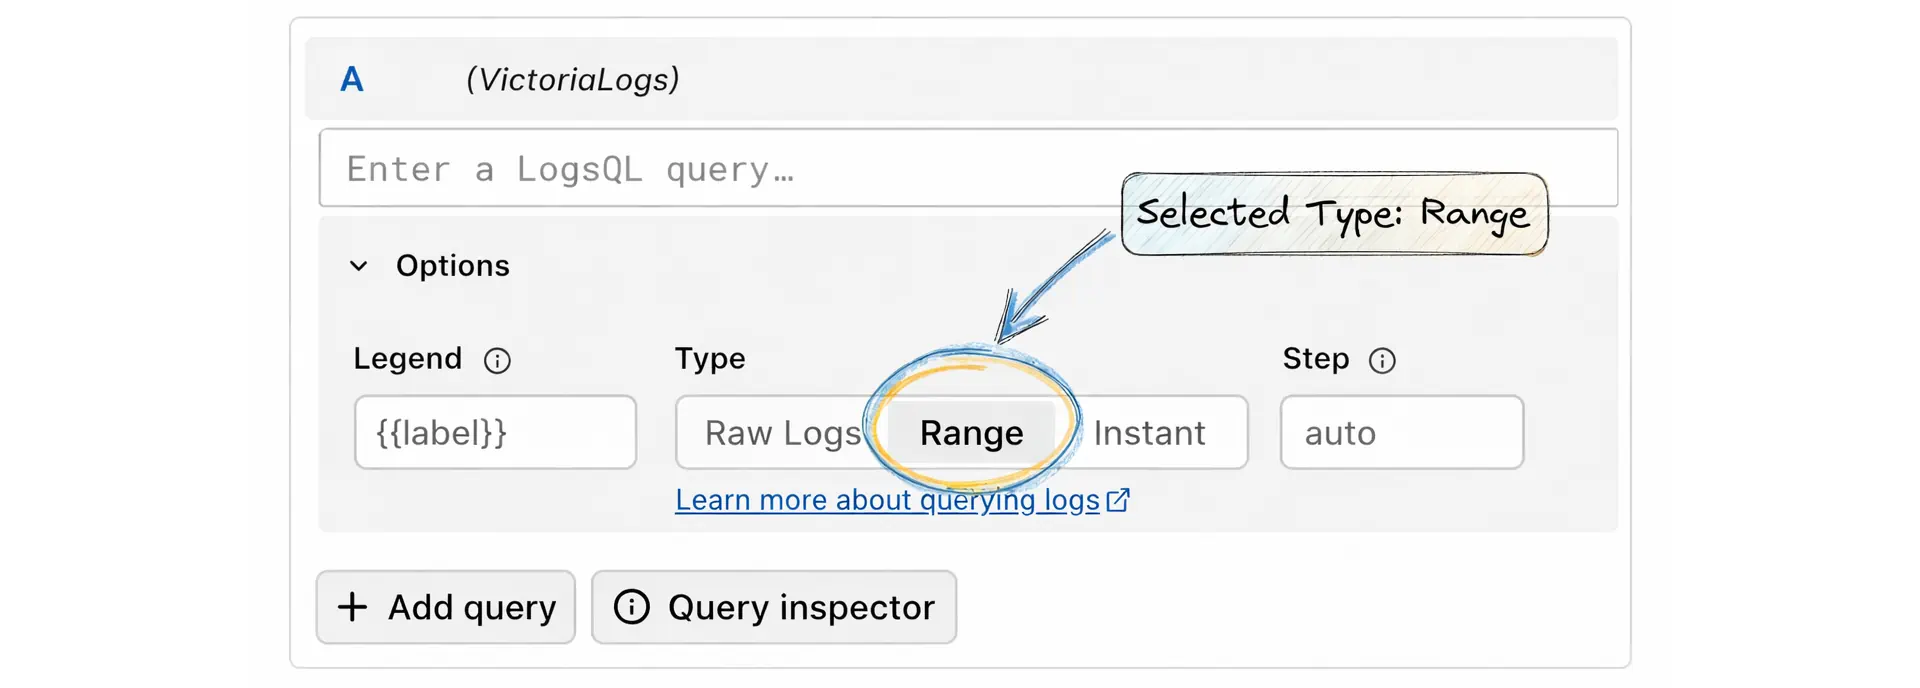
If you’ve used metrics before, instant query and range query will feel familiar. These options mean:
- Raw Logs: shows matching log lines (useful in Logs view or tables).
- Range: runs the query over a time window and returns multiple points using a
step(good for Time series panels). - Instant: runs the query at a single moment (good for Stat panels).
Besides using charts for business metrics, you can also visualize VictoriaLogs internal state using LogsQL queries against the data already stored in VictoriaLogs.
For example, you can track how many logs you have, how old the newest log is, how many streams are active, which fields are the most expensive, and which streams (for example, pods or containers if they are part of _stream) are the biggest disk users:
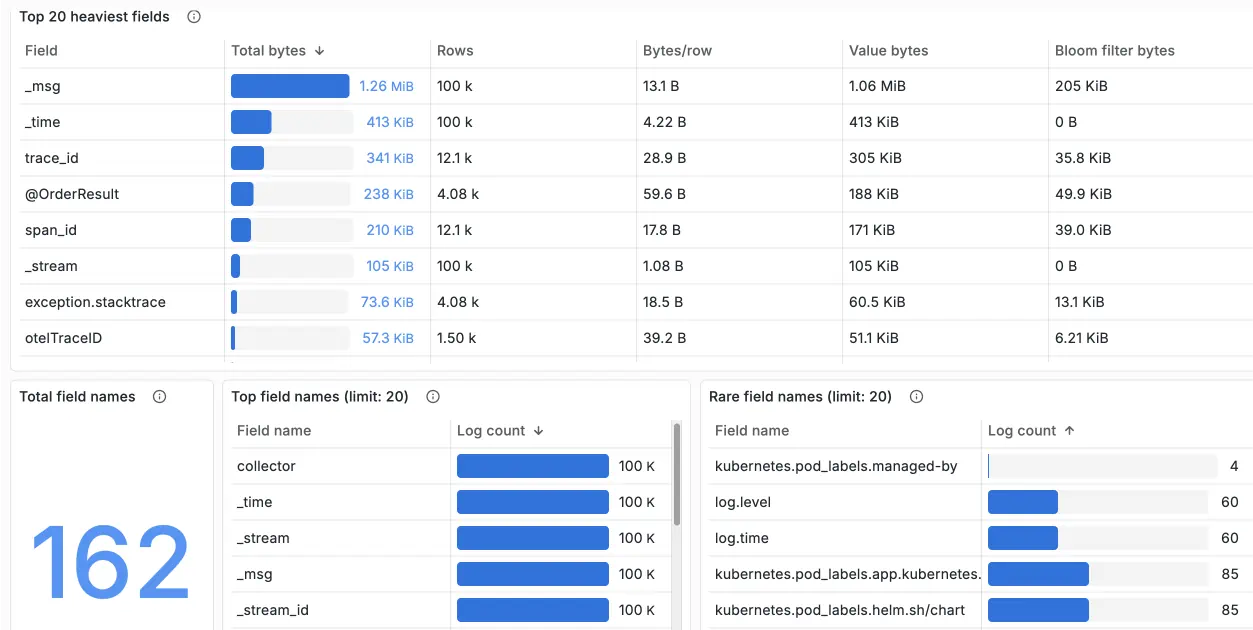
These insights are available out of the box in the official Grafana dashboard maintained by the VictoriaLogs team.
Now, after running queries to investigate and using charts/dashboards to analyze, we’re still missing the final piece: alerting.
Alerting
#
Alerting Rule
#
VictoriaLogs supports alerting, but it isn’t an alert engine in the sense that it doesn’t run rules by itself, keep alert state, or send notifications.
When we say VictoriaLogs supports alerting, we mean it provides APIs that turn logs into numbers (stats), and these APIs return results in a format close enough to the Prometheus Query API that an alert engine like vmalert can use them directly.
In other words: VictoriaLogs is the datasource for alerting, while vmalert is the rule runner.
A typical alerts-from-logs stack with VictoriaLogs has three layers:
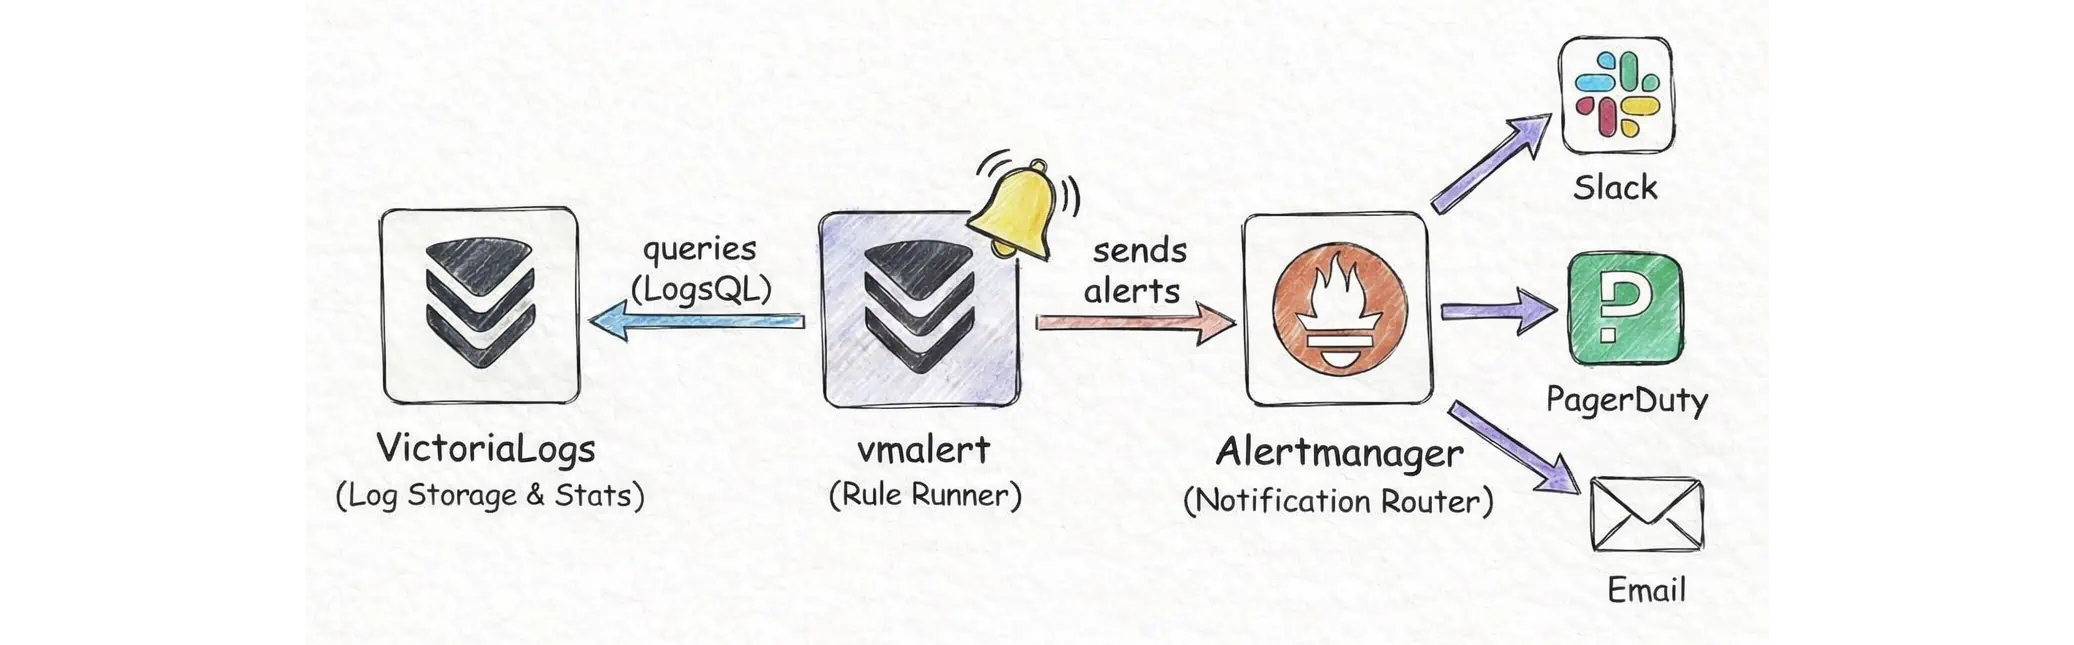
- VictoriaLogs (VL): stores logs and computes stats over logs using LogsQL.
vmalert: reads rule YAML files, periodically executes the queries in those rules, decides whether an alert is firing, and decides where to write recording rule results.- Alertmanager: receives notifications from
vmalertand routes them to Slack, email, PagerDuty, etc. according to its config.
In a vmalert rules file, you can set type: vlogs. This tells vmalert that expr is LogsQL in the stats-query style, so the query must include | stats ... (or its shortcuts) to produce numeric output:
groups:
  - name: vlogs
    type: vlogs
    interval: 1m
    rules:
      - alert: HasErrorLogs
        expr: |
          error
            | stats by (service) count() as errors
            | filter errors:>0
        for: 2m
        annotations:
          description: >
            Service {{$labels.service}} had {{$value}} error logs in the last 5 minutes.
This rule checks whether the word error appears in logs during the last 5 minutes, grouped by service. vmalert evaluates it every minute (interval: 1m). If the condition stays true for 2 minutes (for: 2m), it fires and sends a notification with the current error count for each affected service (assuming your logs contain a service field).
After you save the rules to a file, run vmalert and point it at VictoriaLogs and Alertmanager:
./bin/vmalert \
  -rule=alert.rules \
  -datasource.url=http://victorialogs:9428 \
  -notifier.url=http://alertmanager:9093
How to think about it:
- You don’t alert directly on individual log lines.
- You alert on aggregated results such as “count error logs in 1 minute”, “5xx ratio over total requests”, “top paths with the most errors”, “p99 latency computed from a field in the logs”.
- Because an alert engine compares numbers (>, <, rate…), the query must produce numeric values such as
count(),sum(),rate(),quantile()insidestats.
Under the hood, vmalert sends an HTTP request to the instant stats API (/select/logsql/stats_query), which we already explained in the Grafana visualization section. The response can be thought of as:
{
  "status":"success",
  "data":{
    "resultType":"vector",
    "result":[
      {"metric":{"__name__":"errors","service":"checkout"},"value":[1736183100,"12"]},
      {"metric":{"__name__":"errors","service":"payments"},"value":[1736183100,"3"]}
    ]
  }
}
In a more human-readable format, it looks like:
2026-01-06T17:05:00Z errors{service="checkout"} 12
2026-01-06T17:05:00Z errors{service="payments"} 3
Alerting from logs always has to answer: “count logs over what time window?”
If you write _time:5m in the expr, you explicitly choose the time window. If your expr doesn’t clearly define a time window, vmalert automatically applies one based on the group interval (it evaluates the query over the last interval of logs).
For example, if the group interval is 1m, then on each evaluation vmalert runs the query for the last 1 minute of logs.
However, you still need VictoriaMetrics (or any other metrics backend) to make your alerting system “perfect”.
When an alert uses for: ..., it means “do not fire immediately”. It means the condition must stay true for the whole for duration. To do that, vmalert must remember when the alert first entered the pending state.
If vmalert restarts, this timer is lost unless it is stored somewhere, so the pending time starts again from zero. This can delay alerts and make them behave differently than you expect. This is where a metrics backend helps:
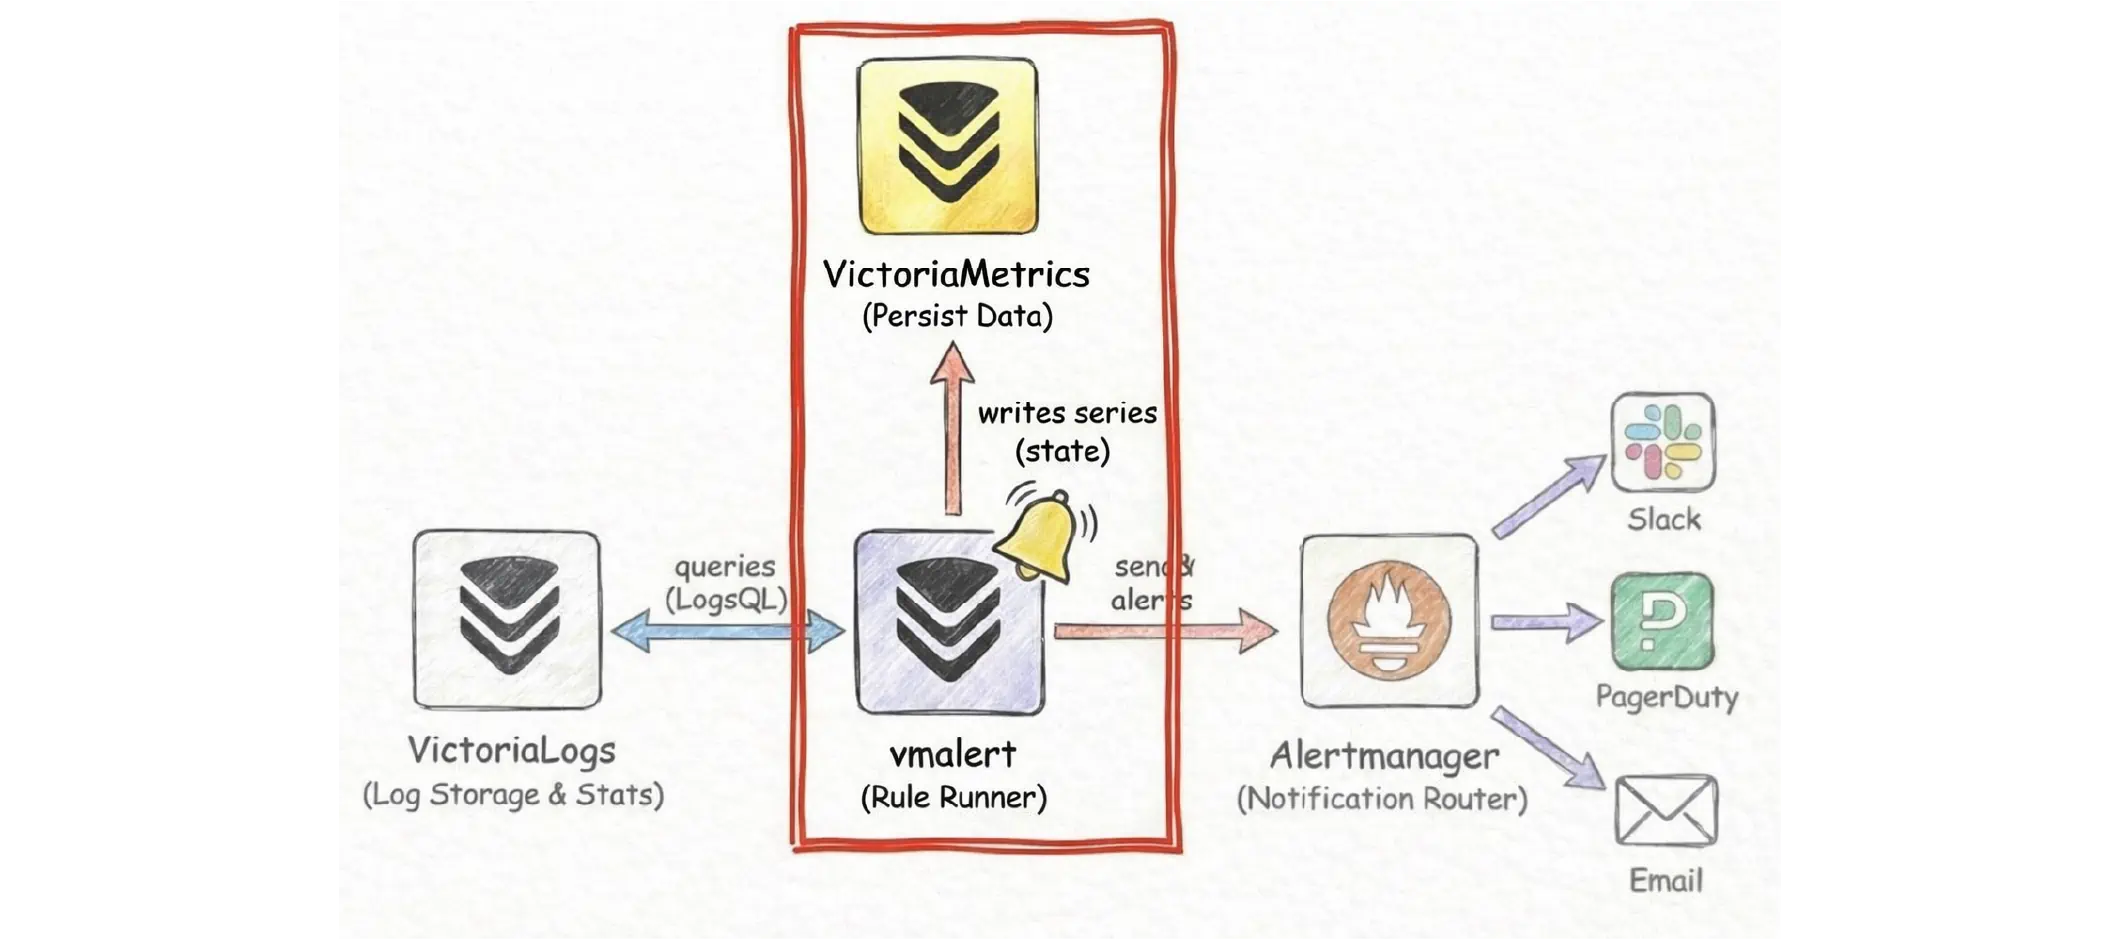
With a metrics backend in place, vmalert persists this state by writing two built-in time series:
ALERTS, which shows the current alert state (pending or firing).ALERTS_FOR_STATE, which stores the Unix timestamp when the alert became active, sovmalertcan restore thefortimer after a restart.
Question!
If VictoriaLogs helps you see both the big picture with charts and trends, and the details by drilling down to individual users and log lines, when would you use VictoriaMetrics instead of VictoriaLogs?
VictoriaLogs charting is great for turning logs into numbers and then looking up the matching log lines when you need details. But VictoriaLogs is not a metrics database. VictoriaMetrics is built specifically for storing time series efficiently and querying them quickly over long time ranges. It is also where vmalert can store and restore alert state, including for timers.
A common setup is to use LogsQL on VictoriaLogs to compute the indicators you care about, then use recording rules (next section) in vmalert to write those results as time series to VictoriaMetrics.
After that, dashboards and alerts read the stored time series instead of scanning logs on every refresh, and vmalert can keep alerting behavior stable across restarts.
Recording Rule
#
A recording rule is a rule that vmalert runs on a schedule. It takes the numeric output of your query, turns it into a time series, and then sends these samples to a metrics backend (usually VictoriaMetrics via remote write).
Unlike an alerting rule, a recording rule does not create pending or firing states, and it does not send notifications. It only produces metric data that you can reuse in dashboards or as input for other alerts.
A recording rule always has a record name (record) and an expression (expr). You can also attach extra labels. The record name becomes the metric name that vmalert writes:
groups:
  - name: vlogs-recording
    type: vlogs
    interval: 1m
    rules:
      - record: vlogs:path_requests:count
        expr: '* | stats by (path) count() as total'
With the rule above, vmalert runs a LogsQL stats query once per minute to count logs per path. The result is written as a new metric named vlogs:path_requests:count. Each path becomes its own time series (path=...), and the value is the number of logs in that window.
For type: vlogs, vmalert also keeps the stats column name in a label called stats_result. In this example, it will be stats_result="total", since the query uses count() as total.
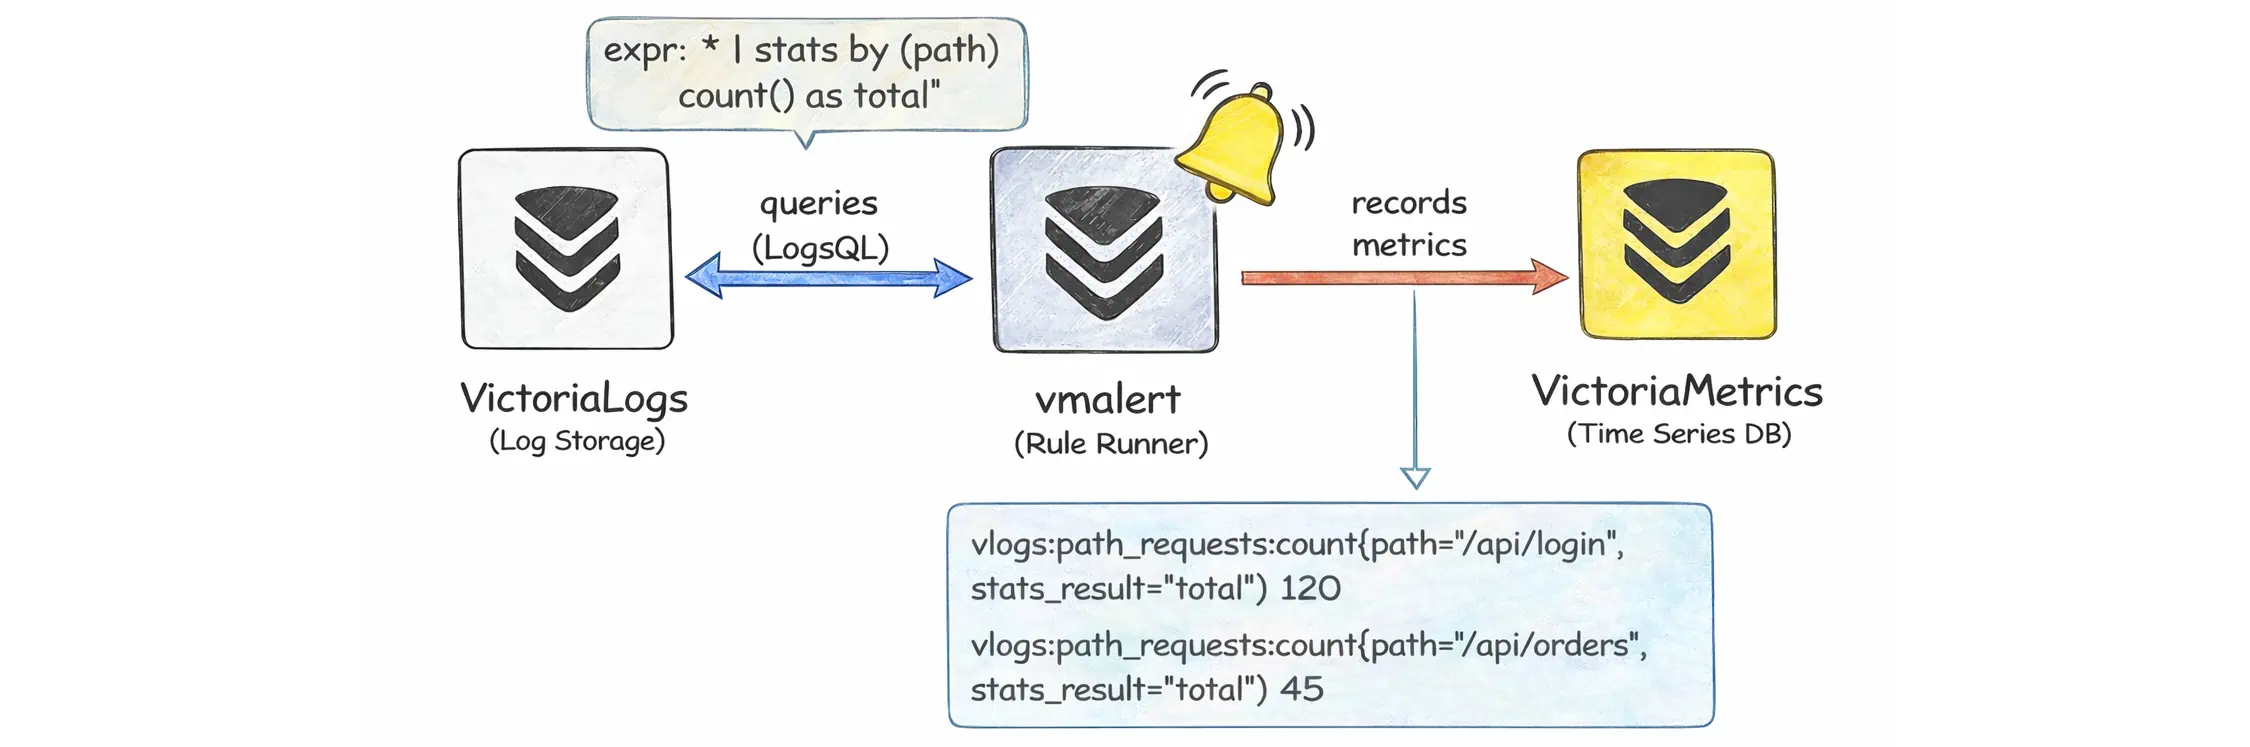
The result labels are preserved to distinguish the individual series. For example, if the query groups by path, then each path becomes a separate series of the new metric:
vlogs:path_requests:count{path="/api/login",stats_result="total"} 120
vlogs:path_requests:count{path="/api/orders",stats_result="total"} 45
On each run, vmalert calls the datasource to evaluate the expression at a specific timestamp. This timestamp isn’t necessarily “the current system time”, because vmalert may adjust for ingestion delay and round to the group interval to keep results stable.
One practical detail is that a single | stats ... query can return more than one number, for example count() together with multiple quantile() values. In that case you will get multiple time series for the same group, and stats_result helps you tell which value each series represents.
VictoriaLogs Cluster
#
In cluster mode, VictoriaLogs runs as three roles: insert (vlinsert), query (vlselect), and storage (vlstorage). You can deploy and scale these roles independently:
All of these roles are still the same victoria-logs binary. The difference is how you start it.
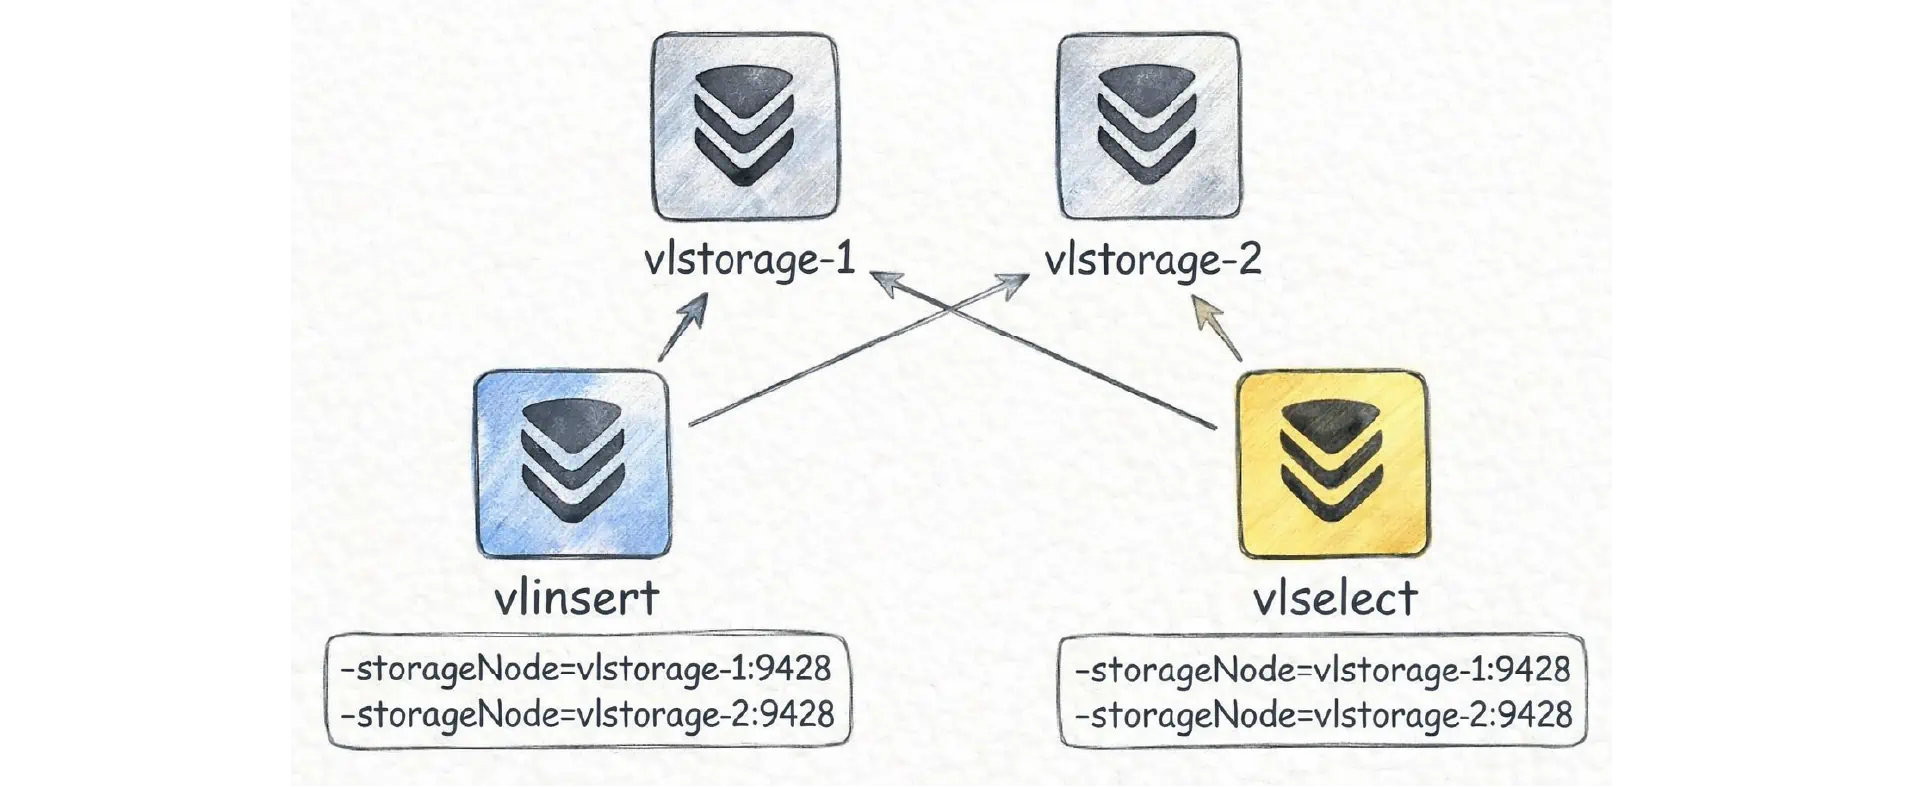
If you start an instance with -storageNode=..., it does not open local storage on local disk (-storageDataPath). Instead, it forwards writes and reads to the storage nodes you listed in -storageNode, so this instance behaves like the insert and query gateways.
This means that when you outgrow the single-node setup, you do not need to “migrate” to a different product. You can keep the existing single-node VictoriaLogs as vlstorage-1, deploy one more instance as vlstorage-2 (with its own -storageDataPath), and then start one or more gateway instances with -storageNode pointing to both storage nodes:
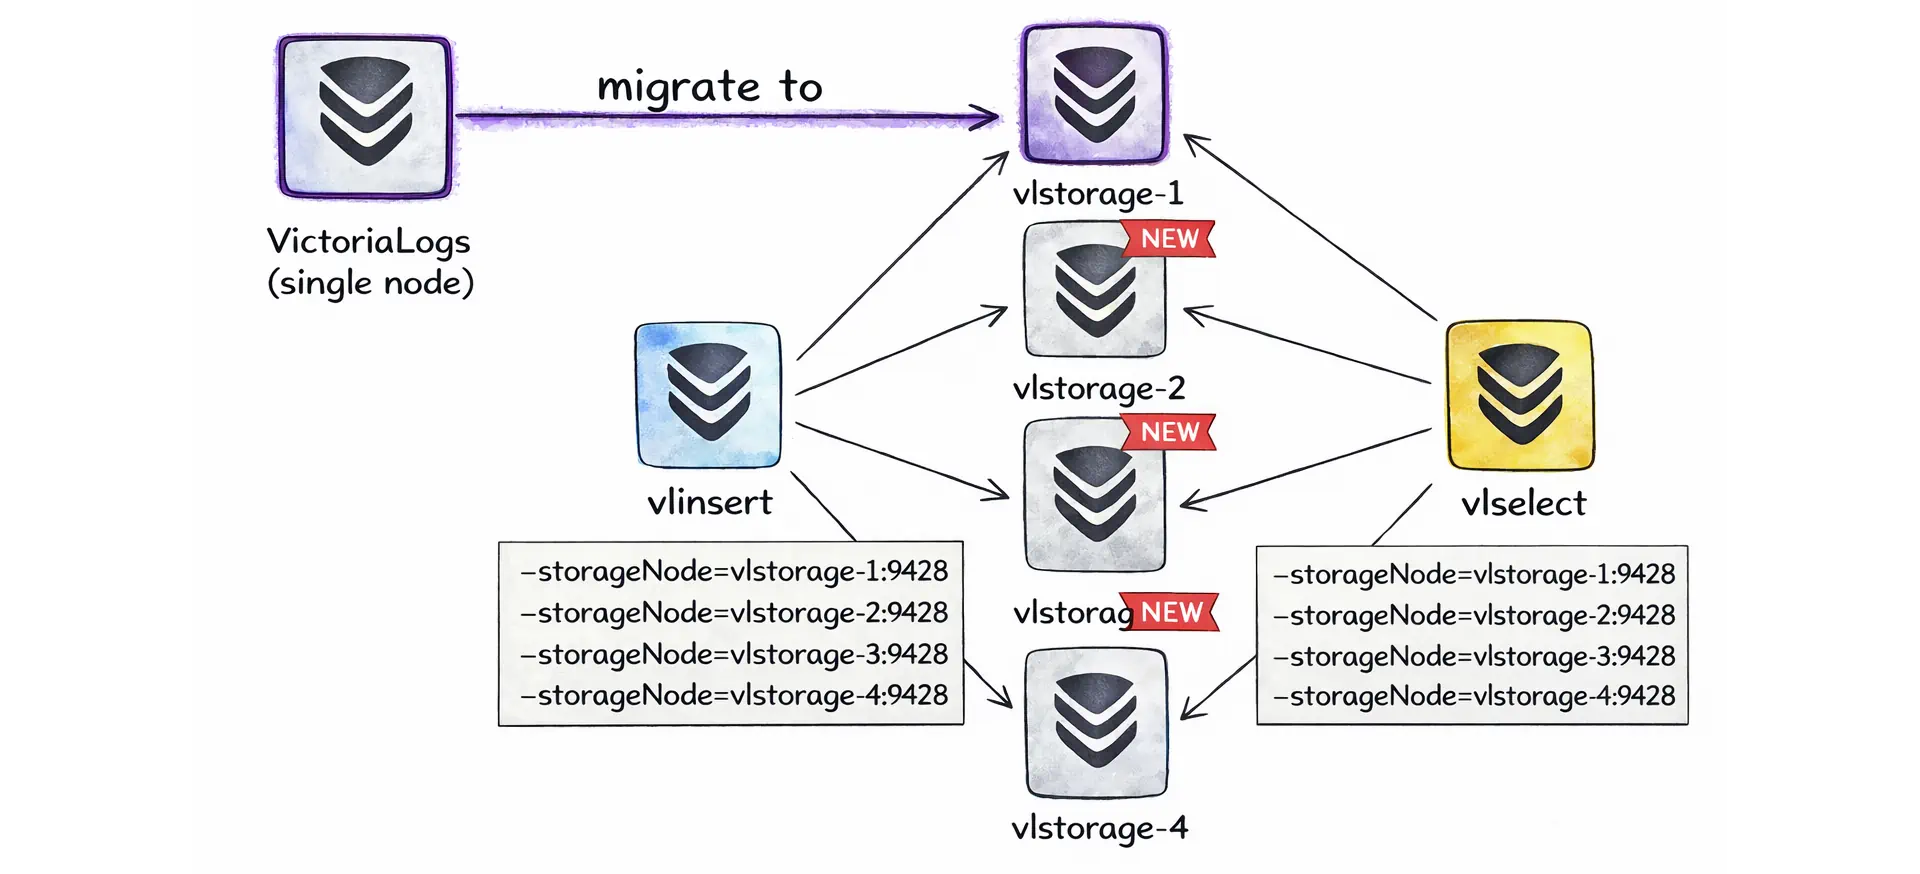
In other words, scaling to a cluster can be as simple as adding more storage nodes and then pointing your insert and query gateways at them via -storageNode.
Normally, you will not wire this by hand because the Helm chart victoria-logs-cluster and the operator resource VLCluster handle these flags and roles for you.
VictoriaLogs Cluster dashboard is available here
Components
#
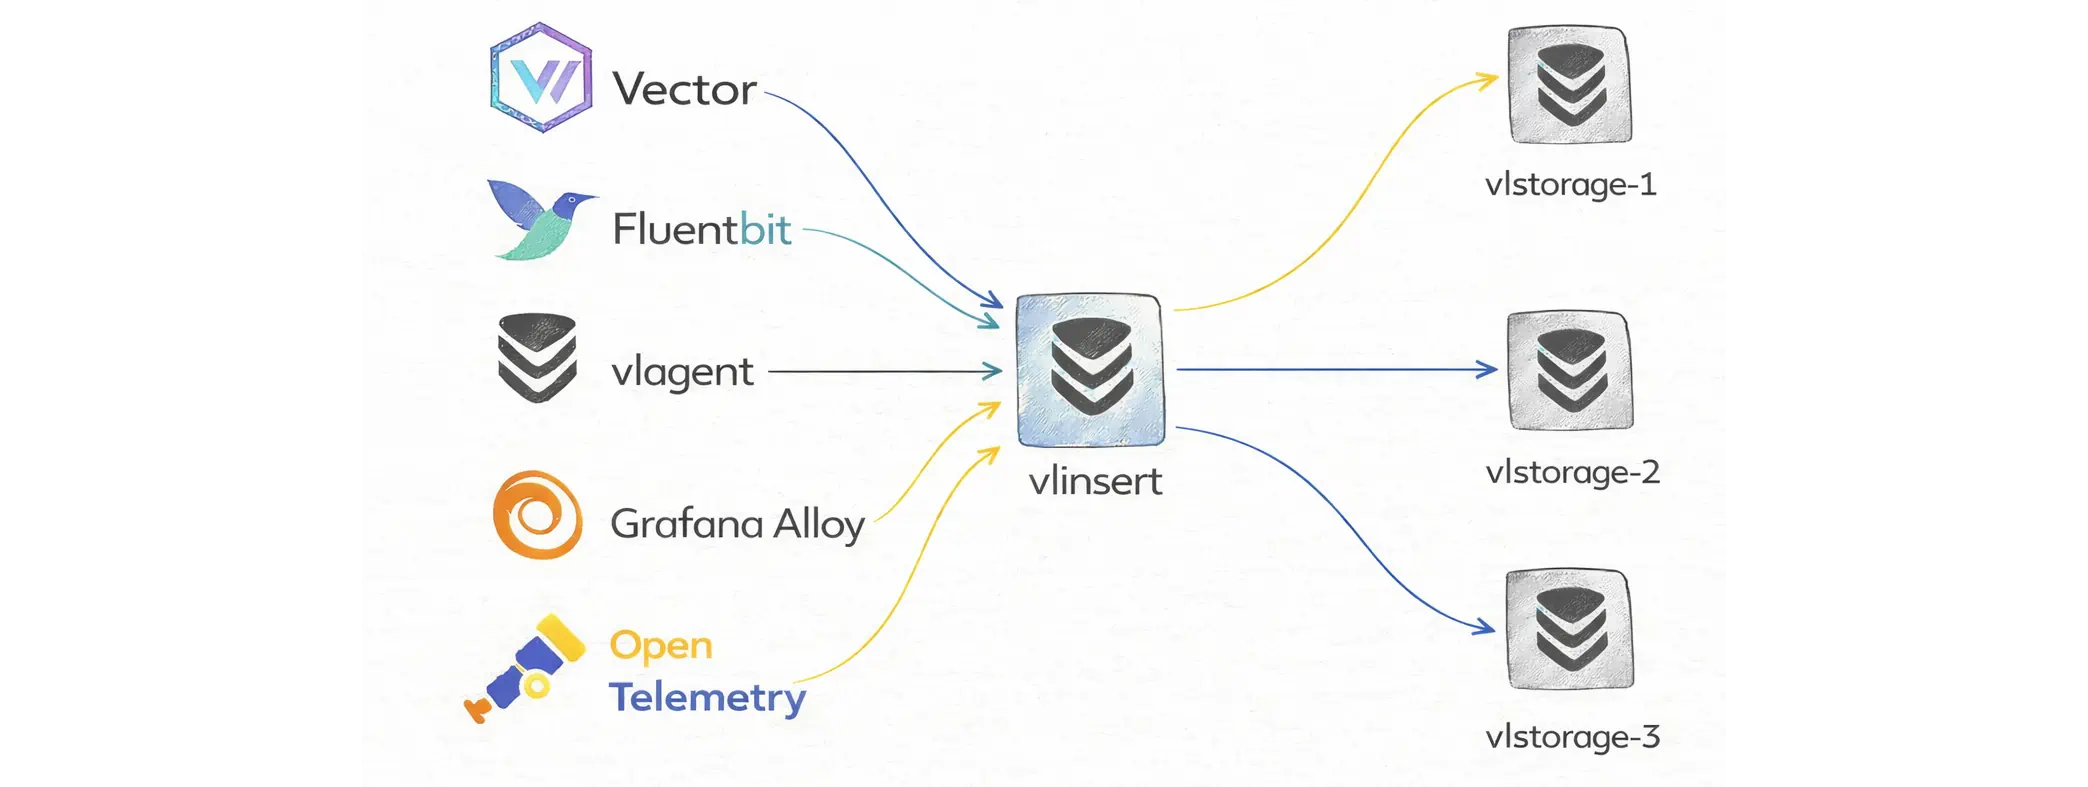
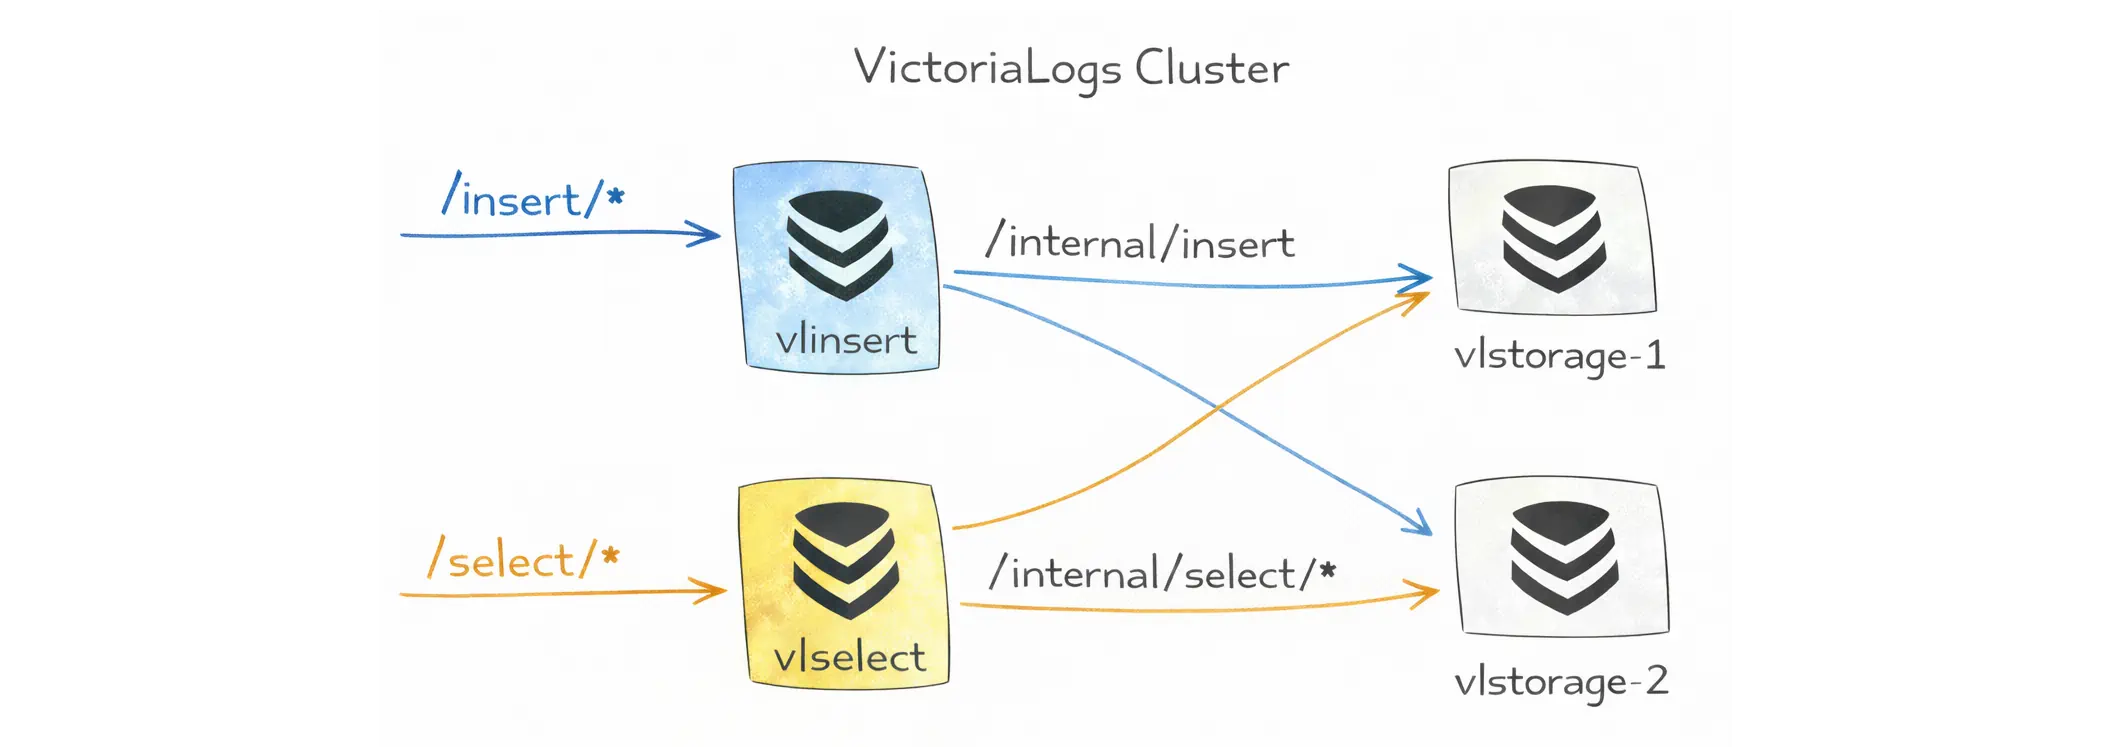
In a cluster, vlinsert is the write gateway. Log shippers (vlagent, Vector, Fluent Bit, Promtail, OpenTelemetry collectors, or custom producers) send data to vlinsert. It shards incoming logs and forwards them to the vlstorage nodes (via the internal endpoint /internal/insert).
If a storage node becomes unavailable, vlinsert temporarily stops sending data to it and routes writes to the remaining storage nodes. This may temporarily increase CPU, RAM, and disk usage on the nodes that are still healthy.
vlstorage is the only role that stores durable data on disk. It is responsible for writing data, applying compression, merging parts in the background, and enforcing retention.
vlselect is the read and query gateway. When users open Grafana Explore, run vlogscli, call the query APIs, or use vmui (built-in web UI), the requests go to vlselect.
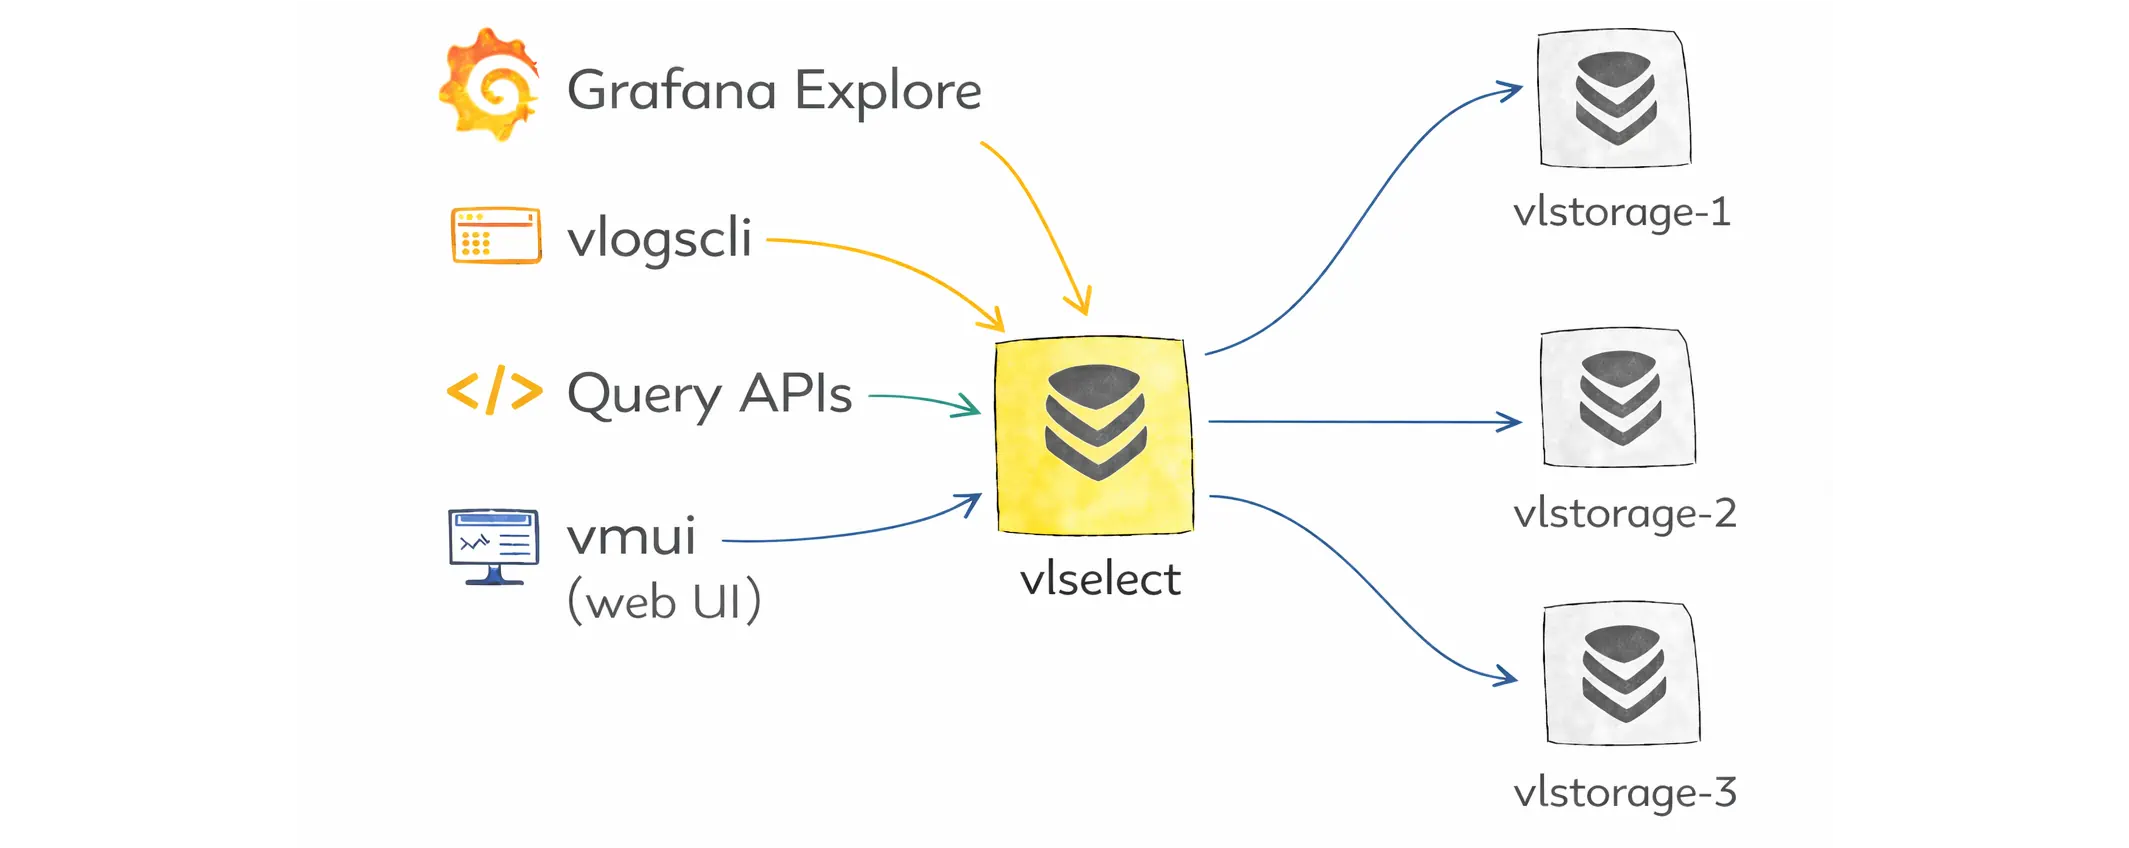
It fans out the query to the storage nodes, merges the results, and returns the response to the client. By default, if any storage node is unavailable, the query fails with an error.
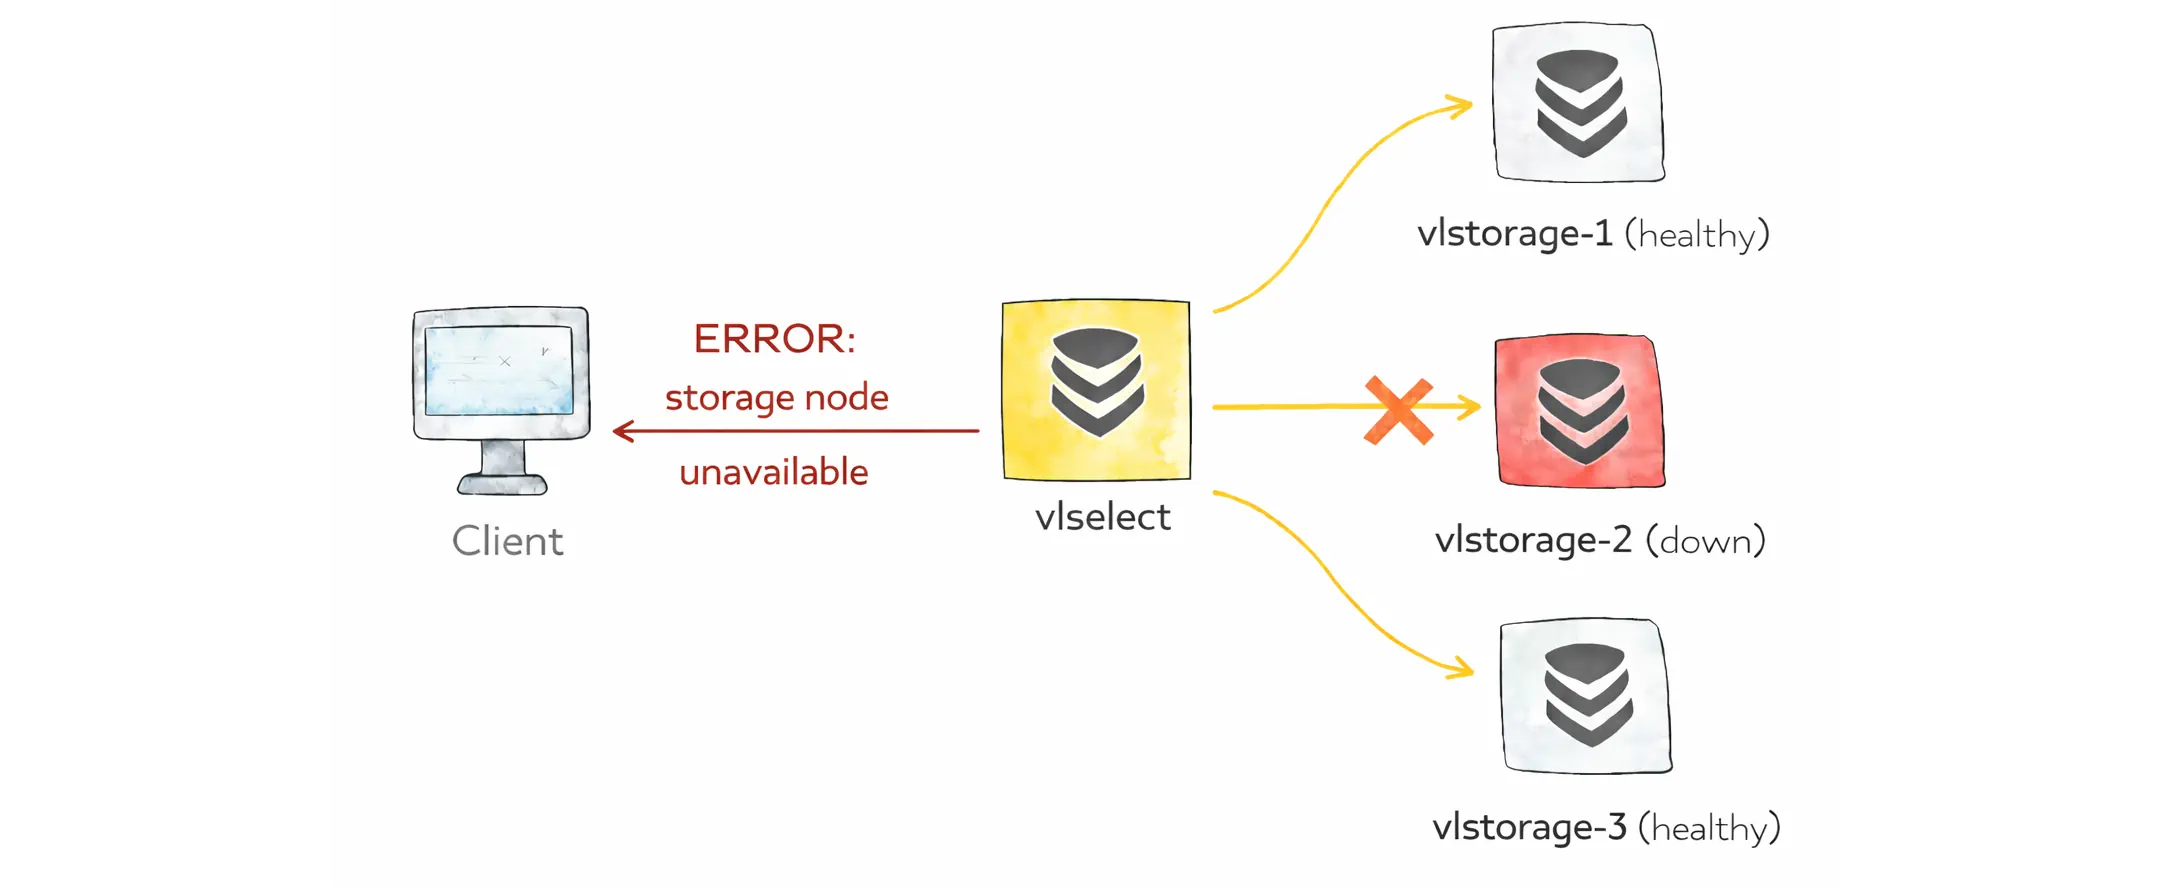
Allow partial response
Partial responses are disabled by default, so a query fails if any vlstorage node is unavailable.
If you want partial results, you can enable it per request with the allow_partial_response query arg, or set it as the default on vlselect with -search.allowPartialResponse.
For the most explicit behavior, put it in the query itself with options(allow_partial_response=true). This overrides both the flag and the query arg.
Routing & Security
#
Even though we talk about vlinsert, vlselect, and vlstorage as separate roles, they are all the same victoria-logs binary, started with different flags. That means any node can technically accept /insert/* or /select/* requests unless you restrict it.
The practical difference is how the node is configured. A storage node runs without -storageNode, so it opens local storage at -storageDataPath and persists logs. Insert and query gateways run with -storageNode, so they forward writes and reads to the listed storage nodes instead of storing data locally.
To prevent unexpected uses of these components, a common pattern is to use a load balancer that supports strict routing such as vmauth:
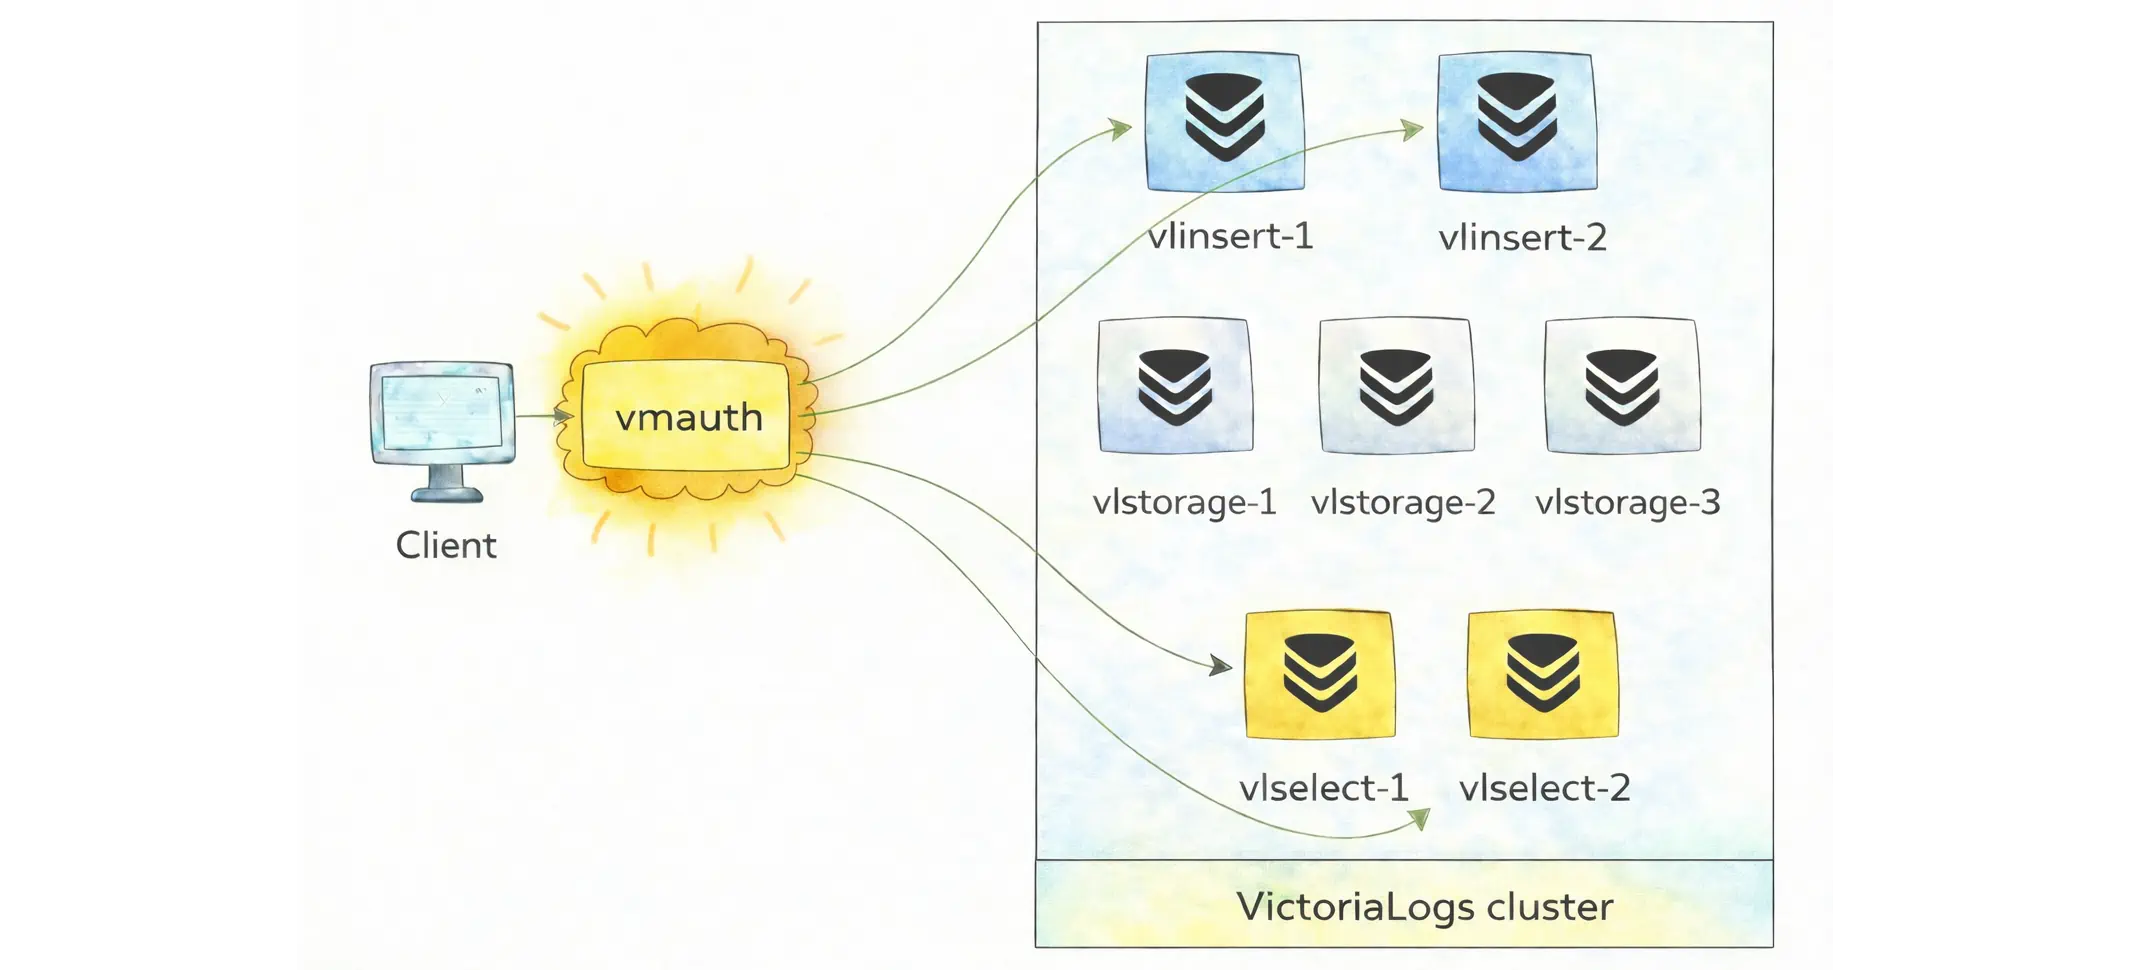
But you need to understand the endpoint pattern:
- Public API endpoints are meant for clients:
/insert/*for ingestion to vlinsert and/select/*for querying - Internal cluster endpoints are meant only for component-to-component communication:
/internal/insertand/internal/select/*. These paths should be reachable only inside the private network and never exposed publicly.
Then an example of vmauth configuration could be:
unauthorized_user:
  url_map:
    # Public querying API -> vlselect
    - src_paths:
        - "/select/.*"
      url_prefix:
        - "http://vlselect-1:9428"
        - "http://vlselect-2:9428"

    # Public ingestion API -> vlinsert
    - src_paths:
        - "/insert/.*"
      url_prefix:
        - "http://vlinsert:9428"
On the other hand, vlstorage is kept private and reachable only from within the cluster.
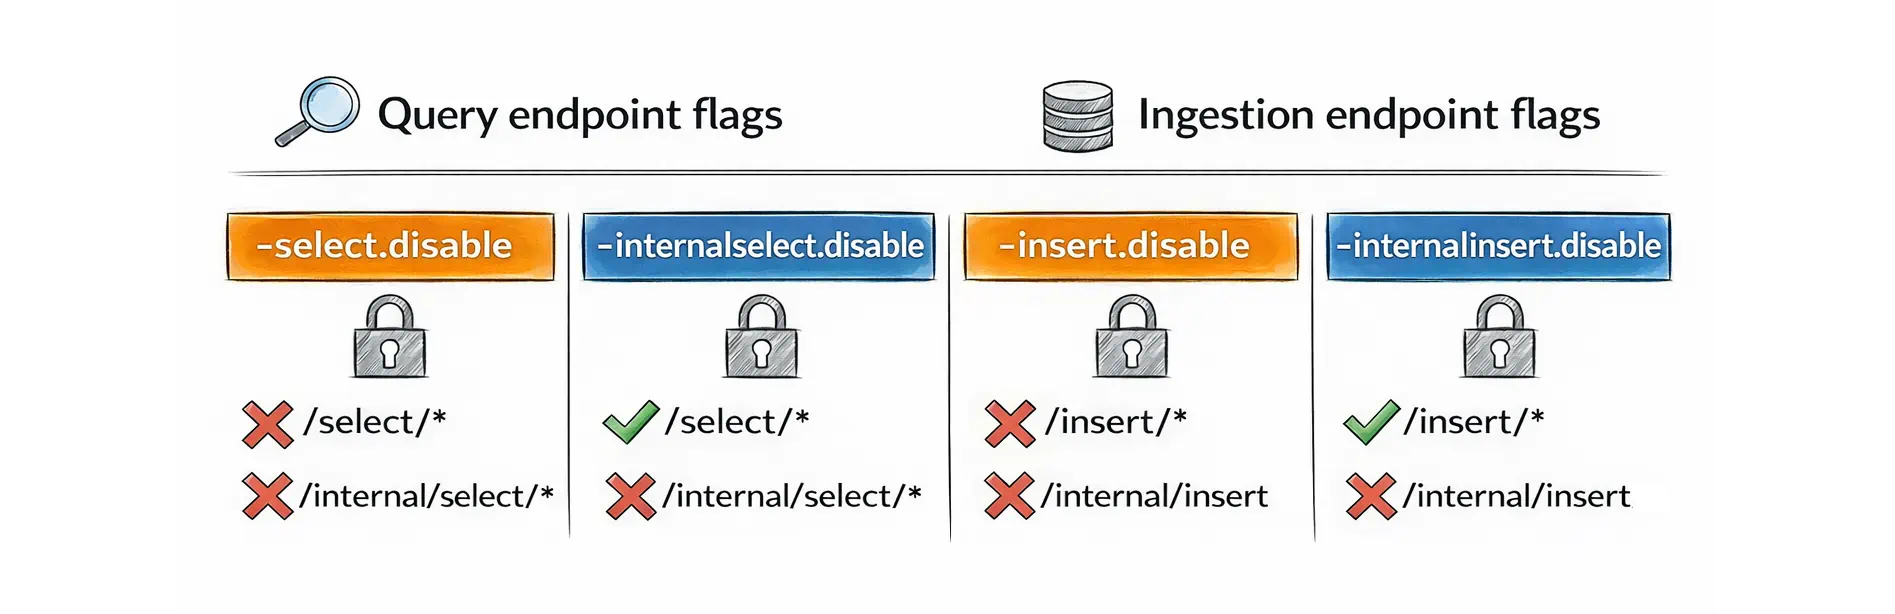
VictoriaLogs also provides flags to reduce “wrong-route” traffic at the path-prefix level:
- For the query role (
vlselect):-select.disabledisables both/select/*and/internal/select/*, while-internalselect.disabledisables only/internal/select/*. - For the ingest role (
vlinsert):-insert.disabledisables both/insert/*and/internal/insert, while-internalinsert.disabledisables only/internal/insert.
Other Features
#
Here are a few extra features you will likely use in real systems:
Deletion
#
The Delete API helps remove already ingested logs when you must “undo” a mistake (e.g. secrets/PII accidentally logged).
This feature is disabled by default and must be enabled with -delete.enable. In a cluster, internal delete endpoints are also disabled by default and require -internaldelete.enable on vlselect.
Live tailing
#
Live tailing streams new logs as they arrive in real time (like tail -f, but filtered by LogsQL) via /select/logsql/tail.
You send a query once and keep the HTTP connection open. The UI or CLI then receives new matching log entries as they arrive. This is useful for quick debugging, validating a deploy, or watching an incident in progress.
Multitenancy (tenant isolation)
#
Multitenancy lets you use a single VictoriaLogs deployment (single-node or cluster) for multiple teams or environments while keeping their logs separated. VictoriaLogs internally assigns every ingested log entry to a tenant identified by two numbers:
AccountID: usually the team or organizationProjectID: usually the environment or project inside that account
The tenant is taken from the HTTP request headers for both ingestion and query requests. If these headers are missing, VictoriaLogs uses the default tenant AccountID=0 and ProjectID=0. What this means in practice:
- If you ingest logs under
AccountID=10, ProjectID=1, you must query with the same tenant headers to see that data. - If you query without tenant headers, you will only see data stored in the default tenant (
0:0).
Low-disk protection
#
Disk space exhaustion is one of the most common causes of a log system becoming unhealthy. When the free space at -storageDataPath drops below -storage.minFreeDiskSpaceBytes (default 10MB), the storage switches to read-only mode and rejects new writes. This keeps already stored logs queryable while you free space or expand the disk.
The /metrics endpoint exposes vl_free_disk_space_bytes{path="..."} and vl_storage_is_read_only{path="..."}. These metrics are enough for simple alerting, so low-disk conditions can be handled before ingestion is blocked.
Who We Are
#
We’re VictoriaMetrics, a team providing open-source, highly scalable, and cost-efficient solutions for monitoring, logging, and tracing, trusted by users worldwide to reduce their observability costs. Check out our VictoriaMetrics, VictoriaLogs, and VictoriaTraces for more details.
Leave a comment below or Contact Us if you have any questions!
comments powered by Disqus