- Blog /
- Vibe coding tools observability with VictoriaMetrics Stack and OpenTelemetry
Vibe coding tools observability with VictoriaMetrics Stack and OpenTelemetry
Share:


Introduction
#
AI-powered coding assistants have transformed how developers write software. Tools like Claude Code, OpenAI Codex, Gemini CLI, Qwen Code, and OpenCode have introduced what many call “vibe coding” — a new paradigm where users describe their intent and AI agents handle the implementation details.
But as these tools become integral to development workflows, a critical question emerges: how do we understand what’s happening under the hood?
Observability matters if you are an individual developer tracking token usage and costs, a team lead optimizing resource use, or an enterprise administrator enforcing compliance and governance policies.
The good news is that all major vibe coding tools now support OpenTelemetry, the vendor-neutral industry standard for telemetry data. Combined with open source VictoriaMetrics Observability Stack, you can build a powerful, cost-effective monitoring solution that provides deep insights into your AI-assisted development workflows.
In my previous article, “AI Agents Observability with OpenTelemetry and the VictoriaMetrics Stack”, I covered the fundamentals of monitoring AI agents using auto-instrumentation libraries. Today, I want to explore how to configure observability specifically for command-line vibe coding tools and examine the rich telemetry data they provide out of the box.
Why you need observability
#
Here’s why implementing observability for AI agents is worth the effort:
Cost Management: AI coding assistants consume tokens with every interaction, and costs can accumulate quickly. Understanding your token usage patterns helps you optimize prompts, choose appropriate models, and avoid budget surprises.
Performance Insights: Are certain types of tasks taking longer than expected? Are there patterns in API latency that affect your workflow? Understanding these dynamics helps you work more efficiently.
Usage Analytics: Which features are developers using most? How does tool adoption vary across projects? This data informs training investments and workflow improvements for teams.
Debugging and Troubleshooting: When something goes wrong, having detailed logs and traces of what happened helps you quickly identify root causes.
Compliance and Governance: Enterprise environments demand audit trails of AI tool usage, including what prompts were sent, what changes were made, and who made them.
The VictoriaMetrics Stack
#
The VictoriaMetrics Stack provides a complete, unified backend for all your observability signals:
VictoriaMetrics: High-performance time-series metrics storage and querying with native OpenTelemetry support.
VictoriaLogs: Efficient log storage and analysis with a powerful query language.
VictoriaTraces: Distributed traces storage for visualizing complete request flows.
All three components accept data via the OpenTelemetry protocol (OTLP), so any tool that supports OTLP can send telemetry directly without custom integrations.
For quick setup instructions, including Docker Compose and Helm configurations, refer to my previous article on AI agents observability.
The easiest way to get started is to create deployments in VictoriaMetrics Cloud. Managed VictoriaMetrics is already available today and managed VictoriaLogs support is planned soon. If you’d like to run a PoC, please contact us. Otherwise, you can jump right into VictoriaMetrics Cloud with a free trial (no credit card required).
Tool-by-tool configuration
#
Now let’s look at how to configure each vibe coding tool to send telemetry to the VictoriaMetrics Stack.
Claude Code
#
This section is based on the official Claude Code documentation (and unlike other tools, Claude Code has excellent documentation on this topic).
Claude Code from Anthropic provides comprehensive OpenTelemetry support for both metrics and events (logs). The telemetry system is opt-in and designed with privacy in mind — sensitive information is never included in telemetry data, and user prompts are redacted by default.
Quick Start Configuration
#
To enable telemetry in Claude Code, set the following environment variables:
# Enable telemetry collection
export CLAUDE_CODE_ENABLE_TELEMETRY=1
# Enable cumulative counters instead of delta counters because VictoriaMetrics does not support delta
export OTEL_EXPORTER_OTLP_METRICS_TEMPORALITY_PREFERENCE=cumulative

# Configure exporters for metrics and logs
export OTEL_METRICS_EXPORTER=otlp
export OTEL_LOGS_EXPORTER=otlp

# Set the OTEL collector endpoint and protocol
export OTEL_EXPORTER_OTLP_PROTOCOL=http/protobuf
export OTEL_EXPORTER_OTLP_ENDPOINT=http://otel-collector:4318 # your OpenTelemetry collector endpoint

# Run Claude Code
claude
Remember to replace the collector endpoint with your own. For example, if you deploy everything locally, you can use:
export OTEL_EXPORTER_OTLP_ENDPOINT=http://localhost:4318
The default export interval is 60 seconds for metrics and 5 seconds for logs. During initial setup and debugging, you might want shorter intervals:
export OTEL_METRIC_EXPORT_INTERVAL=10000  # 10 seconds
export OTEL_LOGS_EXPORT_INTERVAL=5000     # 5 seconds
It also supports more advanced configuration options according to OpenTelemetry specification.
Administrator Configuration for Teams
#
For organizations wanting centralized control, Claude Code supports managed settings files. Create a configuration file that will be distributed via MDM or other device management tooling:
{
  "env": {
    "CLAUDE_CODE_ENABLE_TELEMETRY": "1",
    "OTEL_METRICS_EXPORTER": "otlp",
    "OTEL_LOGS_EXPORTER": "otlp",
    "OTEL_EXPORTER_OTLP_PROTOCOL": "http/protobuf",
    "OTEL_EXPORTER_OTLP_ENDPOINT": "https://otel-collector.company.com:4318",
    "OTEL_EXPORTER_OTLP_HEADERS": "Authorization=Bearer company-token"
  }
}
Environment variables in managed settings have high precedence and cannot be overridden by individual users, ensuring a consistent telemetry collection across your organization.
Multi-Team Organization Support
#
Organizations with multiple teams can add custom attributes to segment telemetry data:
export OTEL_RESOURCE_ATTRIBUTES="env=production,department=engineering,team.id=platform"
These attributes appear on all metrics and events, enabling filtering by team, department, or env in your dashboards.
Cardinality Controls
#
Claude Code provides environment variables to control which attributes are included in metrics:
| Environment Variable | Description | Default |
|---|---|---|
OTEL_METRICS_INCLUDE_SESSION_ID | Include session.id attribute | true |
OTEL_METRICS_INCLUDE_VERSION | Include app.version attribute | false |
OTEL_METRICS_INCLUDE_ACCOUNT_UUID | Include user.account_uuid attribute | true |
Lower cardinality means better performance and lower storage costs, but less granular data for analysis.
Available Metrics
#
Claude Code exports a rich set of metrics:
| Metric Name | Description | Attributes |
|---|---|---|
claude_code.session.count | Sessions started | Standard attributes |
claude_code.token.usage | Tokens used | type (input / output / cacheRead / cacheCreation), model |
claude_code.cost.usage | Estimated cost (USD) | model |
claude_code.lines_of_code.count | Lines modified | type (added / removed) |
claude_code.active_time.total | Active time (seconds) | Standard attributes |
claude_code.commit.count | Git commits created | Standard attributes |
claude_code.pull_request.count | PRs created | Standard attributes |
claude_code.code_edit_tool.decision | Tool permission decisions | tool, decision, language |
Available Events
#
Beyond metrics, Claude Code exports detailed events via the OpenTelemetry logs protocol:
| Event Name | Description | Key Attributes |
|---|---|---|
claude_code.user_prompt | User prompt submitted | prompt_length, prompt (redacted by default) |
claude_code.tool_result | Tool execution completed | tool_name, success, error, duration_ms, decision (accept / reject), source (config / user_permanent / user_temporary / user_abort / user_reject), tool_parameters |
claude_code.api_request | API request to Claude | model, cost_usd, duration_ms, input_tokens, output_tokens, cache_read_tokens, cache_creation_tokens |
claude_code.api_error | API request failed | model, error, status_code, duration_ms, attempt |
claude_code.tool_decision | Tool permission decision made | tool_name, decision, source (config / user_permanent / user_temporary / user_abort / user_reject) |
To enable user prompt logging (if your compliance requirements allow):
export OTEL_LOG_USER_PROMPTS=1
OpenAI Codex
#
This section is based on the official OpenAI Codex documentation and the source code of Codex CLI.
OpenAI Codex provides OpenTelemetry export of logs and traces to track runs, including API requests, streaming events, prompts, tool approvals, and results. Like Claude Code, telemetry is disabled by default and requires explicit opt-in.
Codex uses a TOML configuration file located at ~/.codex/config.toml.
Add an [otel] section to enable telemetry:
[otel]
environment = "production"  # defaults to "dev"
log_user_prompt = false     # redact user prompts unless explicitly enabled

# Enable events (logs)
[otel.exporter.otlp-http]
endpoint = "http://otel-collector:4318/v1/logs" # your OpenTelemetry collector endpoint
protocol = "binary"

# Enable traces
[otel.trace_exporter.otlp-http]
endpoint = "http://otel-collector:4318/v1/traces" # your OpenTelemetry collector endpoint
protocol = "binary"
Remember to replace the collector endpoints with your own.
Codex currently exports logs and traces, but not metrics. For metrics, you would need to derive them from log data.
You can also use standard OpenTelemetry environment variables to configure the exporter. For example, organizations with multiple teams can add custom attributes to segment telemetry data:
export OTEL_RESOURCE_ATTRIBUTES="env=production,department=engineering,team.id=platform"
Event Metadata
#
Codex adds a consistent set of attributes to every exported OpenTelemetry log event:
| Attribute | Description |
|---|---|
service.name | Originator identifier (same as the originator header); defaults to codex_cli_rs |
env | Environment tag from [otel].environment (defaults to dev) |
event.timestamp | Event timestamp |
event.name | Event name (for example, codex.api_request) |
conversation.id | Conversation/thread identifier |
app.version | Codex CLI version |
terminal.type | Terminal type |
model | Active model name |
slug | Human-readable identifier for a model |
auth_mode | Authentication mode (when available) |
user.account_id | User account ID (when available) |
user.email | User email (when available) |
Available Events
#
With telemetry enabled, Codex emits the following event types (exported as OpenTelemetry logs). Each event includes the common metadata above, plus per-event attributes:
| Event | Description | Additional Attributes |
|---|---|---|
codex.conversation_starts | Conversation started | provider_name, reasoning_effort (optional), reasoning_summary, context_window (optional), max_output_tokens (optional), auto_compact_token_limit (optional), approval_policy, sandbox_policy, mcp_servers (comma-separated list), active_profile (optional) |
codex.api_request | Outbound API request | attempt, duration_ms, http.response.status_code (optional), error.message (failures) |
codex.sse_event | Streaming (SSE) event | event.kind, duration_ms, error.message (failures), input_token_count (responses only), output_token_count (responses only), cached_token_count (responses only, optional), reasoning_token_count (responses only, optional), tool_token_count (responses only) |
codex.user_prompt | User prompt submitted | prompt_length, prompt (redacted unless log_user_prompt = true) |
codex.tool_decision | Tool approval decision | tool_name, call_id, decision (approved, approved_execpolicy_amendment, approved_for_session, denied, or abort), source (config or user) |
codex.tool_result | Tool invocation result | tool_name, call_id (optional), arguments (optional), duration_ms, success ("true" or "false"), output |
To enable user prompt logging for codex.user_prompt events (if your compliance requirements allow),
you should set log_user_prompt parameter to true in your configuration.
Google Gemini CLI
#
This section is based on the official Google Gemini CLI documentation.
Gemini CLI provides one of the most comprehensive OpenTelemetry implementations among vibe coding tools, with support for both metrics and logs following OpenTelemetry GenAI semantic conventions.
All telemetry behavior is controlled through .gemini/settings.json:
{
  "telemetry": {
    "enabled": true,
    "target": "local",
    "otlpEndpoint": "http://otel-collector:4318",
    "otlpProtocol": "http",
    "logPrompts": false
  }
}
Remember to replace the collector endpoints with your own.
Environment variables can override these settings:
| Setting | Environment Variable | Description | Default |
|---|---|---|---|
enabled | GEMINI_TELEMETRY_ENABLED | Enable/disable telemetry | false |
target | GEMINI_TELEMETRY_TARGET | gcp or local | "local" |
otlpEndpoint | GEMINI_TELEMETRY_OTLP_ENDPOINT | Collector endpoint | http://localhost:4317 |
otlpProtocol | GEMINI_TELEMETRY_OTLP_PROTOCOL | grpc or http | "grpc" |
outfile | GEMINI_TELEMETRY_OUTFILE | Save telemetry to file | - |
logPrompts | GEMINI_TELEMETRY_LOG_PROMPTS | Include prompts in logs | true |
useCollector | GEMINI_TELEMETRY_USE_COLLECTOR | Use external collector | false |
To enable user prompt logging (if your compliance requirements allow),
you can set logPrompts parameter (or GEMINI_TELEMETRY_LOG_PROMPTS environment variable) to true.
Available Log Events
#
Gemini CLI provides exceptionally detailed telemetry across multiple categories:
| Event | Description | Key Attributes |
|---|---|---|
gemini_cli.config | Startup configuration | model, embedding_model, sandbox_enabled, approval_mode, mcp_servers, log_user_prompts_enabled, extensions, mcp_tools |
gemini_cli.user_prompt | User prompt submitted | prompt_length, prompt_id, prompt, auth_type |
gemini_cli.tool_call | Tool execution | function_name, duration_ms, success, decision (accept / reject / auto_accept / modify), tool_type, error, error_type, prompt_id, mcp_server_name, extension_name, content_length |
gemini_cli.tool_output_truncated | Tool call truncated | tool_name, original_content_length, truncated_content_length, threshold, lines, prompt_id |
gemini_cli.smart_edit_strategy | Smart Edit strategy chosen | strategy |
gemini_cli.smart_edit_correction | Smart Edit correction result | correction (success / failure) |
gemini_cli.file_operation | File operation | tool_name, operation, lines, mimetype, extension, programming_language |
gemini_cli.api_request | API request | model, prompt_id, request_text |
gemini_cli.api_response | API response | model, duration_ms, status_code, input_token_count, output_token_count, cached_content_token_count, thoughts_token_count, tool_token_count, total_token_count, prompt_id |
gemini_cli.api_error | API error | model, error, error_type, status_code, duration_ms, prompt_id |
gemini_cli.slash_command | Slash command execution | command, subcommand, status (success / error) |
gemini_cli.model_routing | Model routing decision | decision_model, routing_latency_ms, reasoning |
gemini_cli.chat_compression | Chat context compression | tokens_before, tokens_after |
gemini_cli.conversation_finished | Conversation session ended | approvalMode, turnCount |
gemini_cli.next_speaker_check | Next speaker determination | prompt_id, finish_reason, result |
gemini_cli.flash_fallback | Switched to a flash model as fallback | |
gemini_cli.ripgrep_fallback | Switched to grep as fallback for file search | error |
gemini_cli.web_fetch_fallback_attempt | Attempted web-fetch fallback | reason (private_ip, primary_failed) |
gemini_cli.extension_install | Extension was installed | extension_name, extension_version, extension_source, status |
gemini_cli.extension_uninstall | Extension was uninstalled | extension_name, status |
gemini_cli.extension_enable | Extension was enabled | extension_name, setting_scope |
gemini_cli.extension_disable | Extension was disabled | extension_name, setting_scope |
gemini_cli.extension_update | Extension was updated | extension_name, extension_version, extension_previous_version, extension_source, status |
gemini_cli.agent.start | Agent run started | agent_id, agent_name |
gemini_cli.agent.finish | Agent run finished | agent_id, agent_name, duration_ms, turn_count, terminate_reason |
gemini_cli.ide_connection | IDE companion connection | connection_type |
Gemini CLI also exports events following OpenTelemetry GenAI semantic conventions for events:
| Event | Description | Key Attributes |
|---|---|---|
gen_ai.client.inference.operation.details | This event provides detailed information about the GenAI operation, aligned with OpenTelemetry GenAI semantic conventions for events. | gen_ai.request.model, gen_ai.provider.name, gen_ai.operation.name, gen_ai.input.messages, gen_ai.output.messages, gen_ai.usage.input_tokens, gen_ai.usage.output_tokens, gen_ai.request.temperature, server.address, server.port |
Available Metrics
#
| Metric | Type | Description | Key Attributes |
|---|---|---|---|
gemini_cli.session.count | Counter | CLI sessions started | |
gemini_cli.tool.call.count | Counter | Tool calls by function and success | function_name, success, decision (accept / reject / modify / auto_accept), tool_type (mcp / native) |
gemini_cli.tool.call.latency | Histogram | Tool call latency | function_name |
gemini_cli.api.request.count | Counter | API requests by model and status | model, status_code, error_type |
gemini_cli.api.request.latency | Histogram | API request latency | model |
gemini_cli.token.usage | Counter | Tokens by model and type | model, type (input / output / thought / cache / tool) |
gemini_cli.file.operation.count | Counter | File operations | operation (create / read / update), lines, mimetype, extension, programming_language |
gemini_cli.lines.changed | Counter | Lines added/removed | function_name, type (added / removed) |
gemini_cli.chat_compression | Counter | Counts chat compression operations | tokens_before, tokens_after |
gemini_cli.chat.invalid_chunk.count | Counter | Counts invalid chunks from streams | |
gemini_cli.chat.content_retry.count | Counter | Counts retries due to content errors | |
gemini_cli.chat.content_retry_failure.count | Counter | Counts requests where all content retries failed | |
gemini_cli.slash_command.model.call_count | Counter | Counts model selections via slash command | slash_command.model.model_name |
gemini_cli.model_routing.latency | Histogram | Model routing decision latency | routing.decision_model, routing.decision_source |
gemini_cli.model_routing.failure.count | Counter | Counts model routing failures | routing.decision_source, routing.error_message |
gemini_cli.agent.run.count | Counter | Counts agent runs | agent_name, terminate_reason |
gemini_cli.agent.duration | Histogram | Agent run durations | agent_name |
gemini_cli.agent.turns | Histogram | Turns taken per agent run | agent_name |
gemini_cli.ui.flicker.count | Counter | Counts UI frames that flicker (render taller than the terminal) | |
gemini_cli.startup.duration | Histogram | CLI startup time by phase | phase, details |
gemini_cli.memory.usage | Histogram | Memory usage | memory_type (heap_used / heap_total / external / rss), component |
gemini_cli.cpu.usage | Histogram | CPU usage percentage | component |
gemini_cli.tool.queue.depth | Histogram | Number of tools in the execution queue | |
gemini_cli.tool.execution.breakdown | Histogram | Tool time by phase | function_name, phase (validation / preparation / execution / result_processing) |
gemini_cli.api.request.breakdown | Histogram | API request time by phase | model, phase (request_preparation / network_latency / response_processing / token_processing) |
gemini_cli.token.efficiency | Histogram | Token efficiency metrics | model, metric, context |
gemini_cli.performance.score | Histogram | Composite performance score | category, baseline |
gemini_cli.performance.regression | Counter | Regression detection events | metric, severity (low / medium / high), current_value, baseline_value |
gemini_cli.performance.regression.percentage_change | Histogram | Percent change from baseline when regression detected | metric, severity (low / medium / high), current_value, baseline_value |
gemini_cli.performance.baseline.comparison | Histogram | Comparison to baseline | metric, severity (low / medium / high), current_value, baseline_value |
Gemini CLI also exports metrics following OpenTelemetry GenAI semantic conventions for metrics:
| Metric | Type | Description | Key Attributes |
|---|---|---|---|
gen_ai.client.token.usage | Histogram | Number of input and output tokens used per operation | gen_ai.operation.name, gen_ai.provider.name, gen_ai.token.type (input / output), gen_ai.request.model, gen_ai.response.model, server.address, server.port |
gen_ai.client.operation.duration | Histogram | GenAI operation duration in seconds | gen_ai.operation.name, gen_ai.provider.name, gen_ai.request.model, gen_ai.response.model, server.address, server.port, error.type |
Qwen Code
#
This section is based on the official Qwen Code documentation.
Qwen Code follows a similar architecture to Gemini CLI and provides comparable OpenTelemetry support.
Configure telemetry in ~/.qwen/settings.json:
{
  "telemetry": {
    "enabled": true,
    "target": "local",
    "otlpEndpoint": "http://localhost:4318",
    "otlpProtocol": "http",
    "logPrompts": false
  }
}
Remember to replace the collector endpoints with your own.
Qwen Code also supports CLI flags for quick configuration changes:
qwen-code \
  --telemetry \
  --telemetry-target local \
  --telemetry-otlp-endpoint http://otel-collector:4318 \
  --telemetry-otlp-protocol grpc
Environment variables can override settings in the configuration file:
| Setting | Environment Variable | CLI Flag | Default |
|---|---|---|---|
enabled | QWEN_TELEMETRY_ENABLED | --telemetry / --no-telemetry | false |
target | QWEN_TELEMETRY_TARGET | --telemetry-target | "local" |
otlpEndpoint | QWEN_TELEMETRY_OTLP_ENDPOINT | --telemetry-otlp-endpoint | http://localhost:4317 |
otlpProtocol | QWEN_TELEMETRY_OTLP_PROTOCOL | --telemetry-otlp-protocol | "grpc" |
outfile | QWEN_TELEMETRY_OUTFILE | --telemetry-outfile | - |
logPrompts | QWEN_TELEMETRY_LOG_PROMPTS | --telemetry-log-prompts | false |
To enable user prompt logging (if your compliance requirements allow) you can set logPrompts parameter (or QWEN_TELEMETRY_LOG_PROMPTS environment variable) to true.
Available log Events
#
Qwen Code exports events with the qwen-code.* prefix:
| Event | Description | Key Attributes |
|---|---|---|
qwen-code.config | Startup configuration | model, embedding_model, sandbox_enabled, approval_mode, log_prompts_enabled, mcp_servers, core_tools_enabled |
qwen-code.user_prompt | User prompt | prompt, prompt_length, prompt_id, auth_type |
qwen-code.tool_call | Tool execution | function_name, duration_ms, success, decision (accept / reject / auto_accept / modify), error, error_type, content_length |
qwen-code.file_operation | File operation | tool_name, operation, lines, programming_language, diff_stat (ai_added_lines / ai_removed_lines / user_added_lines / user_removed_lines) |
qwen-code.api_request | API request | model, request_text |
qwen-code.api_error | API error | model, error, error_type, status_code, duration_ms, auth_type |
qwen-code.api_response | API response | model, status_code, duration_ms, error, input_token_count, output_token_count, cached_content_token_count, thoughts_token_count, tool_token_count, response_text |
qwen-code.tool_output_truncated | Tool call is too large and gets truncated | tool_name, original_content_length, truncated_content_length, threshold, lines, prompt_id |
qwen-code.slash_command | Slash command execution | command, subcommand |
qwen-code.extension_enable | Extension is enabled | |
qwen-code.extension_install | Extension is installed | extension_name, extension_version, extension_source, status |
qwen-code.extension_uninstall | Extension is uninstalled |
Available Metrics
#
| Metric | Type | Description | Key Attributes |
|---|---|---|---|
qwen-code.session.count | Counter | Sessions started | |
qwen-code.tool.call.count | Counter | Tool calls | function_name, success, decision (accept / reject / modify), tool_type (mcp / native) |
qwen-code.tool.call.latency | Histogram | Tool call latency | function_name, decision (accept / reject / modify) |
qwen-code.api.request.count | Counter | API requests | model, status_code, error_type |
qwen-code.api.request.latency | Histogram | API latency | model |
qwen-code.token.usage | Counter | Token usage | model, type (input / output / thought / cache / tool) |
qwen-code.file.operation.count | Counter | File operations | operation (create / read / update), lines, mimetype, extension, model_added_lines, model_removed_lines, user_added_lines, user_removed_lines, programming_language |
qwen-code.chat_compression | Counter | Chat compression events | tokens_before, tokens_after |
A unique feature of Qwen Code is the detailed diff statistics in file operations,
including ai_added_lines / model_added_lines, ai_removed_lines / model_removed_lines, user_added_lines, and user_removed_lines.
This helps you understand how much AI-generated code survives human review.
OpenCode
#
OpenCode releases announced support for OpenTelemetry but unfortunately, I haven’t managed to get OpenCode to send telemetry. There is no documentation on this, and the methods I found didn’t work for me.
Nevertheless, OpenCode is a fantastic tool, and I hope this feature will be fully implemented in the future.
Insights you can get
#
With telemetry flowing into VictoriaMetrics Stack, you can build insightful dashboards and queries that answer important questions about your AI-assisted development workflows using the power of MetricsQL for metrics and LogsQL for logs and traces.
Across all vibe coding tools, you can typically obtain the following types of information:
- Token Usage and Cost Analysis:
- Total token consumption by model, type (input/output/cache), and over time
- Cost tracking (currently only Claude exposes cost metrics directly)
- Cache efficiency metrics to optimize prompt engineering
- Productivity and Efficiency:
- Session and user counts and active time tracking
- User prompt analysis (length, frequency)
- Configuration and policy usage (approval modes, sandbox settings)
- Context compression events when conversations approach limits
- Tool Usage and Performance:
- Which tools are used most frequently
- Tool execution success/failure rates
- Tool latency
- Permission decision patterns (accept/reject/auto-accept)
- MCP server usage
- API Health and Troubleshooting:
- API call latency and error rates
- Detailed error logs with context
- Request/response analysis for debugging
- Team Usage Segmentation:
- Usage by department / team
- Individual user analytics
- Multi-environment support
Grafana dashboards
#
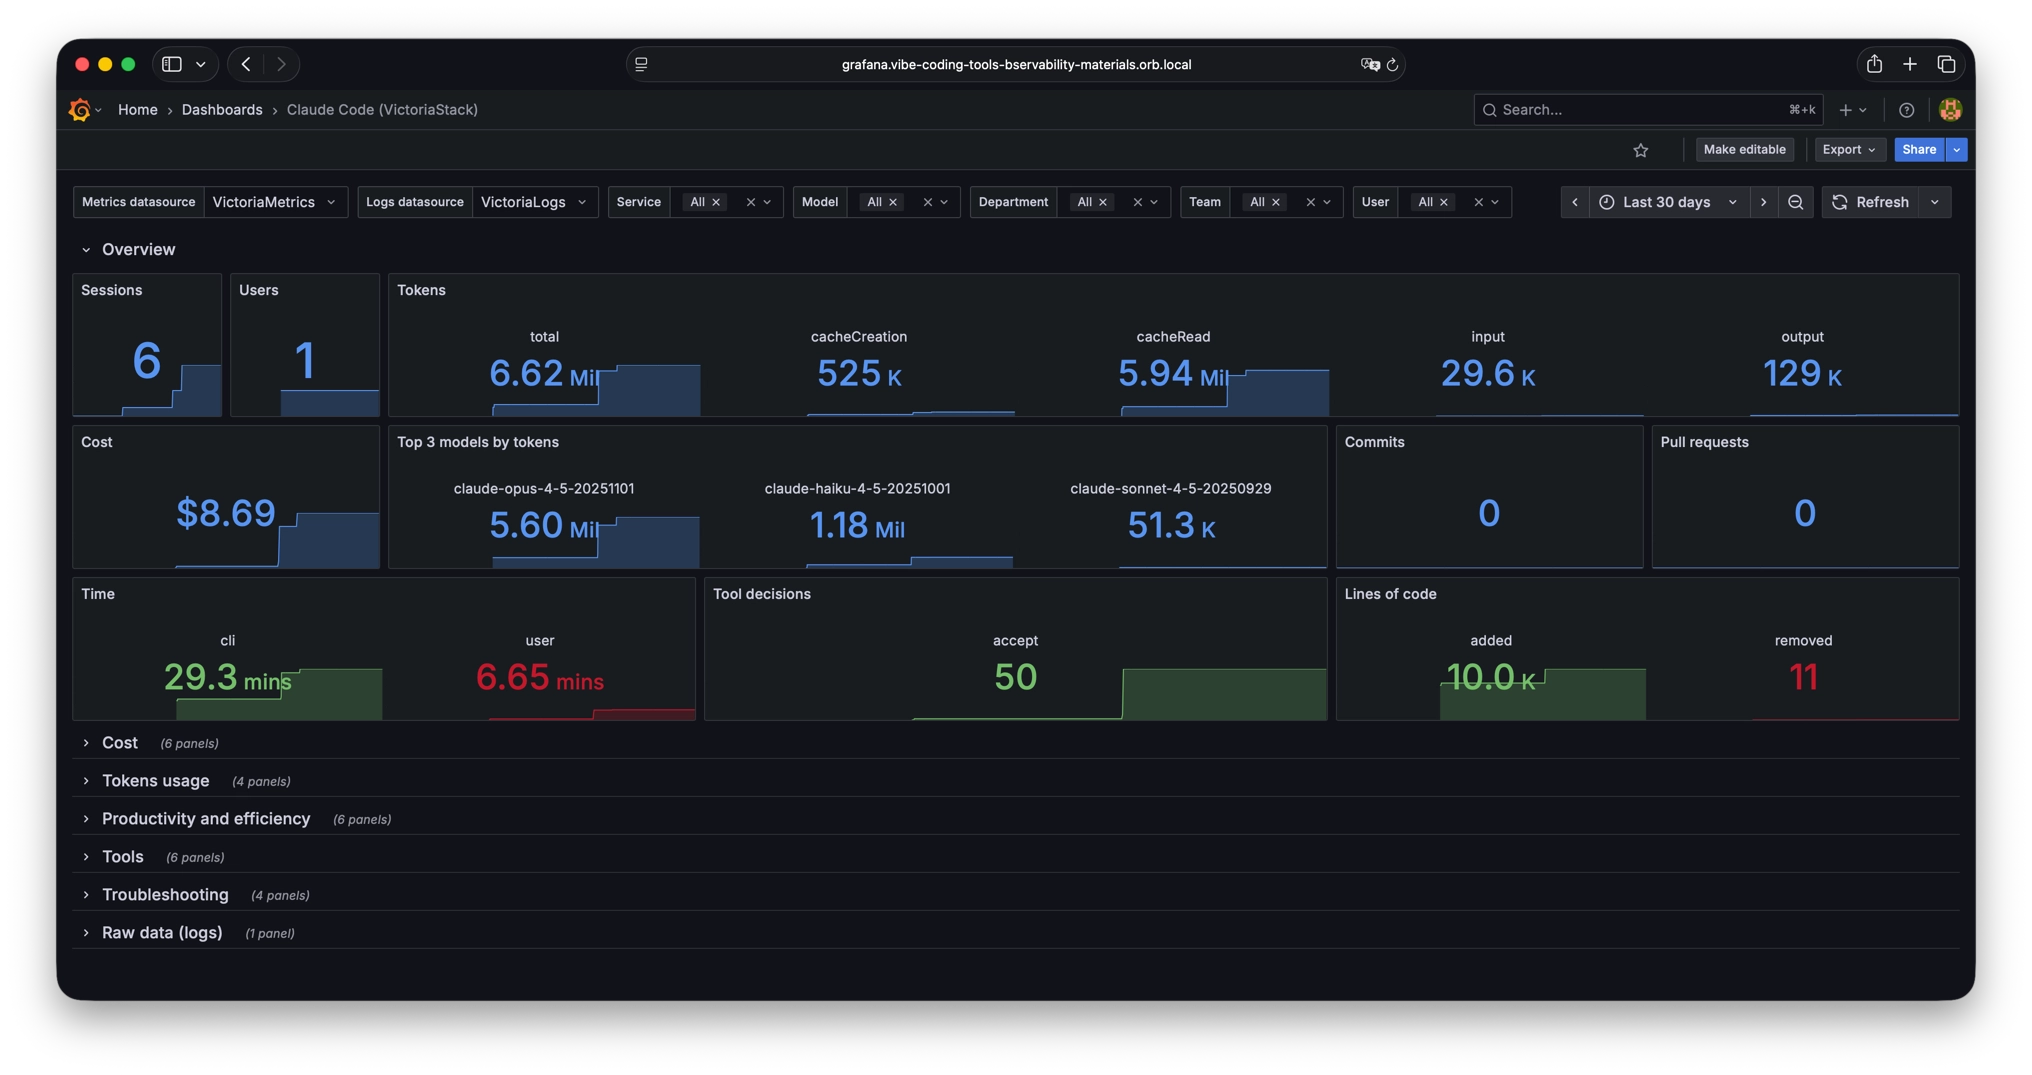
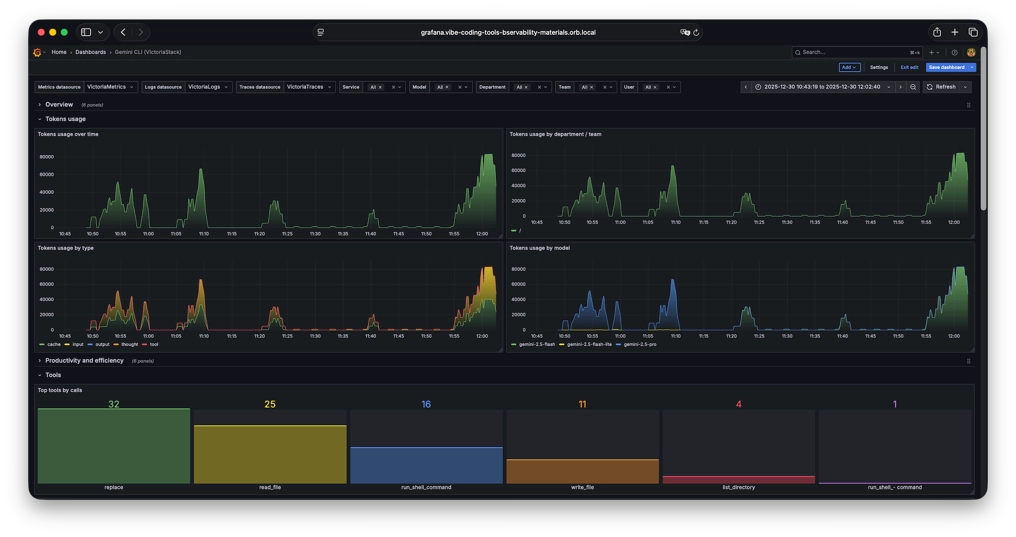
I haven’t found good publicly available dashboards, so I decided to create them.
These dashboards are available in the VictoriaMetrics-Community/vibe-coding-dashboards GitHub repository and on Grafana dashboards.
- Claude Code
- OpenAI Codex
- Google Gemini
- Qwen Code
These dashboards contain a lot of information, but of course, they don’t cover all needs. So if you are missing any information or see any errors, we welcome pull requests. You can also use the dashboard as a basis for your own dashboards, tailored to your specific requirements and scenarios.
Conclusion
#
The convergence of AI-powered coding tools and modern observability standards creates exciting opportunities to understand and optimize our development workflows. All major vibe coding tools now speak OpenTelemetry, and the VictoriaMetrics Stack provides a cost-effective, high-performance backend for storing and analyzing the resulting telemetry.
For tracking personal token usage, managing team costs, or implementing enterprise governance, the combination of OpenTelemetry and VictoriaMetrics gives you the visibility you need:
- Near-real-time usage analytics
- Performance and reliability dashboards
- Cost and token burn monitoring
- Deep debugging via structured tool events and traces
- Cost-effective and scalable observability backend
- and much more!
Start with basic token and cost tracking, then expand into tool usage analytics, performance monitoring, and productivity metrics as your needs evolve. The observability infrastructure you build today will serve you well as AI coding tools become ever more central to software development.
Happy vibe coding!
Leave a comment below or Contact Us if you have any questions!
comments powered by Disqus