- Blog /
- How to use VictoriaMetrics for monitoring with Netdata Agent
How to use VictoriaMetrics for monitoring with Netdata Agent
Share:


What is Netdata Agent?
#
Netdata Agent is an open-source monitoring agent capable of collecting metrics from various sources and visualizing them in real-time. It is able to discover and collect metrics with zero configuration, providing a quick and easy way to monitor systems.
What are the strengths of Netdata Agent?
#
It is extremely easy to set up Netdata Agent and start observing system metrics. With zero configuration, the agent is already able to discover host system metrics, visualize them in real-time, provide alerting and anomaly detection. Netdata Agent is also capable of discovering and collecting metrics from popular Prometheus exporters.
Why should I use VictoriaMetrics as a long-term storage for Netdata Agent metrics?
#
While Netdata Agent is great for real-time monitoring, using VictoriaMetrics as a long-term storage for Netdata Agent metrics allows to:
- Efficiently store collected metrics for long-term period;
- Make use of VictoriaMetrics’ features like downsampling and retention filters to make it easier to work with long-term data;
- Use Netdata Agent metrics as part of a centrally managed monitoring system with alerting and authentication managed within the same ecosystem;
- Use MetricsQL to query Netdata Agent metrics together with other data sources.
How to set up VictoriaMetrics as a long-term storage for Netdata Agent metrics?
#
As a prerequisite, it is needed to have Netdata Agent installed and running. Please, refer to Netdata Agent documentation for installation instructions.
VictoriaMetrics can receive metrics from Netdata Agent in two ways: by using remote write or by using vmagent to scrape metrics from Netdata Agent.
Using remote write
#
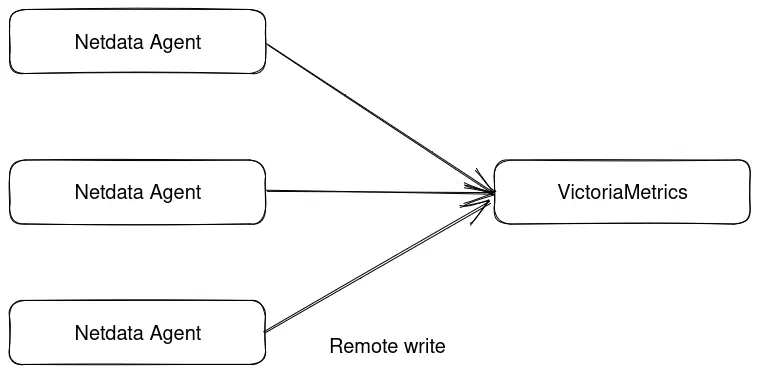
In order to enable remote write in Netdata Agent, add the following to Netdata Agent configuration
file (can be accessed by using ./edit-config exporting.conf in Netdata Agent configuration directory):
For VictoriaMetrics single-node:
[prometheus_remote_write:my_instance]
enabled = yes
destination = victoriametrics:8429
remote write URL path = /api/v1/write
For VictoriaMetrics cluster:
[prometheus_remote_write:my_instance]
enabled = yes
destination = vminsert:8480
remote write URL path = /insert/0/api/v1/write
Please, note URL format for cluster version uses /insert/<accountID> prefix.
<accountID> is used to route metrics to the corresponding tenant in VictoriaMetrics cluster.
Please, refer
to VictoriaMetrics URL format documentation
for details.
Do not forget to replace victoriametrics or vminsert with the actual hostname of VictoriaMetrics instance.
This will instruct Netdata Agent to send metrics to VictoriaMetrics on port 8429 (single-node) or 8480 (cluster) using
Prometheus remote write protocol.
Note that there are the following limitations when using remote write:
- The remote write exporting connector does not support buffer on failures. This means that if VictoriaMetrics is down, Netdata Agent will not be able to send metrics to it and will drop them instead. See notes on buffer on failures.
- By default, Netdata Agent collects metrics with 1s interval. It can be changed by using this guide on how to optimize Netdata Agent’s performance.
In order to improve reliability of metrics delivery it is possible to use vmagent as remote write target. See How to push data to vmagent docs for details.
Using vmagent to scrape metrics from Netdata Agent
#
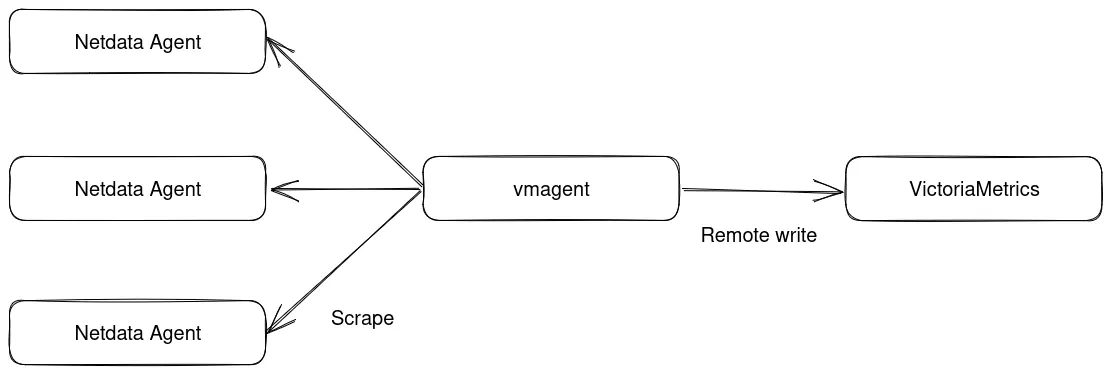
In order to use vmagent to scrape metrics from Netdata Agent, it is needed to add the following to vmagent configuration file:
   - job_name: 'netdata'
     metrics_path: /api/v1/allmetrics
     params:
       format: [ prometheus ]
     static_configs:
       - targets:
           - 'netdata:19999'
           - 'netdata2:19999'
           - 'netdata3:19999'
Where netdata is the hostname of Netdata Agent instance.
Using vmagent to scrape metrics from Netdata Agent allows to use data buffering feature of vmagent, which means that if VictoriaMetrics is not reachable, vmagent will buffer metrics and send them to VictoriaMetrics once it will become reachable again.
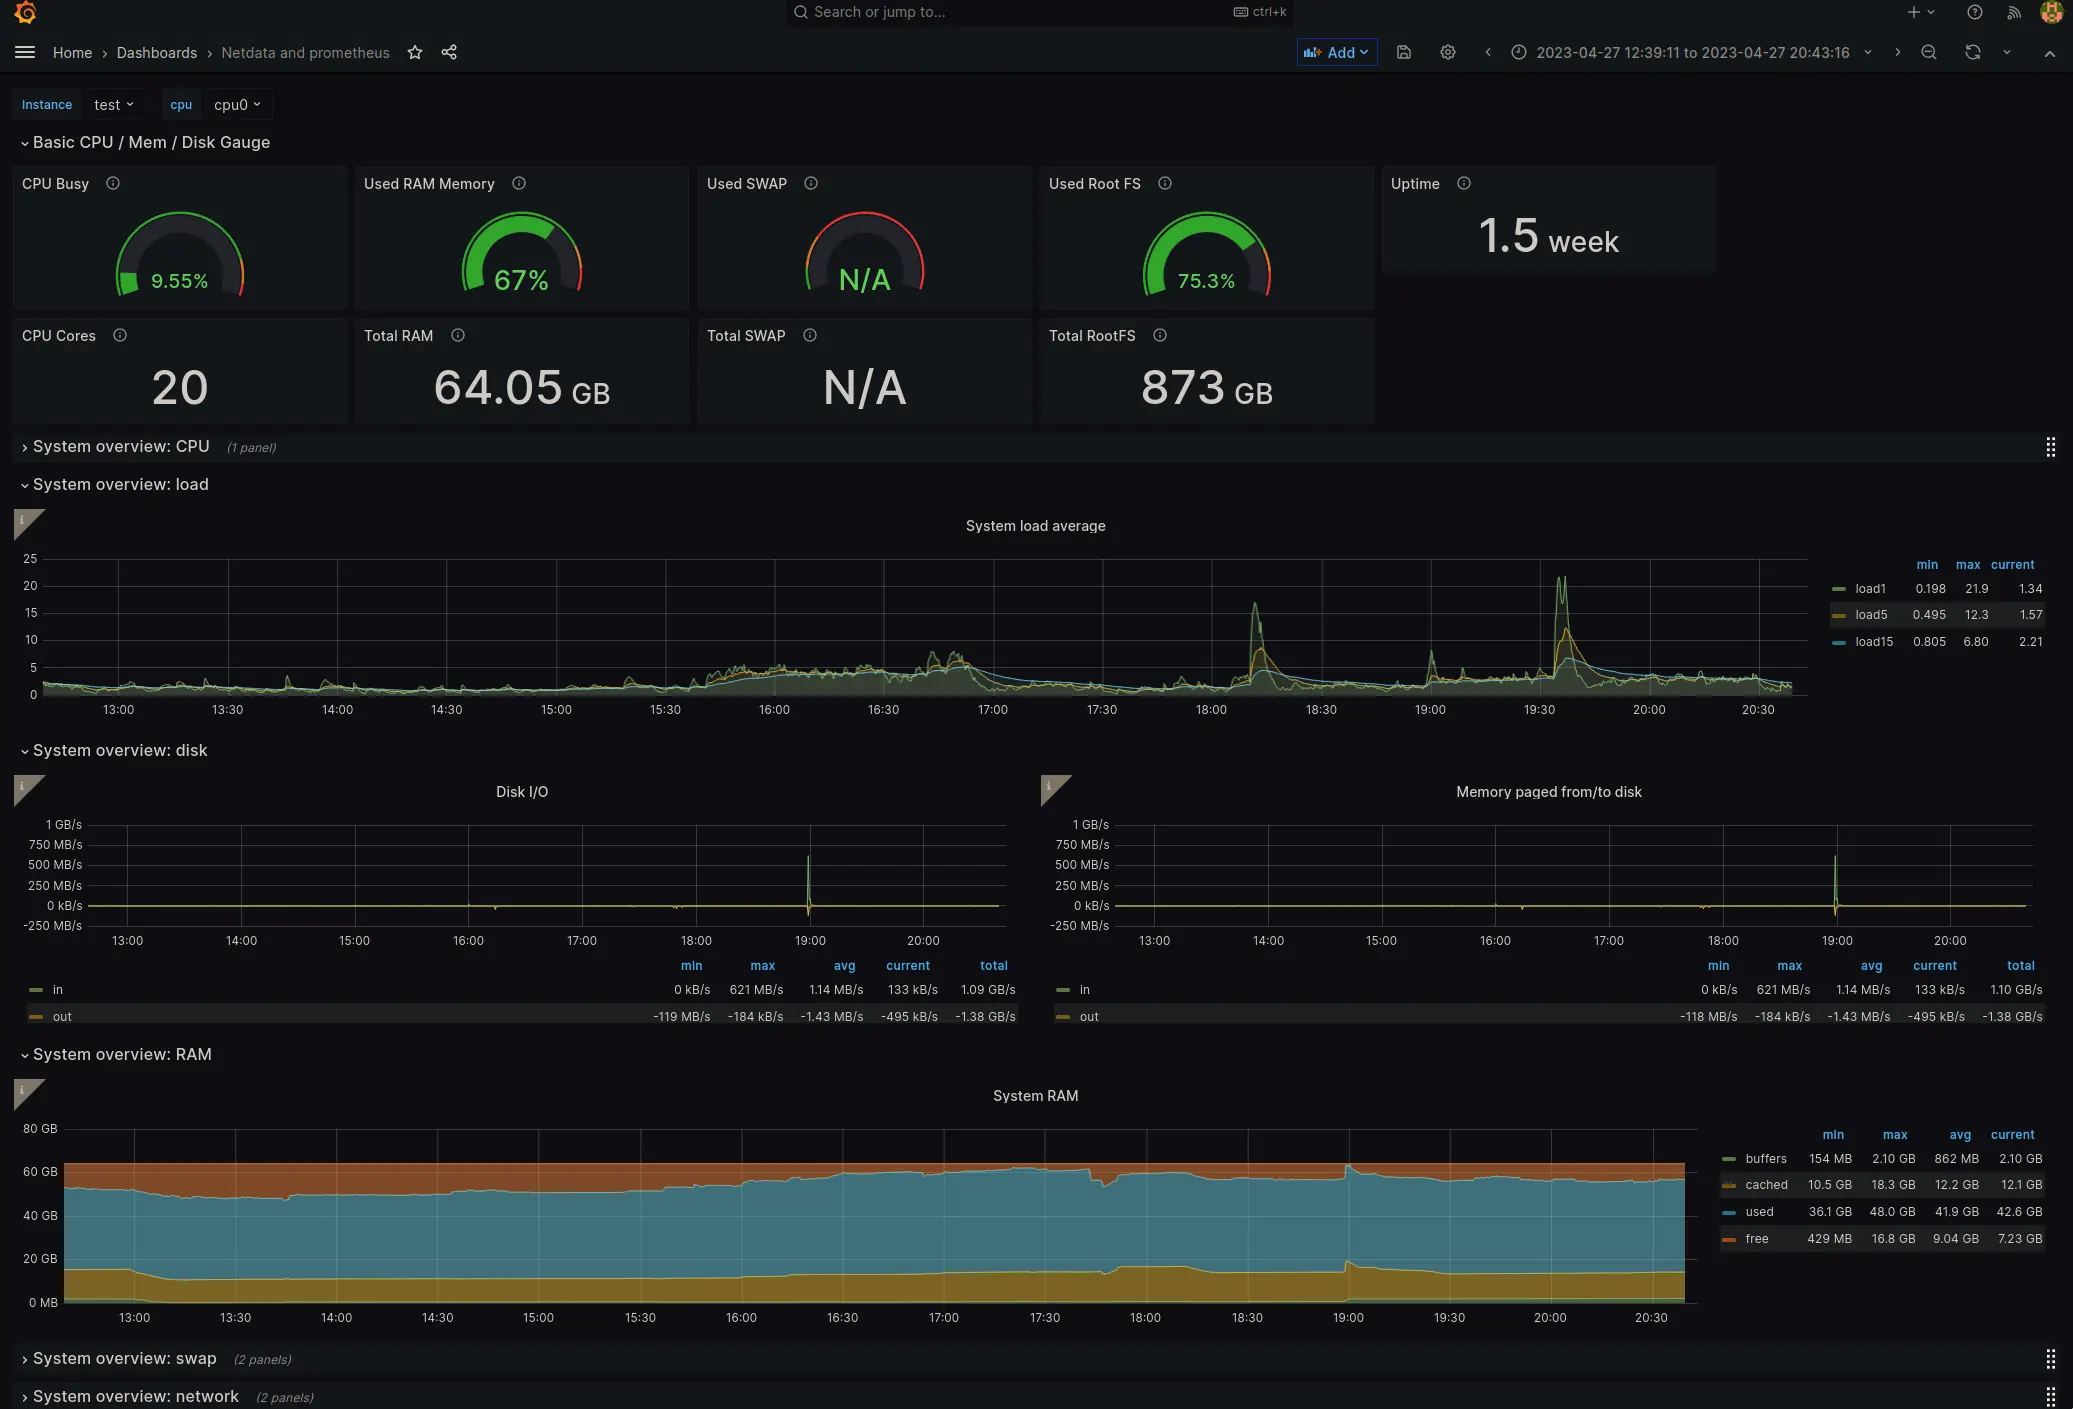
How to set up Grafana to visualize Netdata metrics?
#
Once Netdata Agent metrics in VictoriaMetrics, Grafana can be used to visualize them. In order to do that, it is needed to add VictoriaMetrics as a data source in Grafana and then import Netdata Agent dashboard from Grafana dashboard repository.
Using Netdata Agent metrics for alerting
#
Metrics from Netdata Agent can be used for alerting via vmalert. For example, the following vmalert config can be used to get basic alerts on Netdata Agent metrics (rules from this guide)
groups:
  - name: nodes
    rules:
      - alert: node_high_cpu_usage_70
        expr: sum(sum_over_time(netdata_system_cpu_percentage_average{dimension=~"(user|system|softirq|irq|guest)"}[10m])) by (job) / sum(count_over_time(netdata_system_cpu_percentage_average{dimension="idle"}[10m])) by (job) > 70
        for: 1m
        annotations:
          description: '{{ $labels.job }} on ''{{ $labels.job }}'' CPU usage is at {{ humanize $value }}%.'
          summary: CPU alert for container node '{{ $labels.job }}'

      - alert: node_high_memory_usage_70
        expr: 100 / sum(netdata_system_ram_MB_average) by (job)
          * sum(netdata_system_ram_MB_average{dimension=~"free|cached"}) by (job) < 30
        for: 1m
        annotations:
          description: '{{ $labels.job }} memory usage is {{ humanize $value}}%.'
          summary: Memory alert for container node '{{ $labels.job }}'

      - alert: node_low_root_filesystem_space_20
        expr: 100 / sum(netdata_disk_space_GB_average{family="/"}) by (job)
          * sum(netdata_disk_space_GB_average{family="/",dimension=~"avail|cached"}) by (job) < 20
        for: 1m
        annotations:
          description: '{{ $labels.job }} root filesystem space is {{ humanize $value}}%.'
          summary: Root filesystem alert for container node '{{ $labels.job }}'

      - alert: node_root_filesystem_fill_rate_6h
        expr: predict_linear(netdata_disk_space_GB_average{family="/",dimension=~"avail|cached"}[1h], 6 * 3600) < 0
        for: 1h
        labels:
          severity: critical
        annotations:
          description: Container node {{ $labels.job }} root filesystem is going to fill up in 6h.
          summary: Disk fill alert for Swarm node '{{ $labels.job }}'
Conclusion
#
Netdata Agent is a great tool for infrastructure and applications monitoring. It is easy to install and use, and it provides a lot of useful metrics out of the box. It also discovers a lot of metrics automatically, so it is not needed to configure anything to start collecting them.
Using it with VictoriaMetrics allows to store metrics in a centralized place and use them for alerting and visualization with the same tools as for other metrics from various source.
Leave a comment below or Contact Us if you have any questions!
comments powered by Disqus