- Blog /
- Performance optimization techniques in time series databases: strings interning

Performance optimization techniques in time series databases: strings interning
Share:


This blog post is also available as a recorded talk with slides.
Table of Contents
Performance optimization techniques in time series databases:
- Strings interning (you are here);
- Function caching;
- Limiting concurrency for CPU-bound load;
- sync.Pool for CPU-bound operations.
VictoriaMetrics is an open-source time-series database (TSDB) written in Go, and I’ve had the pleasure of working on it for the past couple of years. TSDBs have stringent performance requirements, and building VictoriaMetrics has taught me a thing or two about optimization. In this blog post, I’ll share some of the performance tips I’ve learned during my time at VictoriaMetrics. You’ll get the most out of this post if you know a little Go, but you don’t need a background in TSDBs! The tips in this post should apply to any performance-sensitive application, and many of them apply beyond Go as well.
An intro to time-series databases
#
Before we can talk about optimizations for TSDBs, we need to take a look at what they are, and what problems they try to solve. In this section, we’ll cover some background on TSDBs in order to put the optimizations that we’ll later talk about into perspective.
Metrics
#
 An example metric that you might store in a TSDB
In VictoriaMetrics, the data model is centered around the concept of a metric. A metric is an observation of some value at some point in time. The image above shows an example metric that collects information on a Go installation. Metrics consist of the following parts:
Name- The name of the metric describes what this metric measures.Metadata- Information about the metric represented as label-value pairs.Value- The observation itself.Timestamp- The time the observation was recorded.
A combination of a metric name and its metadata defines a time series. In the real world, one could expect millions of unique time series to be processed and stored in a TSDB for a moderate load.
VictoriaMetrics provides a component vmagent, a metric collector.
Metric collectors periodically collect time series from your services or other targets and forward them on to a TSDB.
The collector visits a /metrics endpoint for each target to gather the metrics that target exposes.
For example, visiting http://service:port/metrics may yield the following time series:
go_gc_duration_seconds{quantile="0"} 7.3744e-05
go_gc_duration_seconds{quantile="0.25"} 0.000110502
go_gc_duration_seconds{quantile="0.5"} 0.000123689
go_gc_duration_seconds{quantile="0.75"} 0.00015938
go_gc_duration_seconds{quantile="1"} 0.004539404
go_goroutines 103
go_info{version="go1.16.4"} 1
go_memstats_alloc_bytes 1.0304216e+08
go_memstats_alloc_bytes_total 1.423416806112e+12
The above metrics are in “Prometheus exposition format”, a great, human-readable format popularized by Prometheus.
Workloads
#
Before optimizing an application, it’s critical to understand its workload. If you optimize for reads, but your application is write-heavy, then you won’t see a significant gain, and may even see a performance drop.
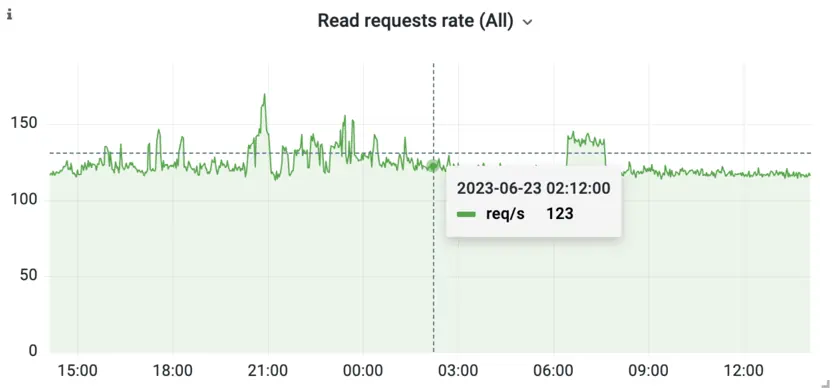
In the case of TSDBs, the workload is usually very write-heavy. It’s not uncommon for TSDBs to have to deal with millions of writes per second, while there are usually orders of magnitude fewer reads. Take a look at the following two graphs:
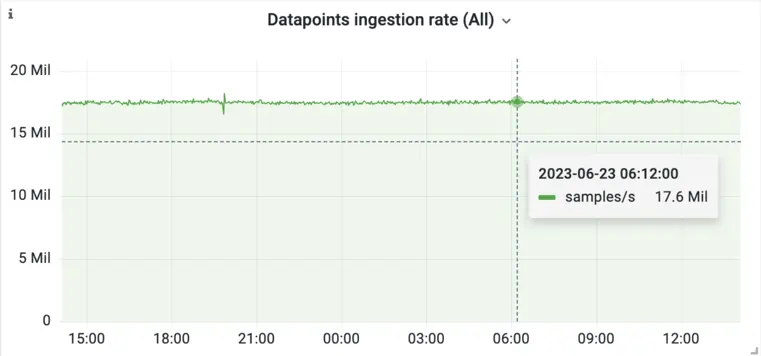
While 17 million ingested samples/s might seem like a lot, this example isn’t the biggest installation we have seen. Production applications generate a lot of data! The tremendous load that TSDBs see is a strong incentive to put work into optimization.
The other thing to notice in the above graphs is that reads are very unpredictable and sporadic. While writes represent consistent load generated by machines, reads may be triggered by humans which adds a degree of randomness to the load graph.
How can we build a system that is capable of dealing with this immense workload? The vast majority of the performance of a TSDB comes from its write-system design. VictoriaMetrics follows a few important principles in its design:
- Log Structured Merge (LSM) data structure - LSMs are data structures that take into account the storage medium they are implemented on. They can help prevent write amplification, which could easily saturate even the fastest storage mediums.
- Column-oriented storage - Storing each column of your data separately allows you to sort and compress your data separately, both of which enable optimizations that aren’t available with row-oriented storage.
- Append-only writes - In general, the data that TSDBs store has already happened in time, and it’s likely that it will never change. For example, the weather forecast is unlikely to be updated in the past. This principle allows you to use data structures that are append-only. Append-only data structures trade flexibility for extra write speed.
System-level design is not something that most teams can apply when optimizing their applications. Chances are, you’re working on an existing codebase that isn’t a TSDB and so the above optimizations don’t really apply to you.
Don’t worry! In the rest of this article, you’ll find out about non-design-specific optimizations. These are things that you can apply to your codebase no matter its age or domain.
String interning
#
Metric metadata, consisting of the label-value pairs from earlier, is represented in VictoriaMetrics as a string. This gives users a lot of flexibility, as they can represent anything in metadata and introduce new labels and values whenever they like. In practice, however, metadata strings don’t change that often, creating a lot of repetition during collection.
Take, for example, the go_info metric from earlier. Its metadata had a Go version label-value pair.
There are only so many potential Go versions, and it’s unlikely that the version of Go being used changes very often.
But each time we collect this metric from our applications, we need to parse its metadata and allocate it in the memory
until it is garbage-collected.
Taking into account this metric could be exposed by not one, but by thousands of applications, the metrics collector
will have to parse and allocate in memory same strings over and over!
To avoid storing the same string lots of times, what if we stored each unique string once and referred to it when we needed to? This is called string interning and it can save a significant chunk of memory:
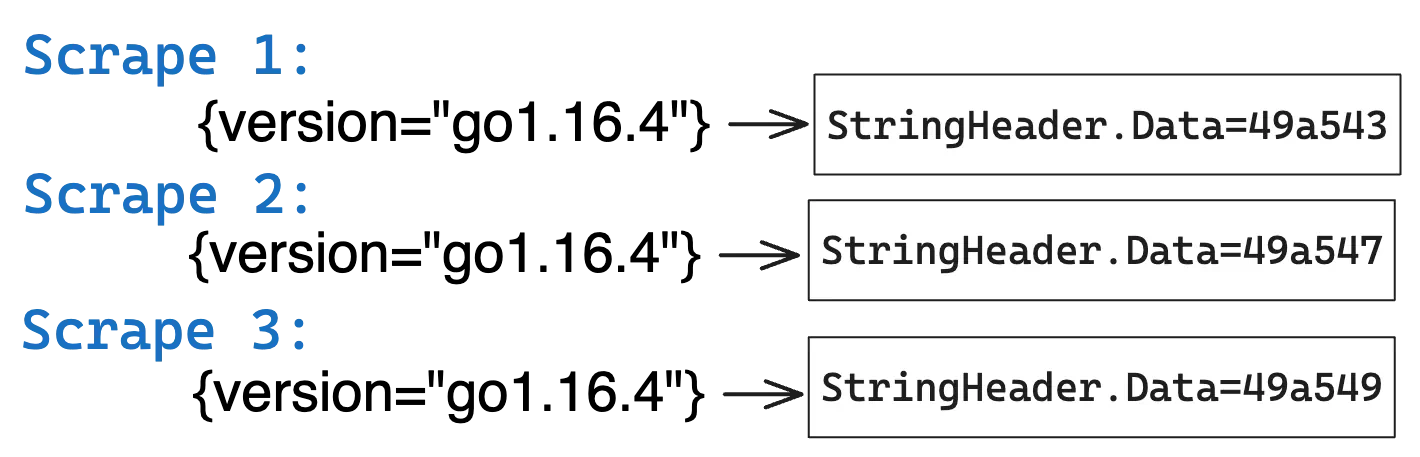
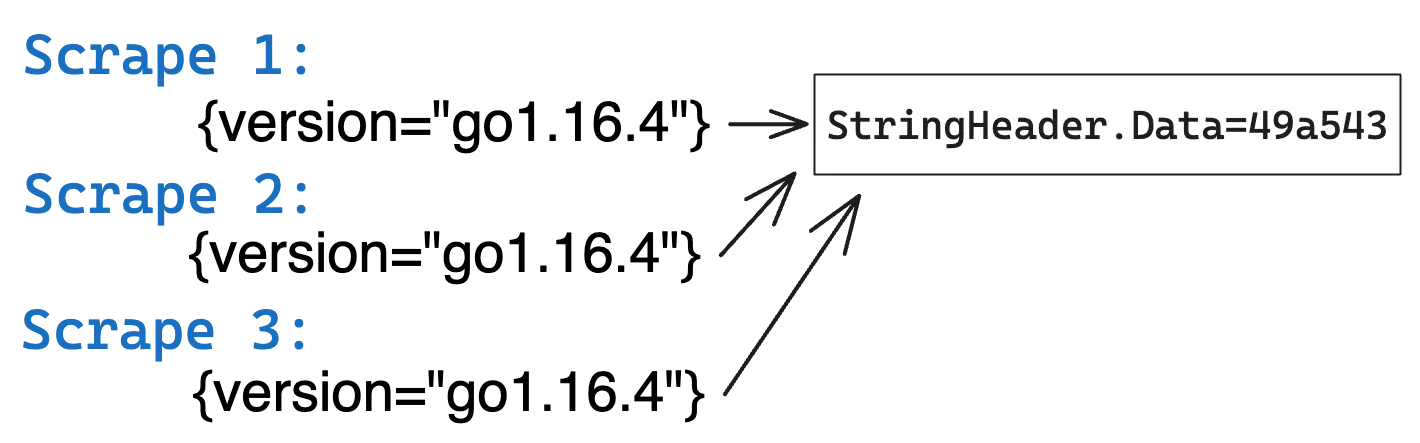
In the above image, vmagent sees the same metadata string across multiple scrapes.
In the left image, three copies of the same string are stored in memory, but in the right image only
a single copy of the string is stored in memory. This allows saving memory by 3x.
The naive implementation of string interning uses a map, and it might look something like the code below:
var internStringsMap = make(map[string]string)

func intern(s string) string {
     m := internStringsMap
     if v, ok := m[s]; ok {
         return v
     }
     m[s] = s
     return s
}
This example works great for a single-threaded application, but vmagent has many threads that work across
many targets concurrently. It’s possible to add a lock to the intern function,
but that doesn’t scale nicely on multi-core systems as there is likely to be a lot of contention when accessing this map.
The solution to interning across multiple threads is to use sync.Map, a thread-safe implementation built into the Go standard library.
var internStringsMap  sync.Map

func intern(s string) string {
    m := &internStringsMap
    interned, _ := m.LoadOrStore(s, s)
    return interned.(string)
}
The best part is that sync.Map simplifies our original code! It comes with a LoadOrStore method that means
we no longer need to check whether the string is already present in the map ourselves.
sync.Map is optimized for two use cases:
- When a given key is only ever written once, but used many times, i.e., the cache has high hit ratio.
- When multiple goroutines read, write and overwrite entries for disjoint sets of keys, i.e., each goroutine uses a different set of keys.
Whenever either of these two cases applies, sync.Map reduces lock contention and improves the performance
of your application compared to if you’d used a regular Go map paired with a Mutex or RWMutex.
There are a couple of “gotchas” that you should be aware of when using sync.Map.
The map will grow over time
#
Unconstrained memory growth is dangerous. To prevent the map from growing infinitely, you need to either occasionally rotate the map by deleting it and recreating it, or implement some form of time to live (TTL) logic for your keys.
Sanity check the arguments to intern
#
The intern function performs really well when passing regular strings, but unless you lock down the interface,
someone will eventually try to pass something that might break your function.
For example, in Go, byte slices are mutable. This means they could change at any time and are not suitable for use as a key in your map. This is usually a case of using “unsafe conversion to string”, a common optimization in Go. And, in the same time, the most common source of bugs.
Summary
#
In general, when implementing string interning, it’s a good idea to clone the strings that are passed to your function. This can help you get rid of some subtle bugs.
VictoriaMetrics uses string interning to reduce memory usage while parsing metric metadata. It’s a powerful technique that works best with read-intensive workloads that have few variants in the potential strings you see.
Stay tuned for the new blog post in this series!
Leave a comment below or Contact Us if you have any questions!
comments powered by Disqus