- Blog /
- Troubleshooting Time Series Databases: Where Did My Metrics Go?
Troubleshooting Time Series Databases: Where Did My Metrics Go?
Share:


Where Are My Metrics?
#
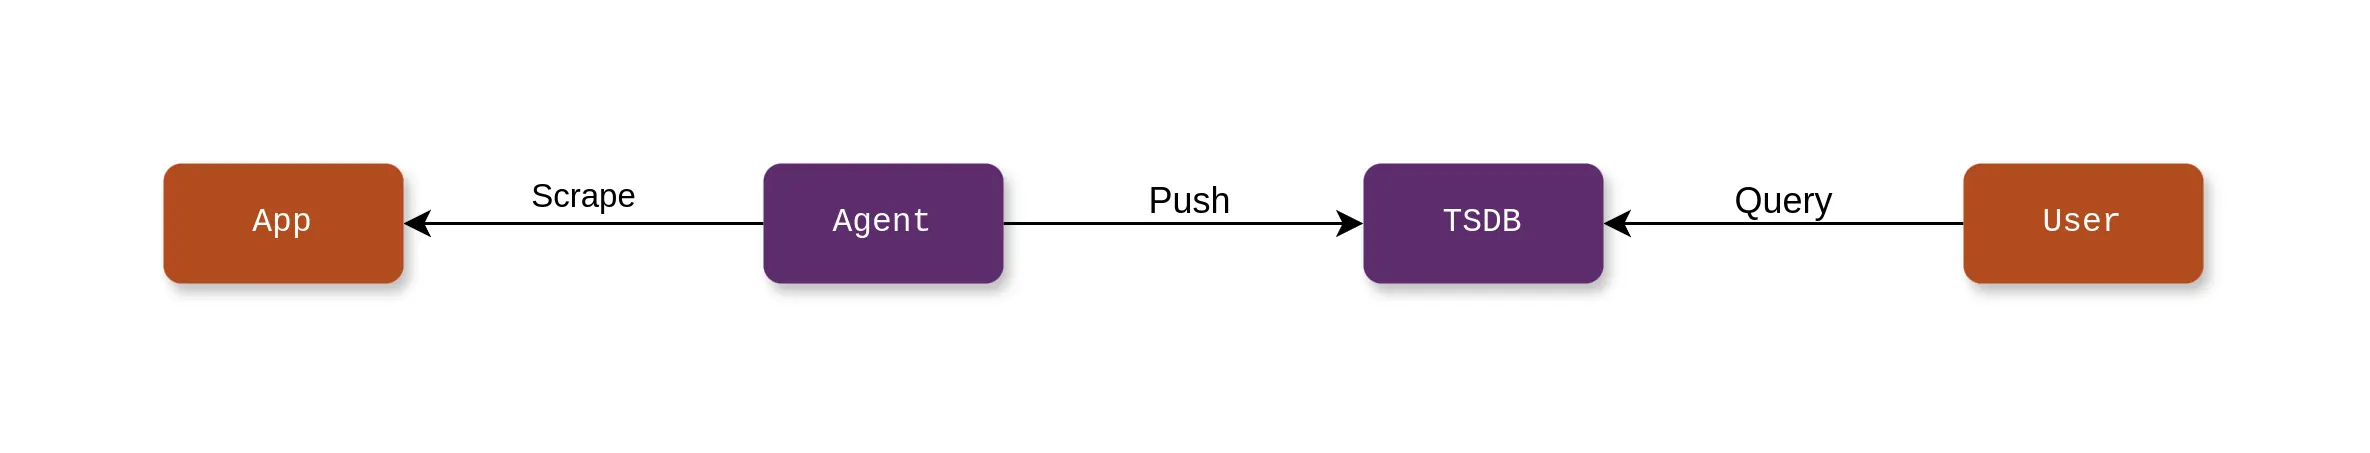
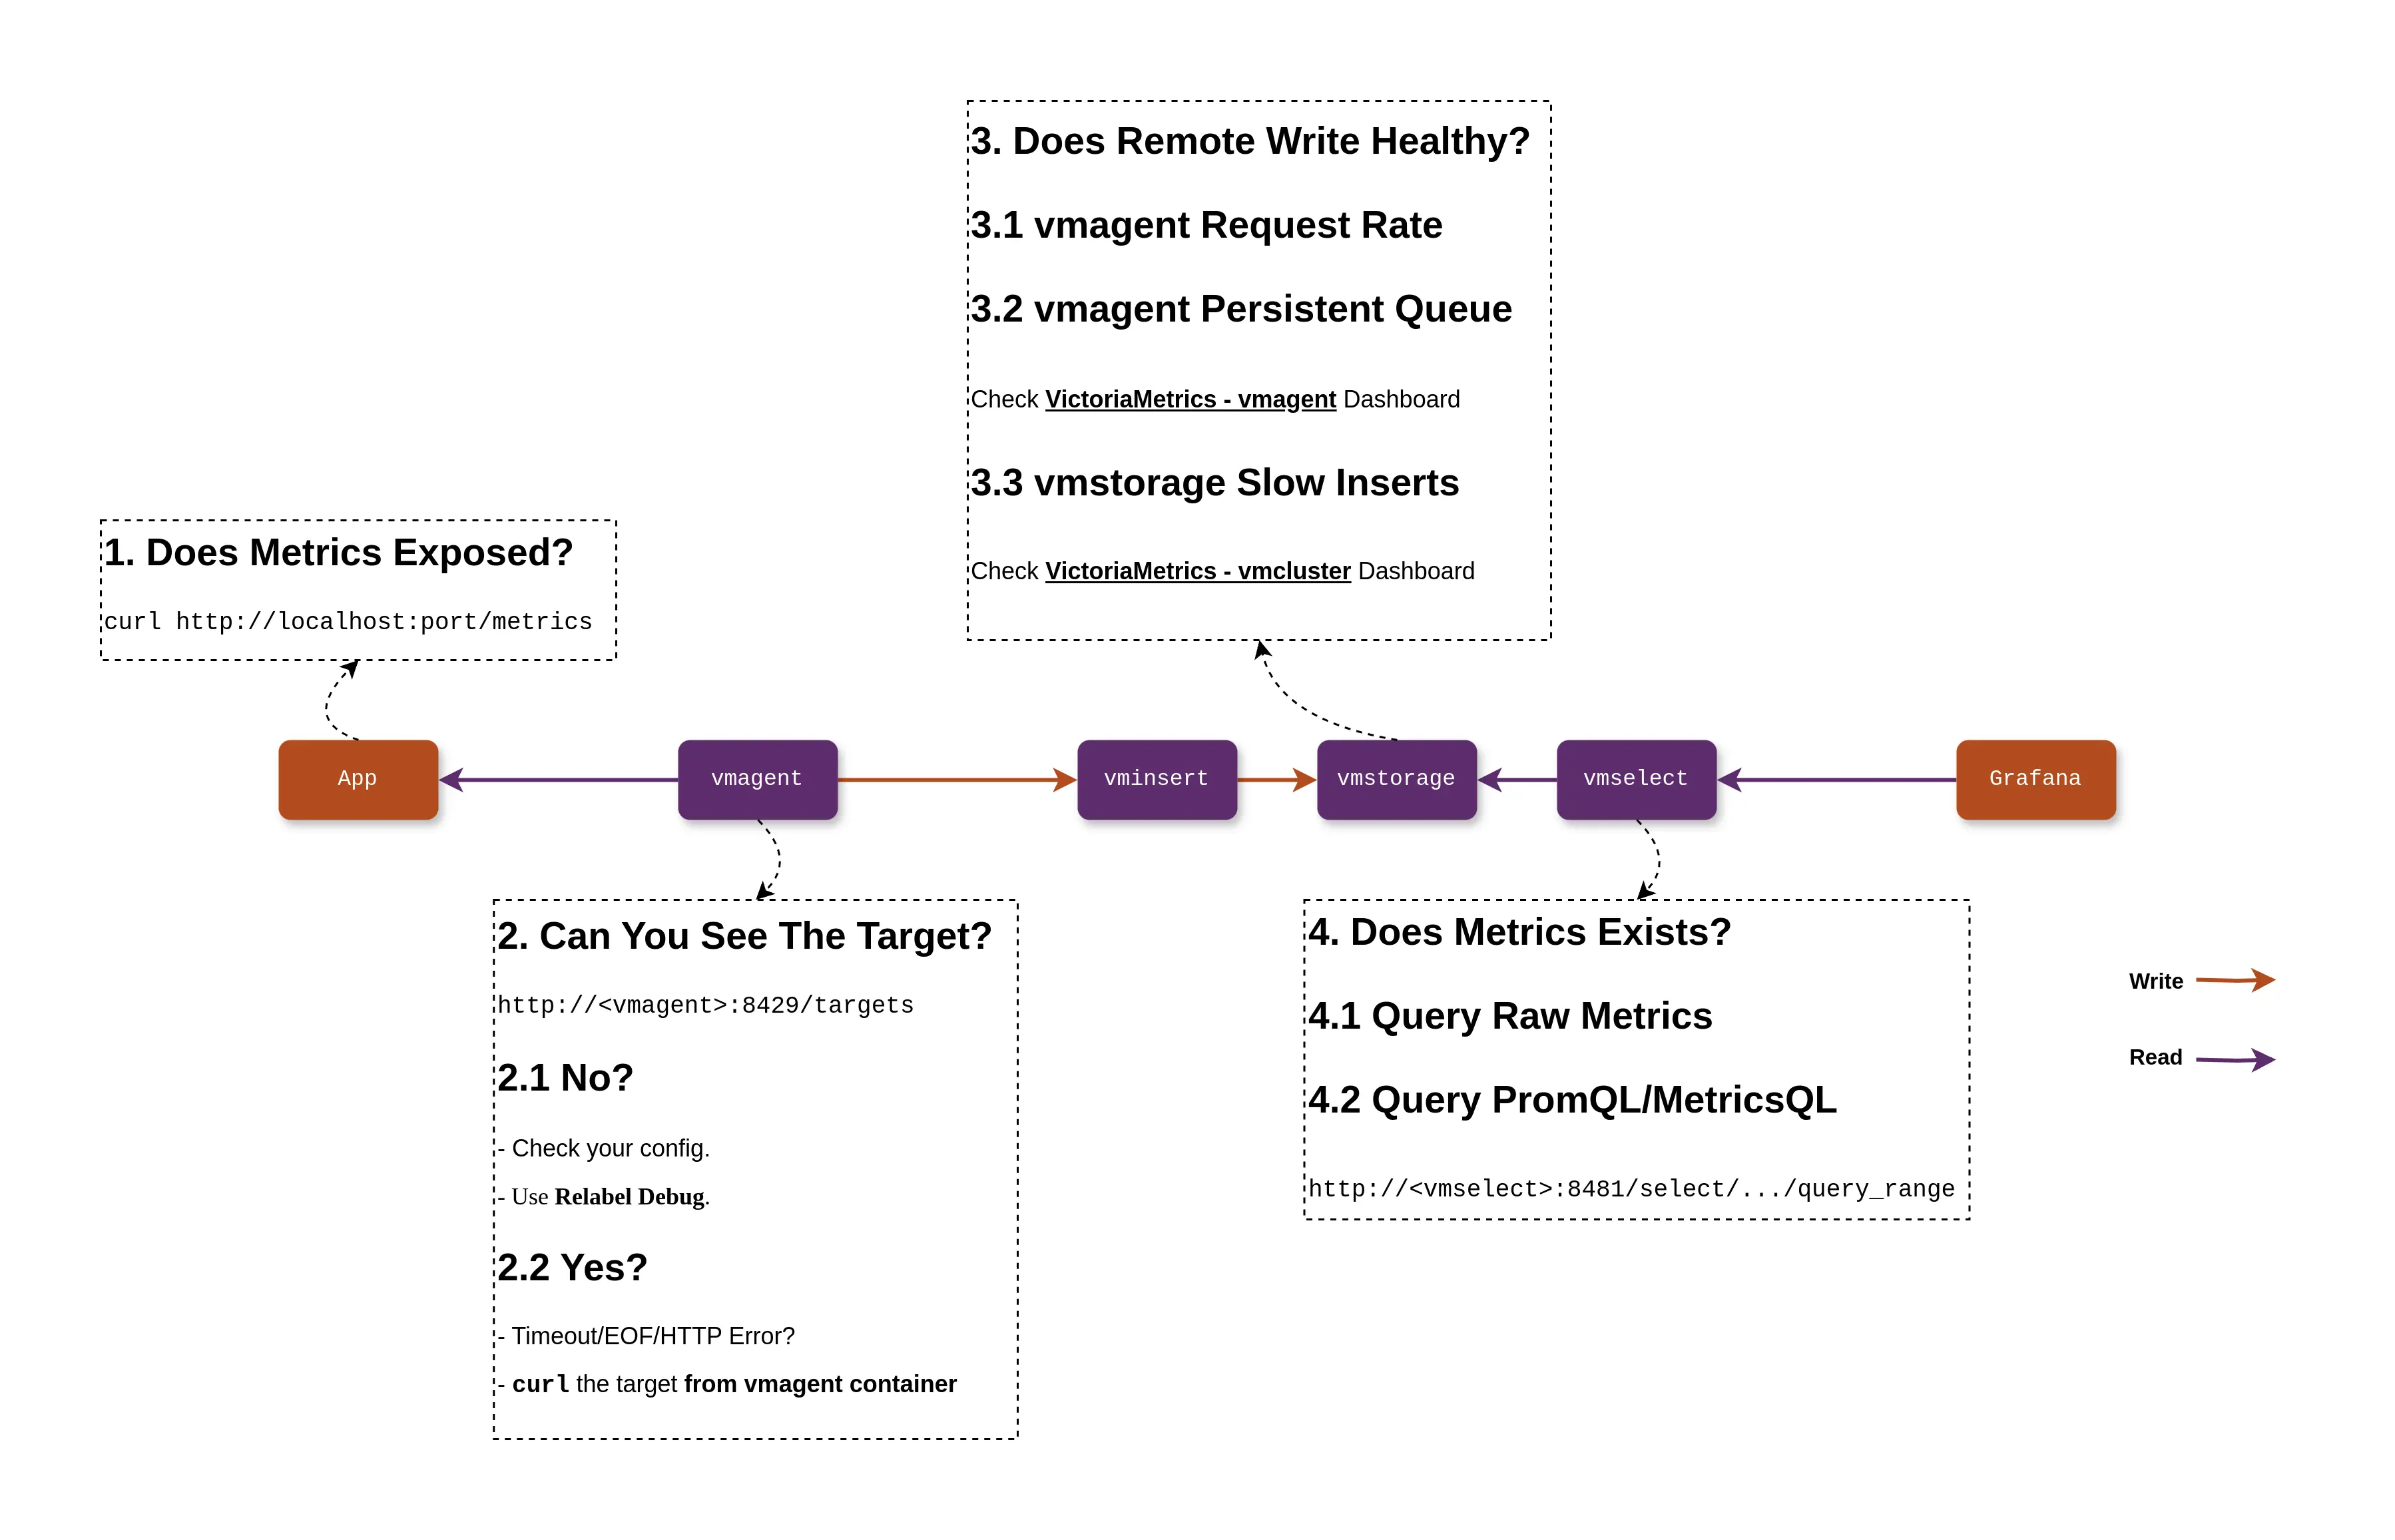
Complex modern applications rely heavily on observability, and metric monitoring is a crucial part of observability. The most common process of metric monitoring, which includes data scraping, processing, storage, and visualization, can be summarized in the diagram below:
If an issue arises, for example, when users ask, “I have already recorded metrics in the application, why can’t I see my metrics on Grafana?”, how should we troubleshoot it? In this blog, I will take VictoriaMetrics as an example and use its built-in tools to investigate this issue. Of course, you can apply the same troubleshooting approach to Prometheus as they are highly compatible.
Data Scraping
#
Data scraping issues typically occur in these areas: the applications that expose metrics, vmagent that scrapes metrics, and the network between them.
For the application, the first step is to check if the monitoring metrics are being exposed correctly. This can be done by accessing the metrics’ HTTP endpoint (for example, curl http://IP:Port/metrics). If everything is working fine, you should be able to see the following content:
test_histogram_seconds_bucket{label_1="bar",vmrange="1.896e+00...2.154e+00"} 7192
test_histogram_seconds_sum{label_1="bar"} 14384
test_histogram_seconds_count{label_1="bar"} 7192
test_histogram_seconds_bucket{label_1="foo",vmrange="8.799e-01...1.000e+00"} 7192
test_histogram_seconds_sum{label_1="foo"} 7192
test_histogram_seconds_count{label_1="foo"} 7192
go_sched_latencies_seconds_bucket{le="0"} 0
go_sched_latencies_seconds_bucket{le="2.56e-07"} 80
...
If you are unable to see this monitoring data, you need to debug your application. You can typically refer to the Prometheus SDK documentation, or its lightweight alternative, the metrics package, along with this Go language example for guidance.
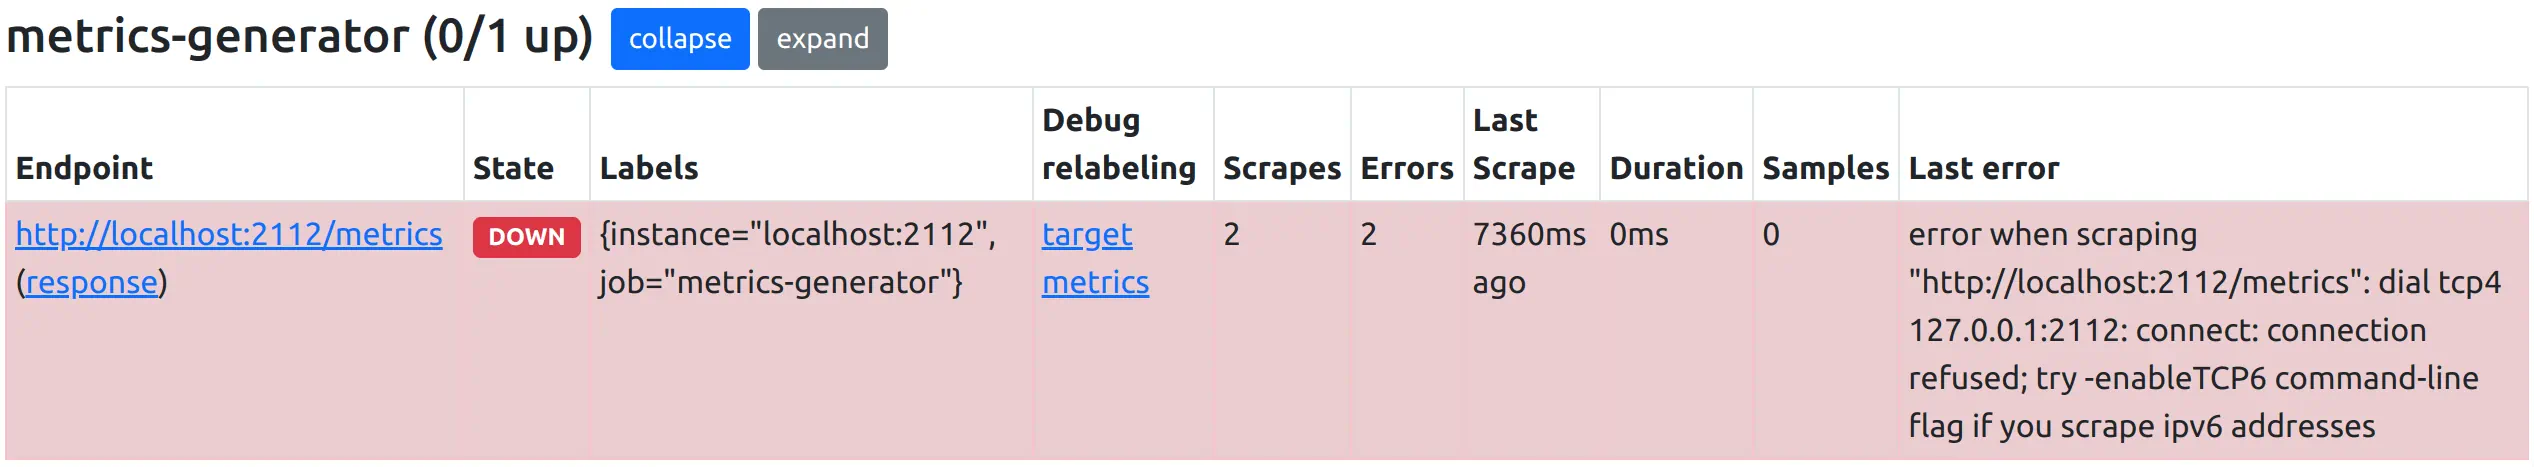
Alright, once the application is functioning properly, we need to check if vmagent is scraping data. vmagent provides a very convenient WebUI (http://<vmagent>:8429/) to assist with this. From the target page, you can find all the scrape targets, which should ideally look like this under normal circumstances:
At this point, the most common issues could be:
- Unable to find the corresponding Target (whether it is Healthy or Unhealthy);
- The corresponding Target is in an Unhealthy state.
If your target is not found, it might not have been discovered by service discovery or it could have been dropped by a relabeling rule after service discovery. vmagent’s built-in Relabel Debug feature can effectively help you confirm the issue (see the image below).
If the corresponding target is in an Unhealthy state, the reasons could be:
- Network connectivity issues between vmagent and the application.
- Timeout due to the application exposing a huge number of metrics.
You can typically observe the specific error reasons on the WebUI of vmagent.
I recommend users to manually access the scrape target from the environment where vmagent is located (e.g., the Container / Pod / Node where vmagent is running) to check if the response matches the error reasons. If they match, then debugging of network issues (using iptables, Kubernetes Service, etc.) may be necessary.
Remote Write
#
When you can’t find issues at the data scraping end, you will surely wonder if the data has actually been sent to the storage end (VictoriaMetrics Single-Node/Cluster).
The first thing to consider is whether the vmagent’s remote write is functioning correctly. We need to observe some metrics exposed by vmagent to determine this. The following screenshot is from the Grafana Dashboard provided by VictoriaMetrics. It describes the data transfer status for each Remote-Write Target:
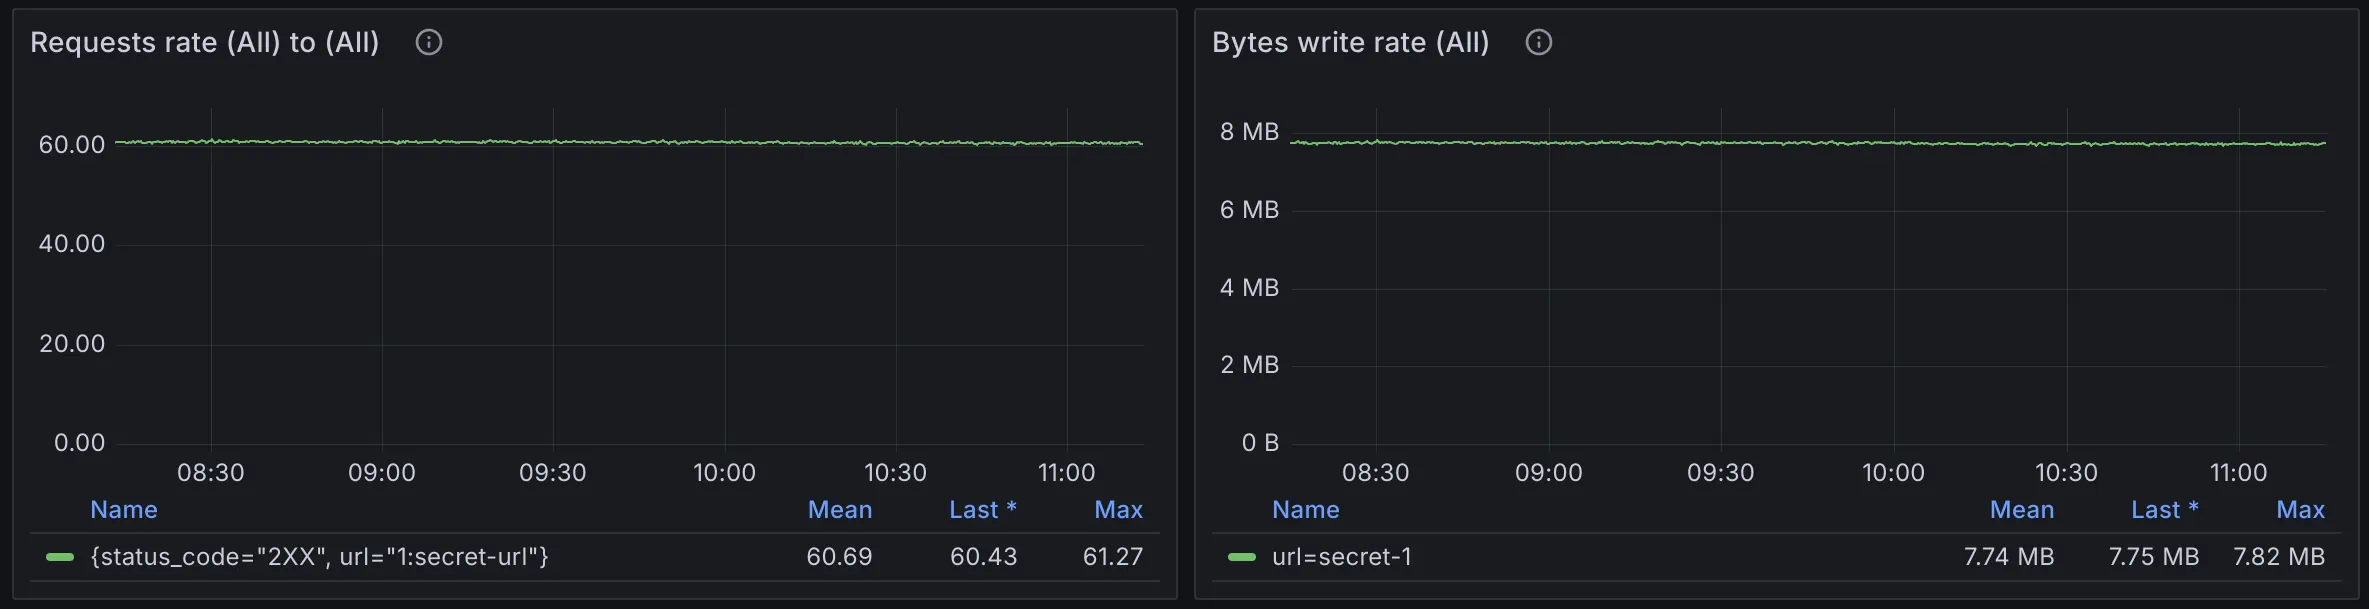
If you haven’t configured the VictoriaMetrics Grafana Dashboard yet, you can also try the following query:
sum(rate(vmagent_remotewrite_requests_total{}[1m])) by(url, status_code) > 0
sum(rate(vmagent_remotewrite_conn_bytes_written_total{}[1m]))> 0
These metrics can indicate the network conditions of remote write, such as 401 Unauthorized status code for wrong auth settings, or network being unreachable.
You can find more suggestions in the Monitoring section of the Quick Start on how to monitor all VictoriaMetrics components.
I still recommend importing the Grafana Dashboard as soon as you have set up VictoriaMetrics because it includes monitoring metrics for various components of VictoriaMetrics. This can significantly reduce the time needed to troubleshoot issues. The monitoring metrics mentioned later in this article will also be introduced based on the Grafana Dashboard.
Another issue that may occur on the vmagent side is remote write queue blockage. Similarly, this can be identified by observing the vmagent_remotewrite_pending_data_bytes metric:
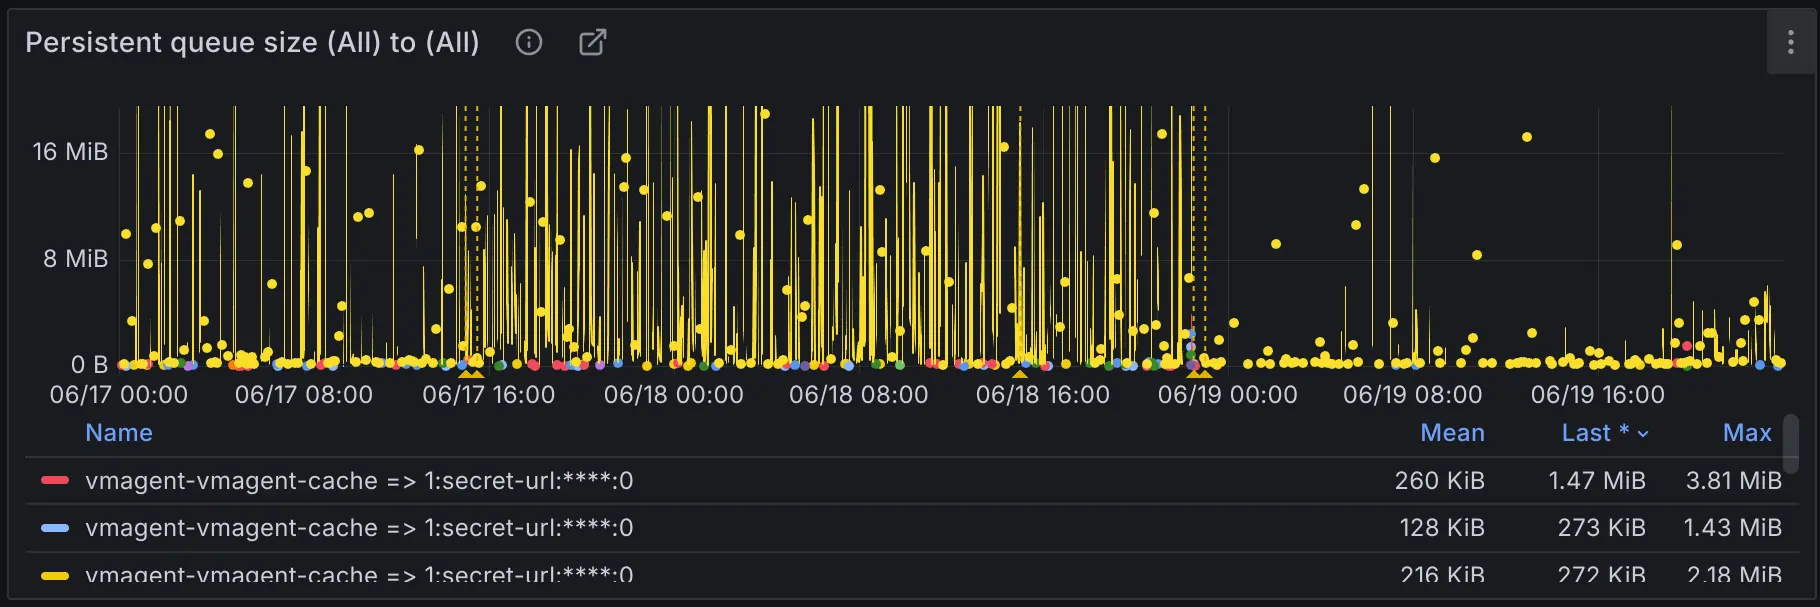
This issue can result in data scraped by vmagent not being promptly sent to the remote write target, thus preventing users from querying their metrics in real-time. Possible reasons:
- The remote write target cannot support the amount of current data ingestion.
- Insufficient network bandwidth between vmagent and the remote write target.
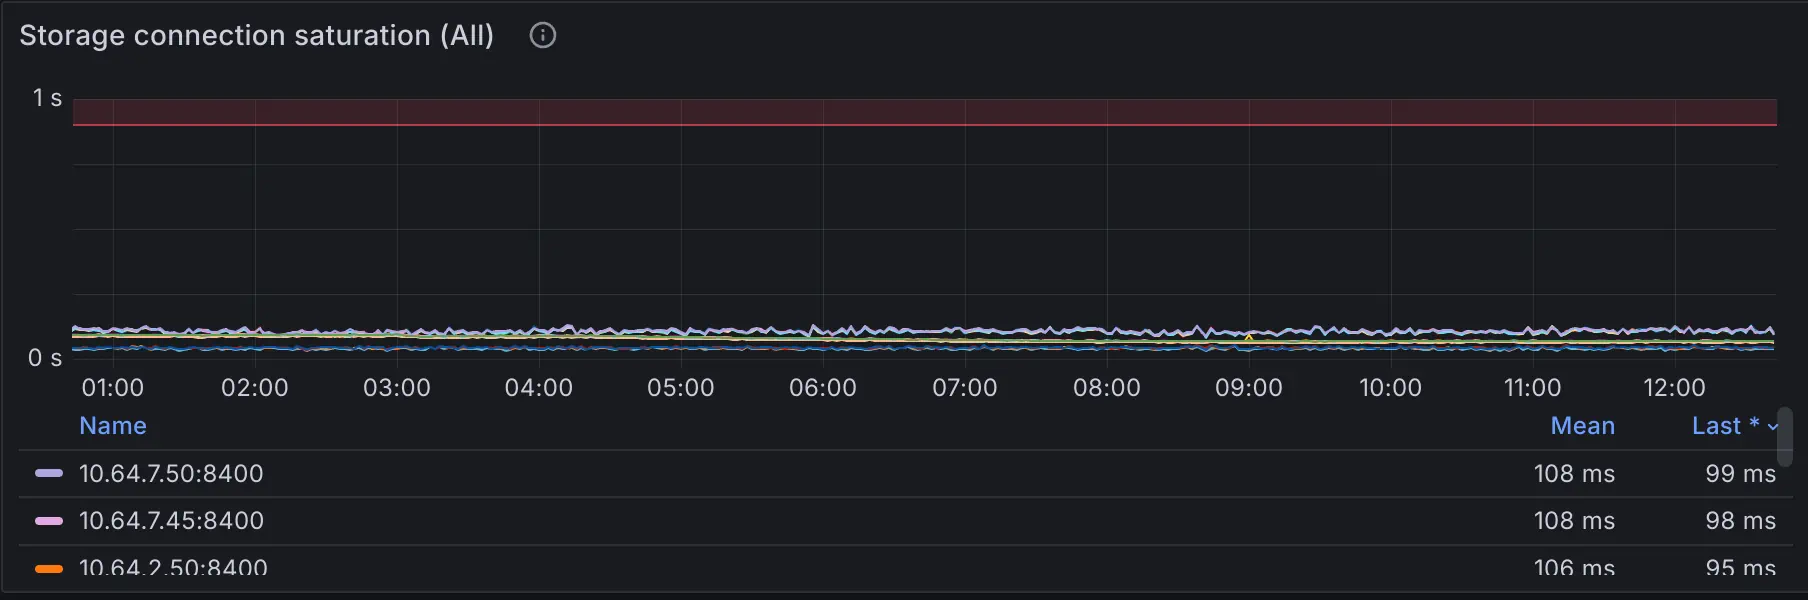
The first case can be easily observed through storage connection saturation. It shows the saturation level of connection between vminsert and vmstorage components.
max(rate(vm_rpc_send_duration_seconds_total{}[1m])) by(addr)
If the threshold of 0.9sec is reached, then the connection is saturated by more than 90% and vminsert won’t be able to keep up. This usually means that either vminsert or vmstorage nodes are struggling with the load. Verify CPU/mem saturation of both components and network saturation between them.
I recommend visualizing it directly on the Grafana Dashboard, as these metrics are already integrated into the Dashboard of the VictoriaMetrics Cluster.
Connection saturation is just one of the methods for troubleshooting ingestion issues. The official documentation provides 7 common suggestions for troubleshooting slow data ingestion, and it is recommended to read through them.
If not many issues are found in the monitoring of the VictoriaMetrics Cluster, then perhaps the second scenario to consider is whether the network bandwidth is sufficient.
Querying
#
Assuming no issues were found in the previous steps, congratulations, the data likely resides in the TSDB. In this case, the absence of query results is often caused by issues related to PromQL/MetricsQL, variables, etc.
In VictoriaMetrics Cluster, it is recommended to start by querying vmstorage through vmselect at the lowest level and remove all variables and functions from the query statement, for example:
// Original PromQL/MetricsQL
rate(vm_slow_row_inserts_total{job=~"$job_storage"}[$__rate_interval])

// PromQL/MetricsQL for troubleshooting
vm_slow_row_inserts_total
This ensures that the metric is present in your TSDB, and then you can gradually add label conditions, variables, and aggregation functions to identify which step in the query process is not yielding the expected results.
If everything appears to be in order, the issue likely lies in the higher-level query path, such as Grafana -> vmauth -> vmselect_level_1 -> ... vmselect_level_n -> vmstorage, in which case you should troubleshoot each level upwards.
What Else Could it Be?
#
Sometimes troubleshooting can be challenging, and these reasons can also make metrics not queryable:
- Data ingested with too old timestamp or future timestamp. Check the log of vmstorage and see if they were dropped.
- Data ingested with relatively old timestamp, but still in the retentionPeriod. Extend your time range in Query UI to see them.
- Wrong tenant ID in cluster version.
A good tool for checking whether you have your metrics without typing anything is the explore mode, which works for Prometheus-like metrics.
At the same time, by delving into VictoriaMetrics Monitoring, make sure you grasp the health status of VictoriaMetrics comprehensively.
Conclusion
#
Through the above introduction, I believe you have gained some insights into troubleshooting issues in the metric monitoring system. I have summarized these insights into a diagram:
Due to space limitations, this article only scratches the surface of common issues. If you encounter more complex problems, I recommend:
- Make good use of monitoring with VictoriaMetrics, Grafana Dashboard is your best tool;
- Come to the VictoriaMetrics community to ask questions, we are happy to answer users’ questions and implement new features.
Leave a comment below or Contact Us if you have any questions!
comments powered by Disqus