From the article
VictoriaMetrics Observability Blog
Author
- Adam Yates
- Aditya Kulkarni
- Adrian Bridgwater
- Agustín Gallego
- Alex Woodie
- Alexander Marshalov
- Aliaksandr Valialkin
- Aman Agarwal
- Antoine Tardif
- Antony Savvas
- Artem Navoiev
- Artur Minchukov
- Bill Tanner
- Cer6erus
- Claudio Masolo
- Cuong Le
- Daniil Romashov
- David Marshall
- David Rubinstein
- Denys Holius
- Derek Foster
- Diana Todea
- Dima Lazerka
- Dmytro Kozlov
- Emily Foster
- Fintech Herald
- Fred Navruzov
- Gary Flood
- Gonzalo García Labat
- Ivan Yatskevich
- Jaime Hampton
- Jan Sokol
- Jason Bloomberg
- Jason English
- Jean-Jerome Schmidt-Soisson
- Jesús Espino
- Joab Jackson
- John Seekins
- Jose Gomez-Selles
- Julien Menan
- Karan Virdi
- Laveesh Kocher
- Leigh McGowran
- Lindsay Clark
- Marc Sherwood
- Mark Baker
- Martijn Van Best
- Martin Veitch
- Mathias Palmersheim
- Michelle Sebek
- Nick Gibson
- Nikolay Khramchikhin
- Pablo Fernandez
- Phuong Le
- Rafal Szypulka
- Renato Losio
- Richard Speed
- Roman Khavronenko
- Vadim Alekseev
- Vadim Rutkovsky
- Yurii Kravets
- Zakhar Bessarab
- Zhu Jiekun
No matching authors found.
Category
- Benchmark
- Community
- Company News
- Customer Stories
- Developer Experience
- Distributed Tracing
- Events
- Go
- Go @ VictoriaMetrics
- High Cardinality
- Kubernetes
- Monitoring
- Observability
- Open Source Tech
- OpenTelemetry
- OTLP
- Performance
- PostgreSQL
- Product News
- Tech Talk
- Time Series Database
- VictoriaLogs
- VictoriaMetrics
- VictoriaTraces
No matching categories found.
Filter: Victoriametrics
Blog posts
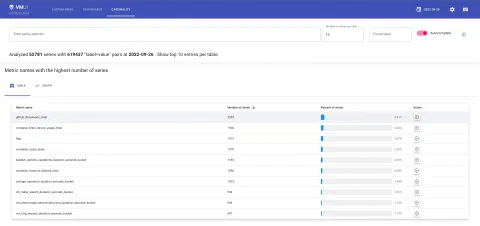
Cardinality explorer
In monitoring, the term cardinality defines the number of unique time series stored in TSDB. The higher is cardinality, the more resources are usually required for metrics processing and querying. Let’s see how Cardinality explorer can help us here.
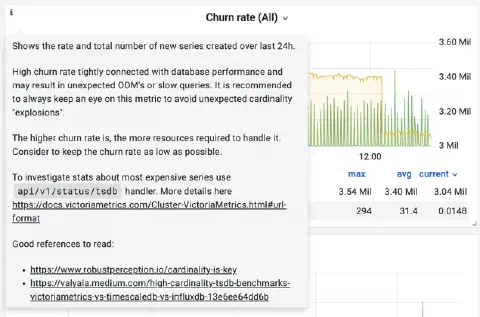
VictoriaMetrics Monitoring
VictoriaMetrics is a monitoring solution. It was designed to collect and process telemetry from many systems, provide a retrospective view, and forecast metrics for capacity planning. But what about monitoring VictoriaMetrics itself?
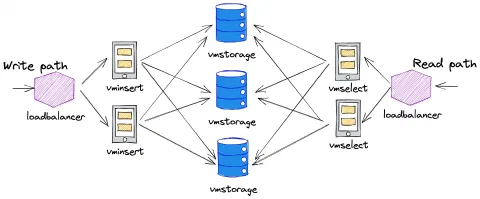
Grafana Mimir and VictoriaMetrics: performance tests
Benchmarking VictoriaMetrics and Grafana Mimir on the same hardware
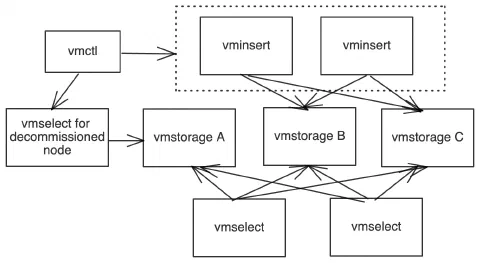
How to Decommission a vmstorage Node from a VictoriaMetrics Cluster
An article about how to remove a storage node from a VictoriaMetrics cluster gracefully
Q1/2022 Release Roundup: Announcing VictoriaMetrics v1.76 & More
The VictoriaMetrics v1.76 release headlines our first VictoriaMetrics releases roundup blog post, which summarises all the releases we published in the first quarter of 2022; and includes feature highlights such as multi-level downsampling (the most wanted Vicky feature in 2021).

Pricing comparison for Managed Prometheus
We’ll have to see what would be the cost of serving the same workload at Amazon Managed Service for Prometheus, Google Cloud Managed Service for Prometheus and VictoriaMetrics Cloud.
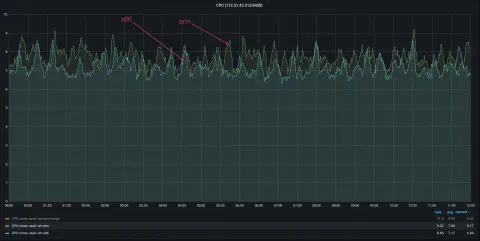
Running VictoriaMetrics on ARM-based processors
VictoriaMetrics has new production ready builds for ARM
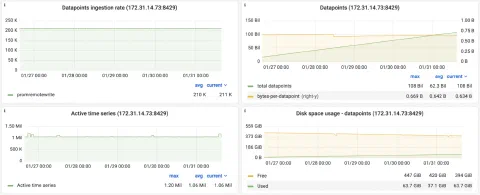
Managed VictoriaMetrics announcement
We are glad to announce the availability of Managed VictoriaMetrics (VictoriaMetrics Cloud) - try it right now!
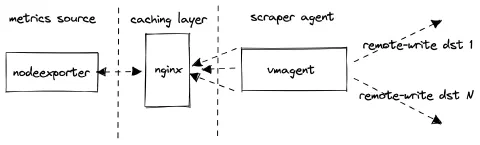
Benchmarking Prometheus-compatible time series databases
A Helm chart for pushing node_exporter metrics to Prometheus-compatible systems via remote_write protocol