From the article
VictoriaMetrics Observability Blog
Author
- Adam Yates
- Aditya Kulkarni
- Adrian Bridgwater
- Agustín Gallego
- Alex Woodie
- Alexander Marshalov
- Aliaksandr Valialkin
- Aman Agarwal
- Antoine Tardif
- Antony Savvas
- Artem Navoiev
- Artur Minchukov
- Bill Tanner
- Cer6erus
- Claudio Masolo
- Cuong Le
- Daniil Romashov
- David Marshall
- David Rubinstein
- Denys Holius
- Derek Foster
- Diana Todea
- Dima Lazerka
- Dmytro Kozlov
- Emily Foster
- Fintech Herald
- Fred Navruzov
- Gary Flood
- Gonzalo García Labat
- Ivan Yatskevich
- Jaime Hampton
- Jan Sokol
- Jason Bloomberg
- Jason English
- Jean-Jerome Schmidt-Soisson
- Jesús Espino
- Joab Jackson
- John Seekins
- Jose Gomez-Selles
- Julien Menan
- Karan Virdi
- Laveesh Kocher
- Leigh McGowran
- Lindsay Clark
- Marc Sherwood
- Mark Baker
- Martijn Van Best
- Martin Veitch
- Mathias Palmersheim
- Michelle Sebek
- Nick Gibson
- Nikolay Khramchikhin
- Pablo Fernandez
- Phuong Le
- Rafal Szypulka
- Renato Losio
- Richard Speed
- Roman Khavronenko
- Vadim Alekseev
- Vadim Rutkovsky
- Yurii Kravets
- Zakhar Bessarab
- Zhu Jiekun
No matching authors found.
Category
- Benchmark
- Community
- Company News
- Customer Stories
- Developer Experience
- Distributed Tracing
- Events
- Go
- Go @ VictoriaMetrics
- High Cardinality
- Kubernetes
- Monitoring
- Observability
- Open Source Tech
- OpenTelemetry
- OTLP
- Performance
- PostgreSQL
- Product News
- Tech Talk
- Time Series Database
- VictoriaLogs
- VictoriaMetrics
- VictoriaTraces
No matching categories found.
Filter: Open Source
Blog posts
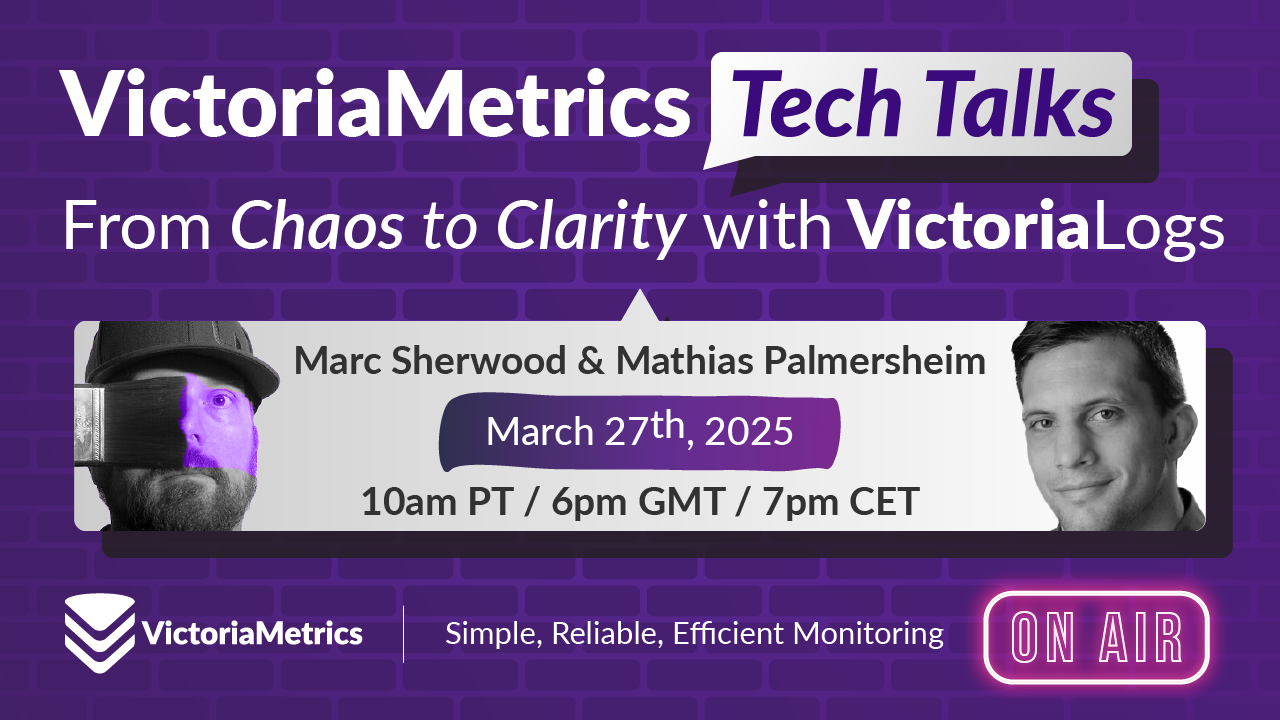
From Chaos to Clarity with VictoriaLogs
In our third episode, we will guide you through efficiently ingesting and optimizing log pipelines with VictoriaLogs. We’ll provide actionable insights on streamlining your logging processes, enhancing performance, and, most importantly, extracting valuable insights from your data to improve your operations, troubleshoot issues, and gain a competitive edge.
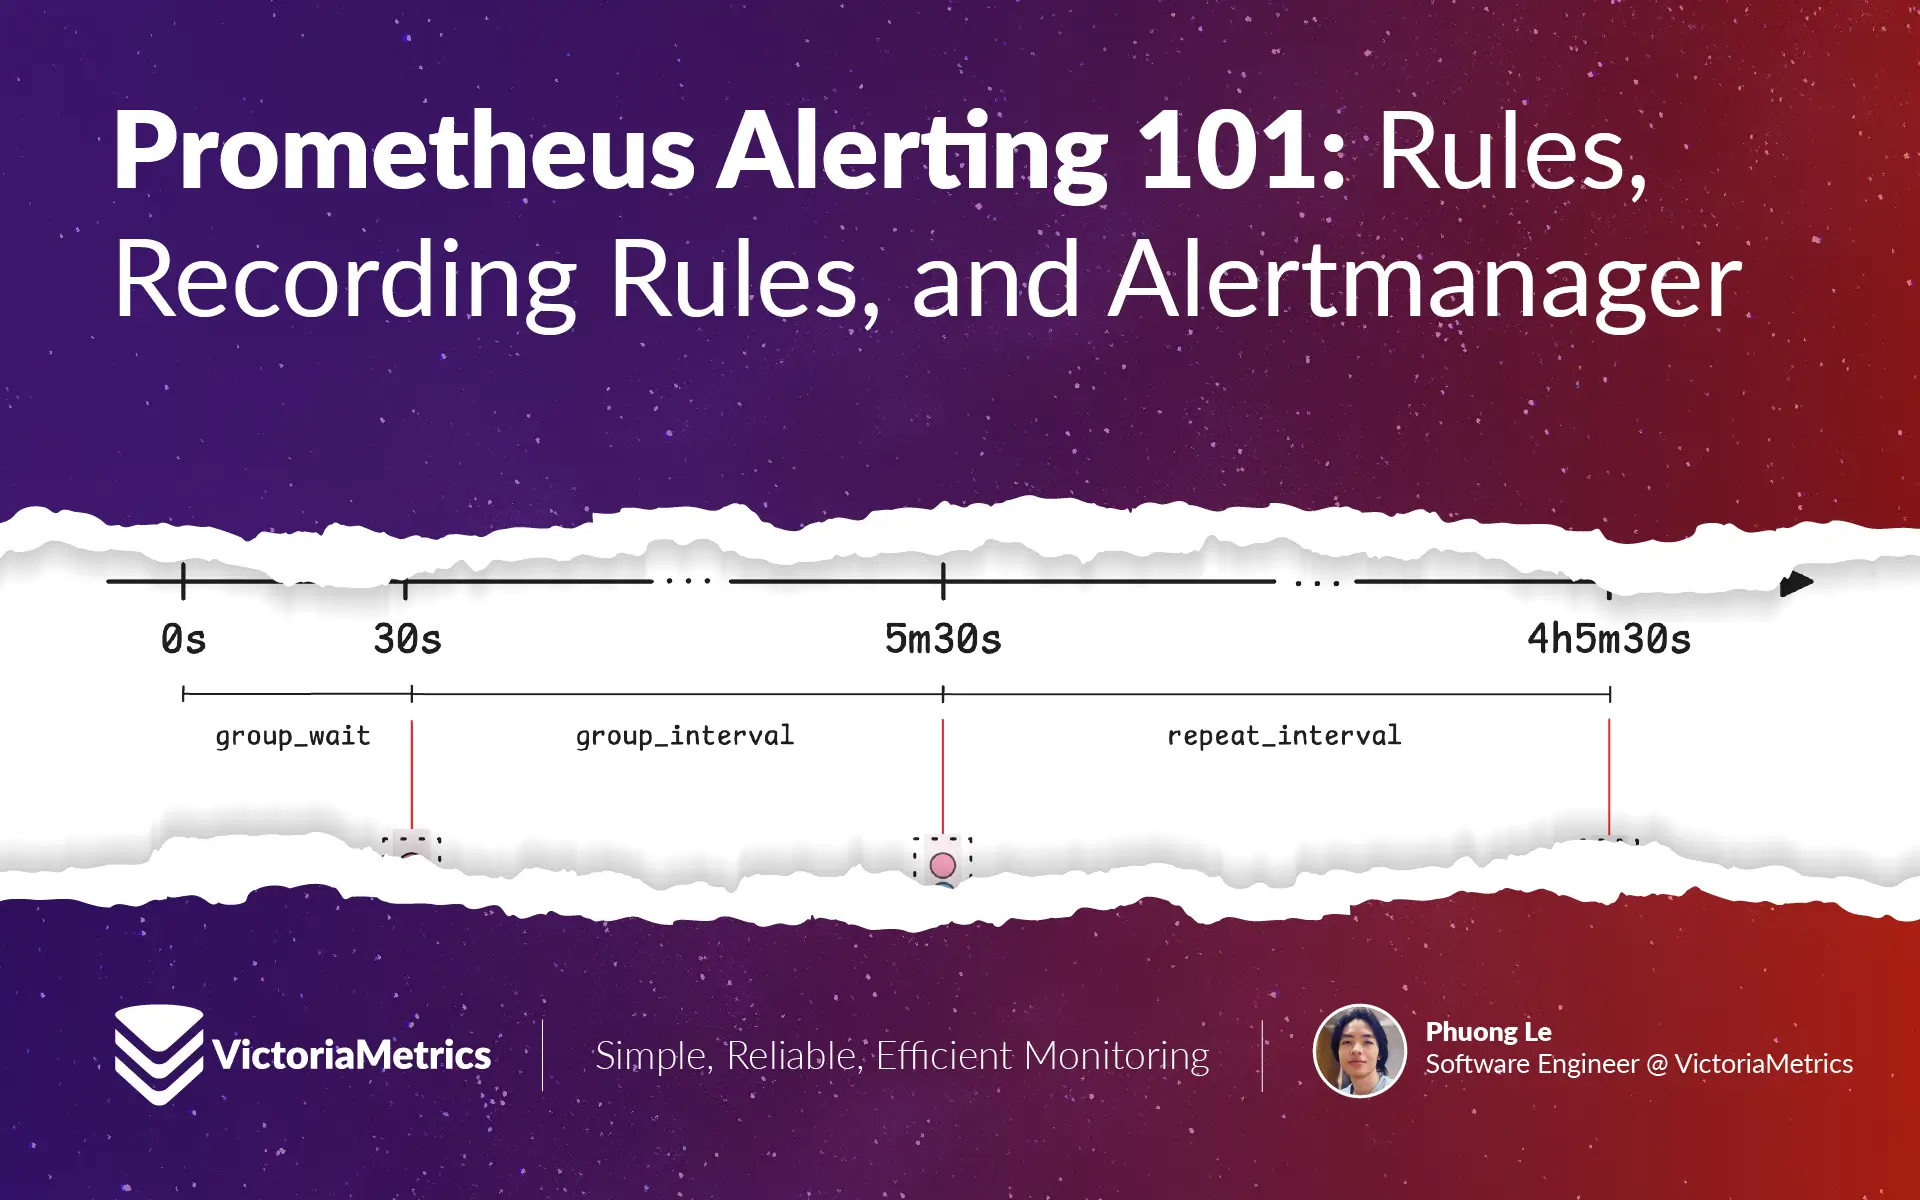
Prometheus Alerting 101: Rules, Recording Rules, and Alertmanager
Recording rules can transform complex PromQL queries into pre-computed metrics, eliminating repeated calculation overhead. When organized in groups, these alerting and recording rules can be precisely scheduled to run at specific times like 01:30, 02:30, and even execute in parallel for maximum efficiency.
Heading to London: Meet Our Team at KubeCon Europe 2025
Say hello at booth #N503 for KubeCon Europe 2025 in London, meet our team, and find out about the latest updates on our new VictoriaLogs solution, VictoriaMetrics, anomaly detection capabilities, and more.
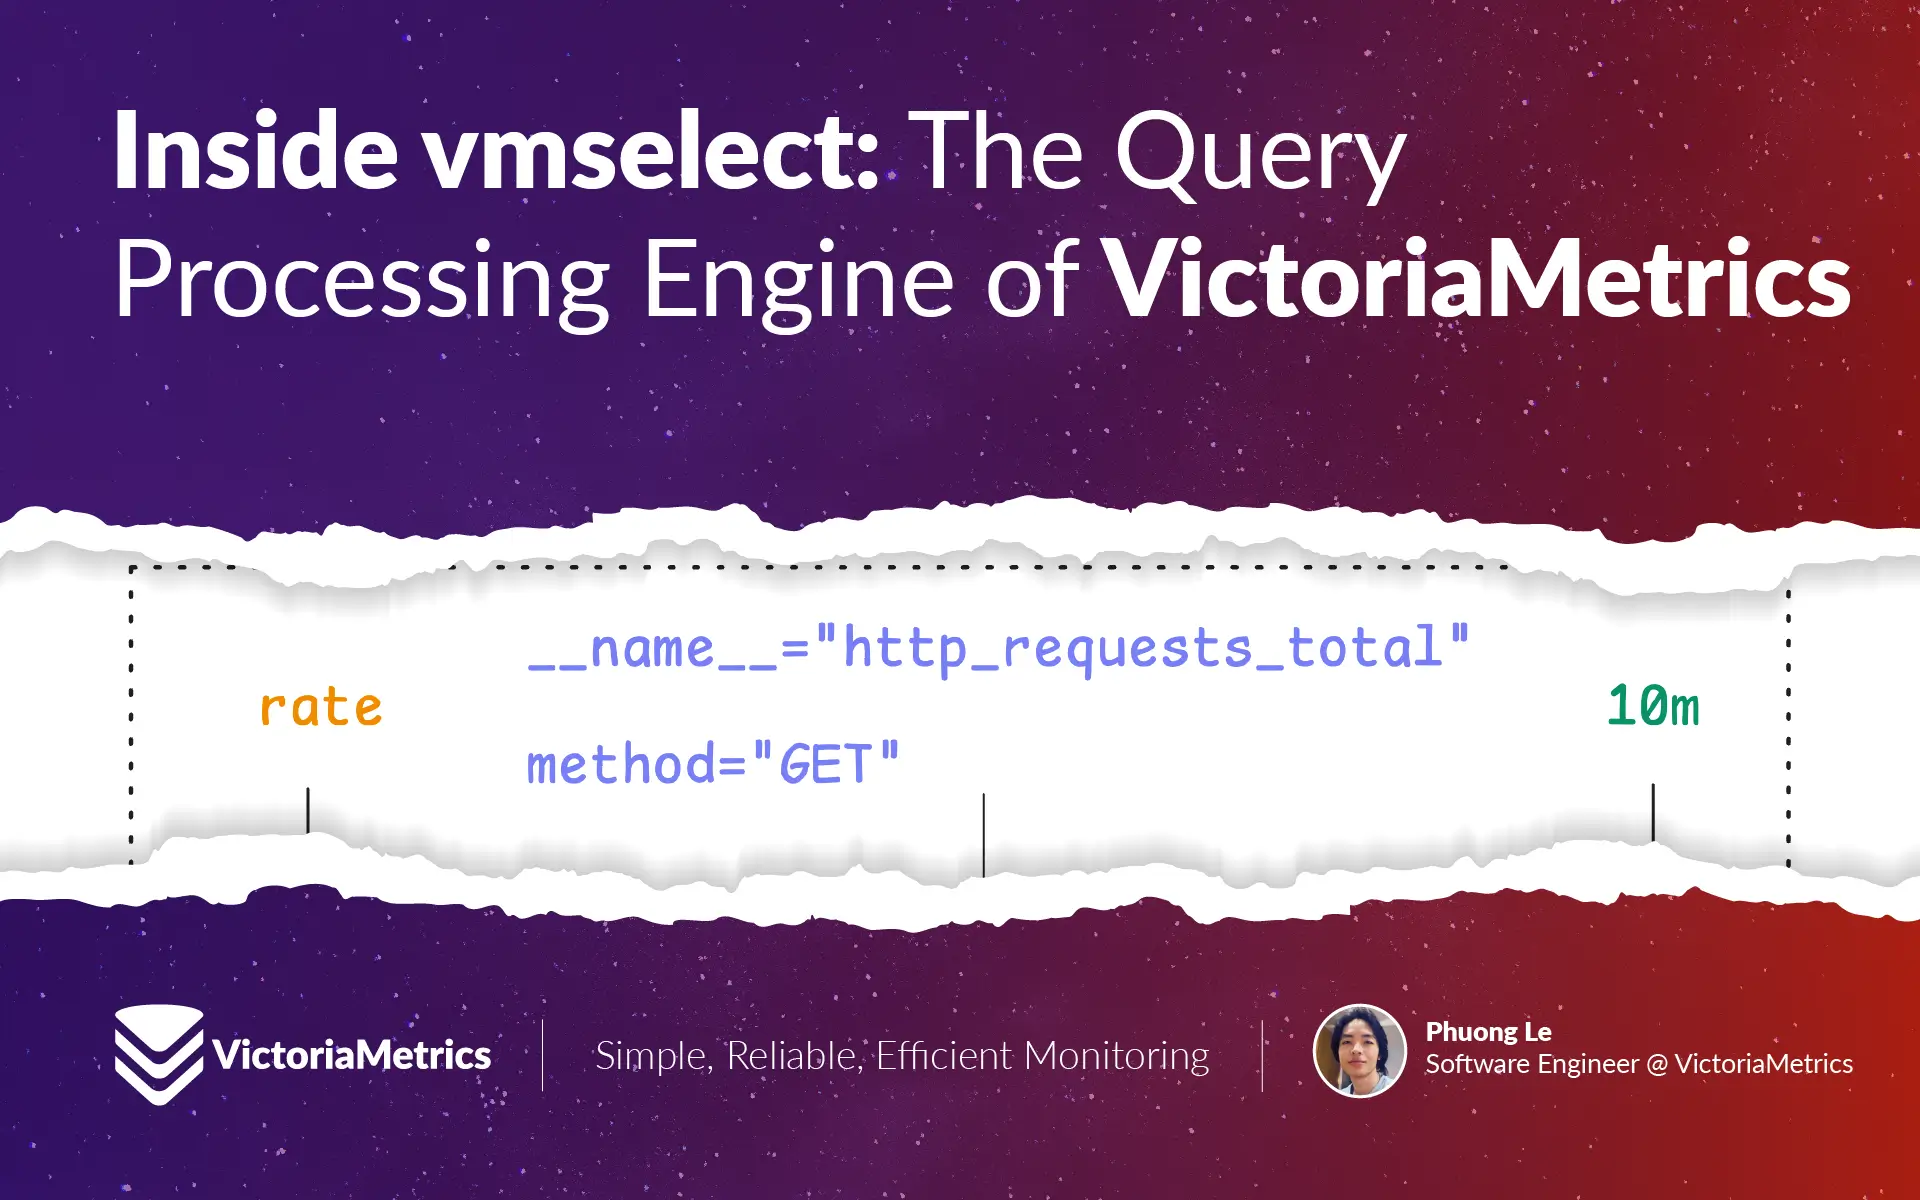
Inside vmselect: The Query Processing Engine of VictoriaMetrics
The article explains vmselect’s core functionalities: concurrent request processing, query parsing and validation, data fetching and merging from vmstorage nodes, and memory-efficient result caching.
Meet Our Team at Scale 22x
Say hello at booth #313 for SCaLE 22x in Pasadena, meet our team, and find out about the latest updates on our new VictoriaLogs solution, the latest VictoriaMetrics updates and more.
VictoriaLogs Status Update: Heading Towards the Cluster Version
Whether you’re just discovering VictoriaLogs or have been using it for a while, this post will walk you through the recent enhancements and give you a sneak peek at the much anticipated cluster version that’s on the horizon.
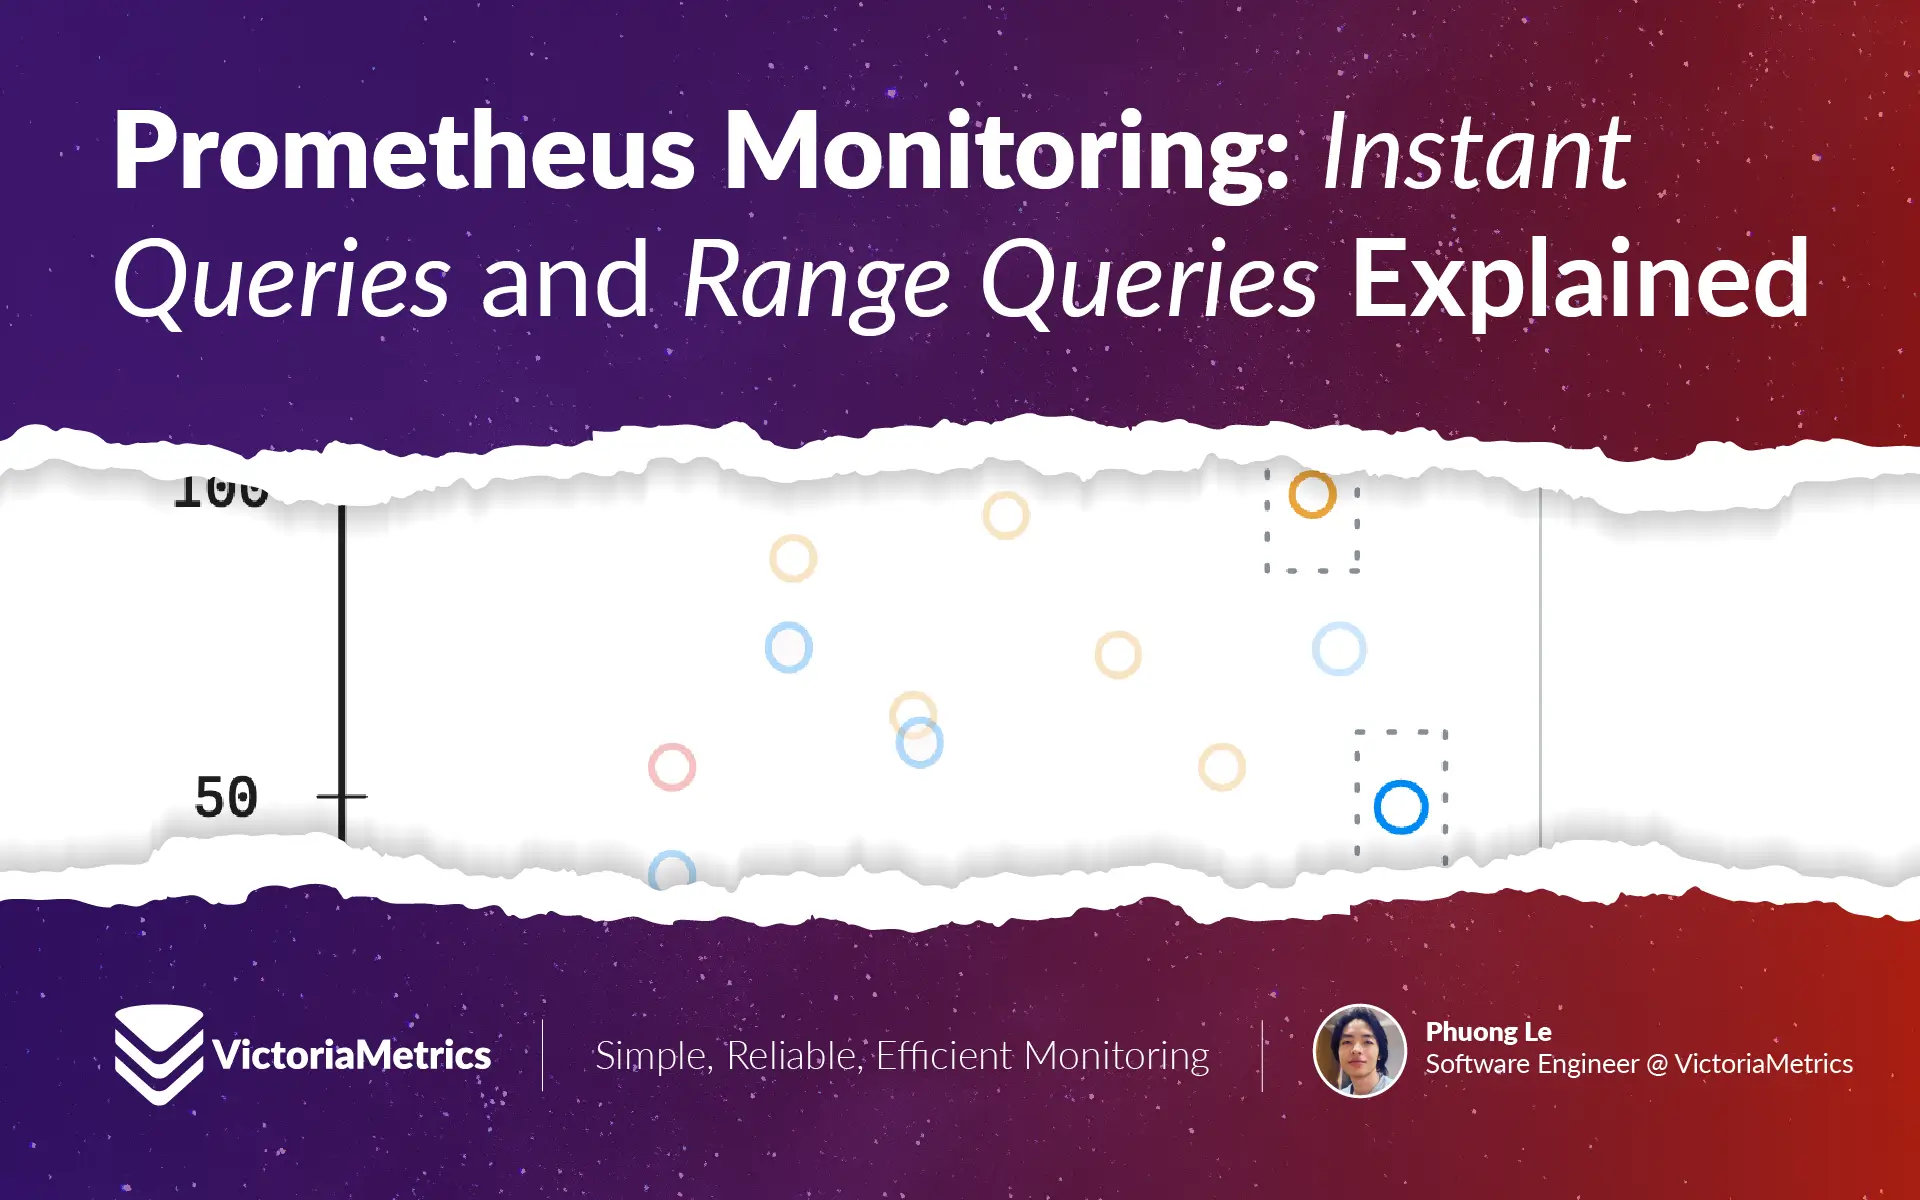
Prometheus Monitoring: Instant Queries and Range Queries Explained
When evaluating, instant vectors provide current snapshots, while range vectors give you multiple values over a period of time. But how do they work?
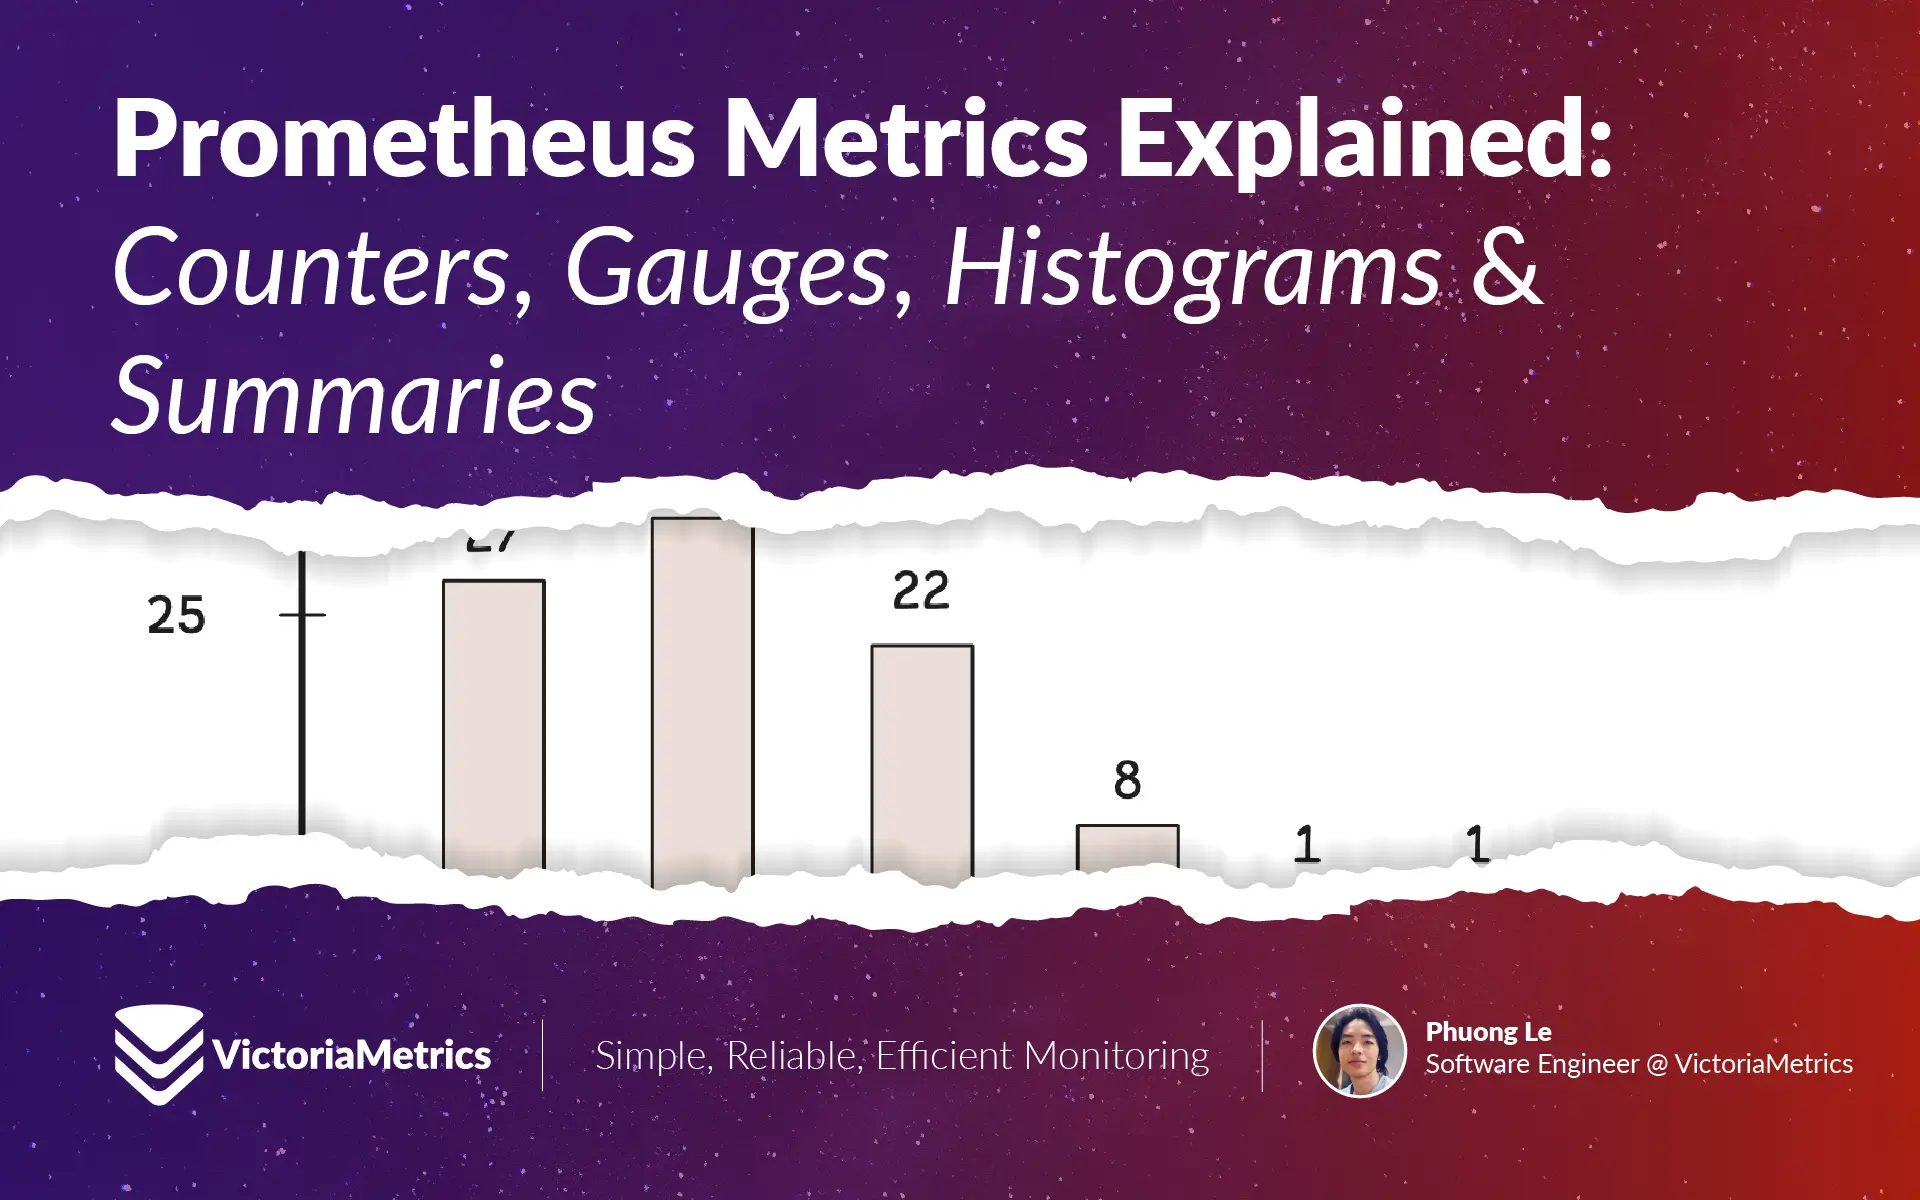
Prometheus Metrics Explained: Counters, Gauges, Histograms & Summaries
Metrics come in different types: counters that only increase, gauges that fluctuate, histograms that show value distributions, and summaries that pre-calculate statistics.
300%+ Growth in 2024: Join Our Team in 2025!
When we ended 2024 with continued growth (300+%) both in terms of open source adoption and enterprise business we thought: We’re going to need some more help in 2025!