From the article
VictoriaMetrics Observability Blog
Author
- Adam Yates
- Aditya Kulkarni
- Adrian Bridgwater
- Agustín Gallego
- Alex Woodie
- Alexander Marshalov
- Aliaksandr Valialkin
- Aman Agarwal
- Antony Savvas
- Artem Navoiev
- Bill Tanner
- Cer6erus
- Claudio Masolo
- David Marshall
- Denys Holius
- Derek Foster
- Diana Todea
- Dima Lazerka
- Dmytro Kozlov
- Emily Foster
- Fintech Herald
- Fred Navruzov
- Gary Flood
- Gonzalo García Labat
- Ivan Yatskevich
- Jaime Hampton
- Jan Sokol
- Jason Bloomberg
- Jason English
- Jean-Jerome Schmidt-Soisson
- Jesús Espino
- Joab Jackson
- John Seekins
- Jose Gomez-Selles
- Julien Menan
- Karan Virdi
- Laveesh Kocher
- Leigh McGowran
- Lindsay Clark
- Marc Sherwood
- Mark Baker
- Martijn Van Best
- Martin Veitch
- Mathias Palmersheim
- Michelle Sebek
- Nick Gibson
- Nikolay Khramchikhin
- Pablo Fernandez
- Phuong Le
- Rafal Szypulka
- Renato Losio
- Richard Speed
- Roman Khavronenko
- Vadim Alekseev
- Vadim Rutkovsky
- Yurii Kravets
- Zakhar Bessarab
- Zhu Jiekun
No matching authors found.
Category
- Benchmark
- Community
- Company News
- Customer Stories
- Developer Experience
- Distributed Tracing
- Events
- Go
- Go @ VictoriaMetrics
- High Cardinality
- Kubernetes
- Monitoring
- Observability
- Open Source Tech
- OpenTelemetry
- OTLP
- Performance
- PostgreSQL
- Product News
- Tech Talk
- Time Series Database
- VictoriaLogs
- VictoriaMetrics
- VictoriaTraces
No matching categories found.
Filter: Monitoring
Blog posts
Full-Stack Observability with VictoriaMetrics in the OTel Demo
The OpenTelemetry Astronomy Shop demo has long served as a reference environment for exploring observability in distributed systems, but until now it shipped with only a Prometheus datasource. VictoriaMetrics forked the demo and extended it with VictoriaMetrics, VictoriaLogs, and VictoriaTraces, providing insights into VictoriaMetrics’ observability stack where metrics, logs, and traces flow into a unified backend.
Alerting Best Practices
Proper alerting is an art. It is all about foreseeing bad scenarios before they happen, so you can prepare for them. In this article, we go through practical recommendations of approaching the alerting to reduce alerting fatigue and avoid false positives.
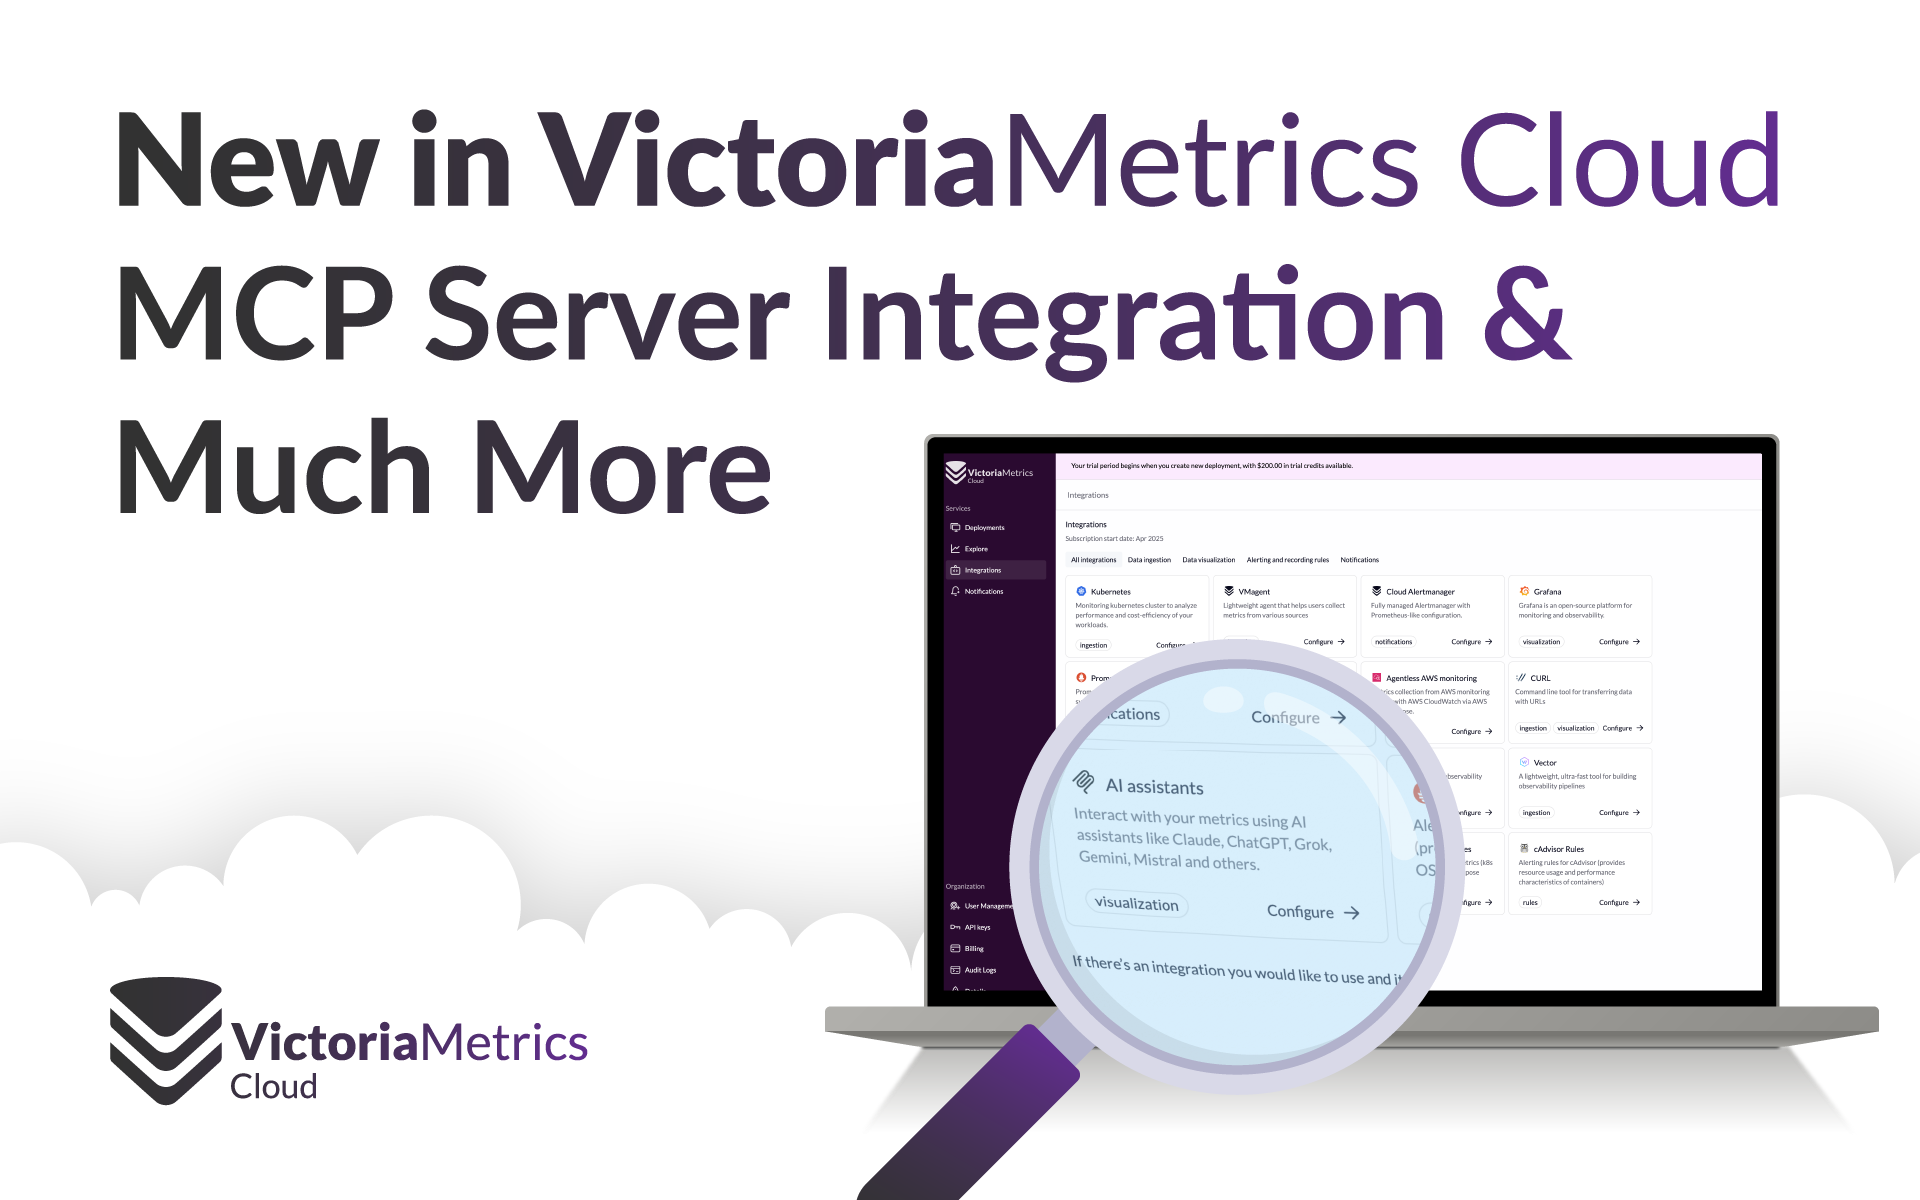
MCP Server Integration & Much More: What's New in VictoriaMetrics Cloud Q2 2025
This post recaps the latest VictoriaMetrics Cloud updates, including enhanced multi-tenancy support for Access Tokens, exciting new ways to interact with VictoriaMetrics Cloud through the MCP Server integration and code-first libraries. We’re also continuing our journey of improving our docs with a fresh approach to discovering and deploying integrations.
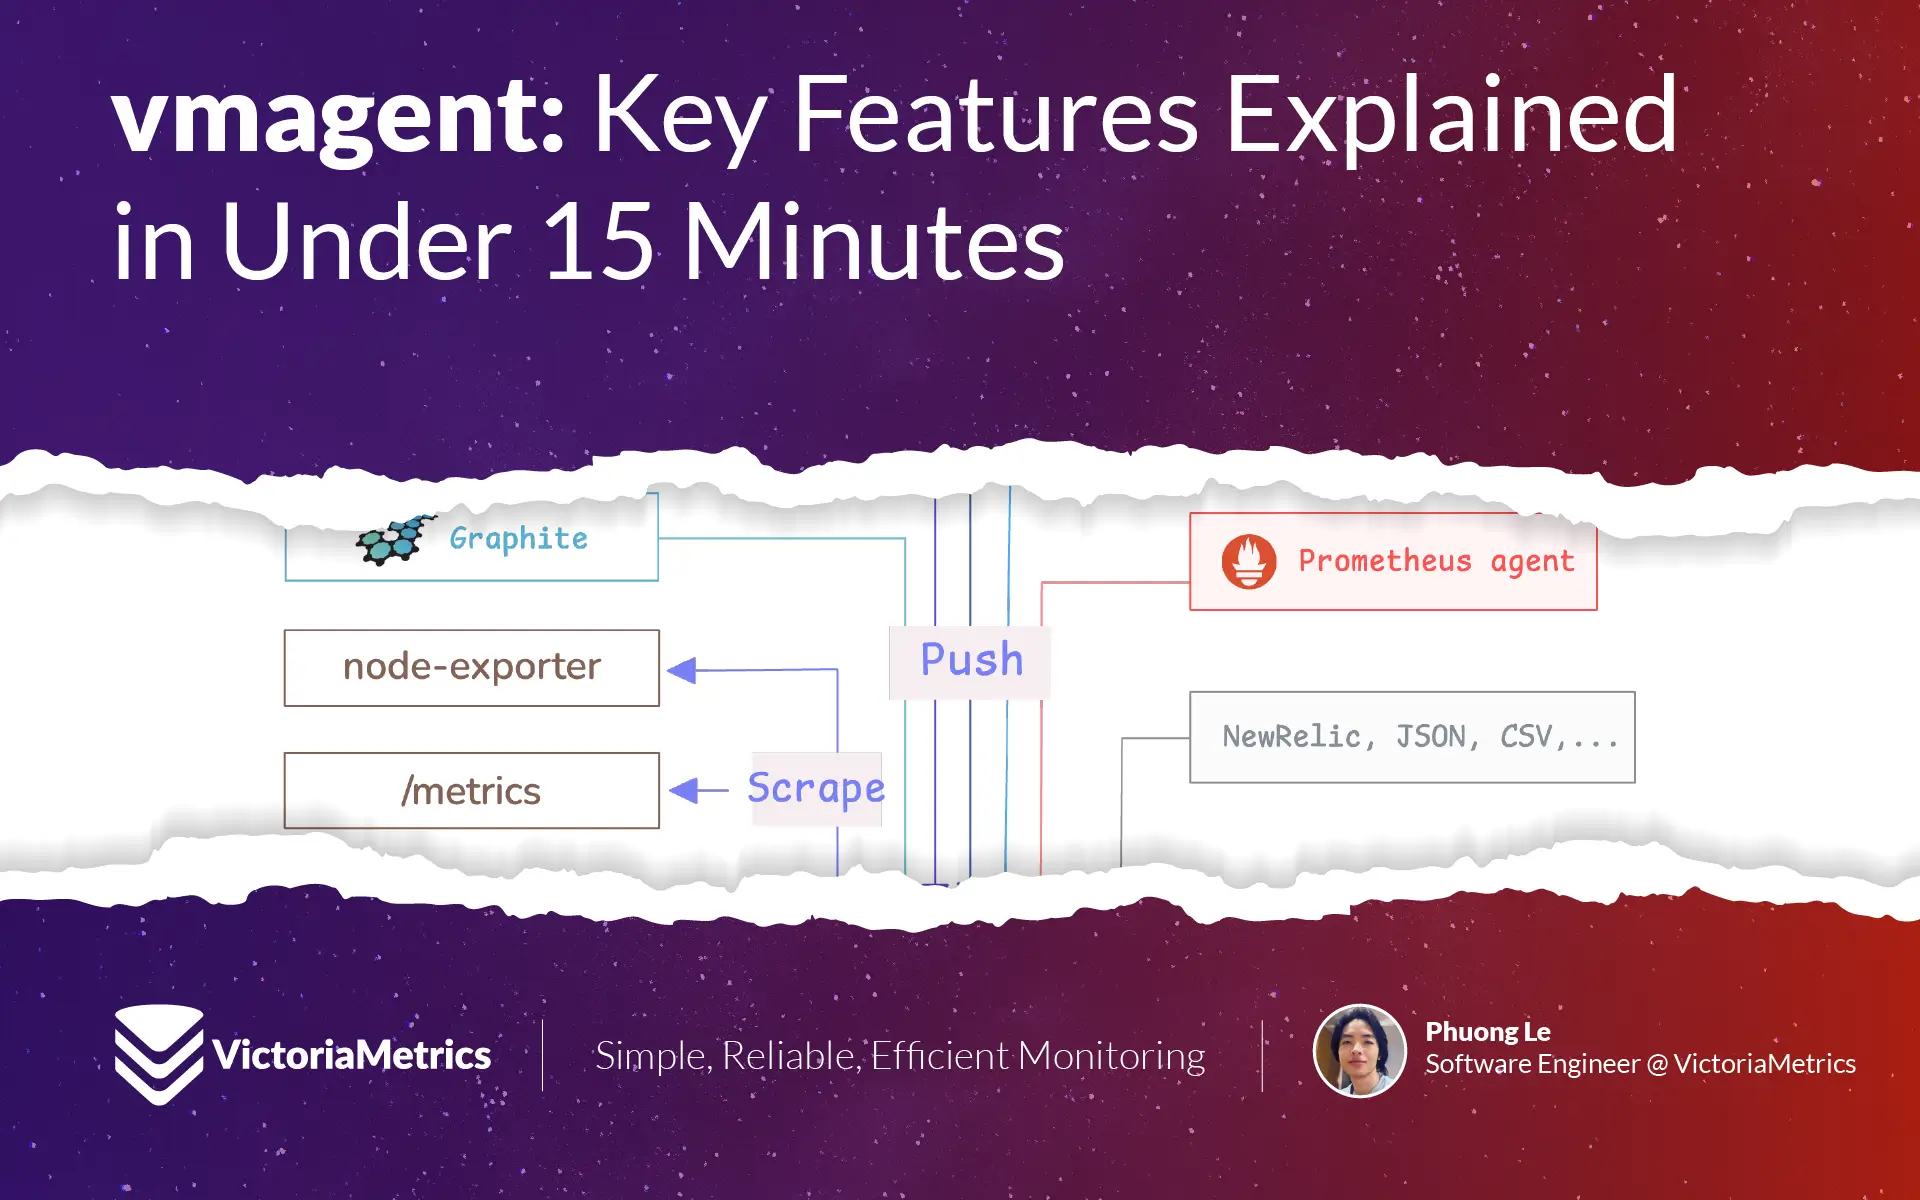
vmagent: Key Features Explained in Under 15 Minutes
vmagent is a lightweight agent for collecting and forwarding metrics to remote storage. It supports relabeling, sharding, replication, aggregation, deduplication, and disk buffering to ensure reliable and efficient metric delivery.
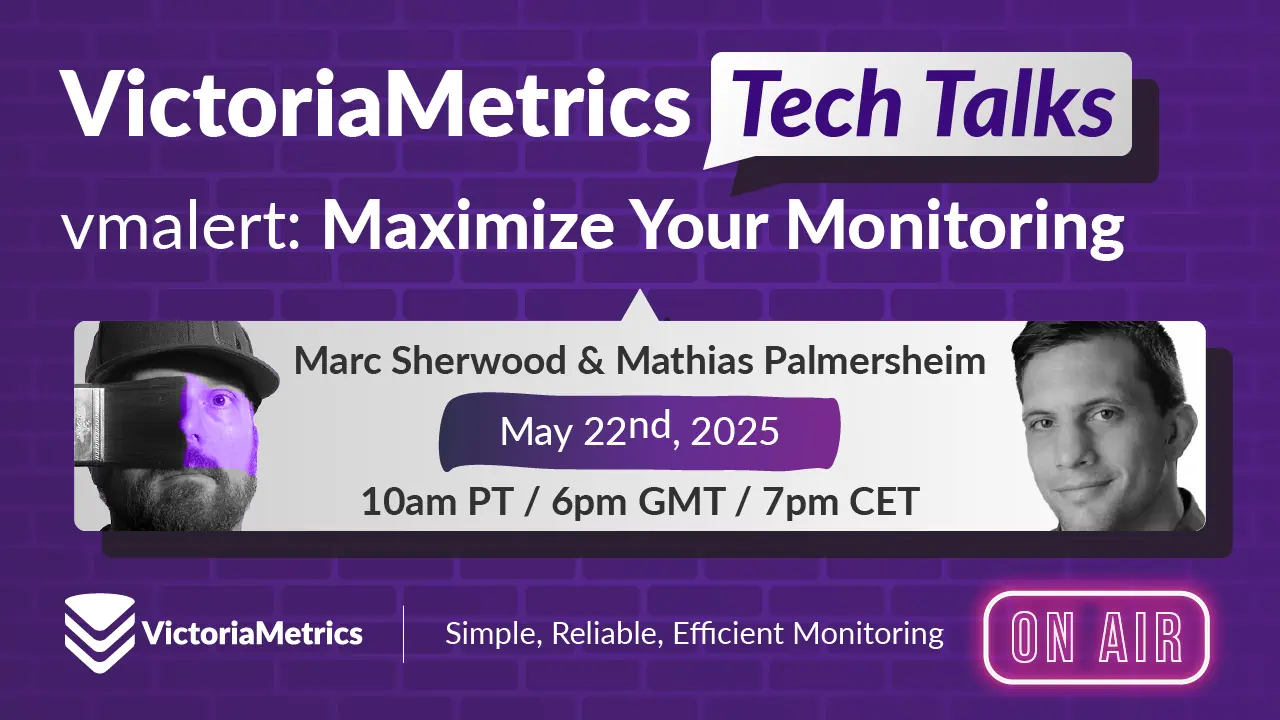
vmalert: Maximize Your Monitoring
Turn alerts into action, not noise. Our May 22nd Tech Talk (10 AM PDT) dives into vmalert best practices. Learn to configure, write effective rules, and optimize your VictoriaMetrics alerting strategy. Don’t miss out!
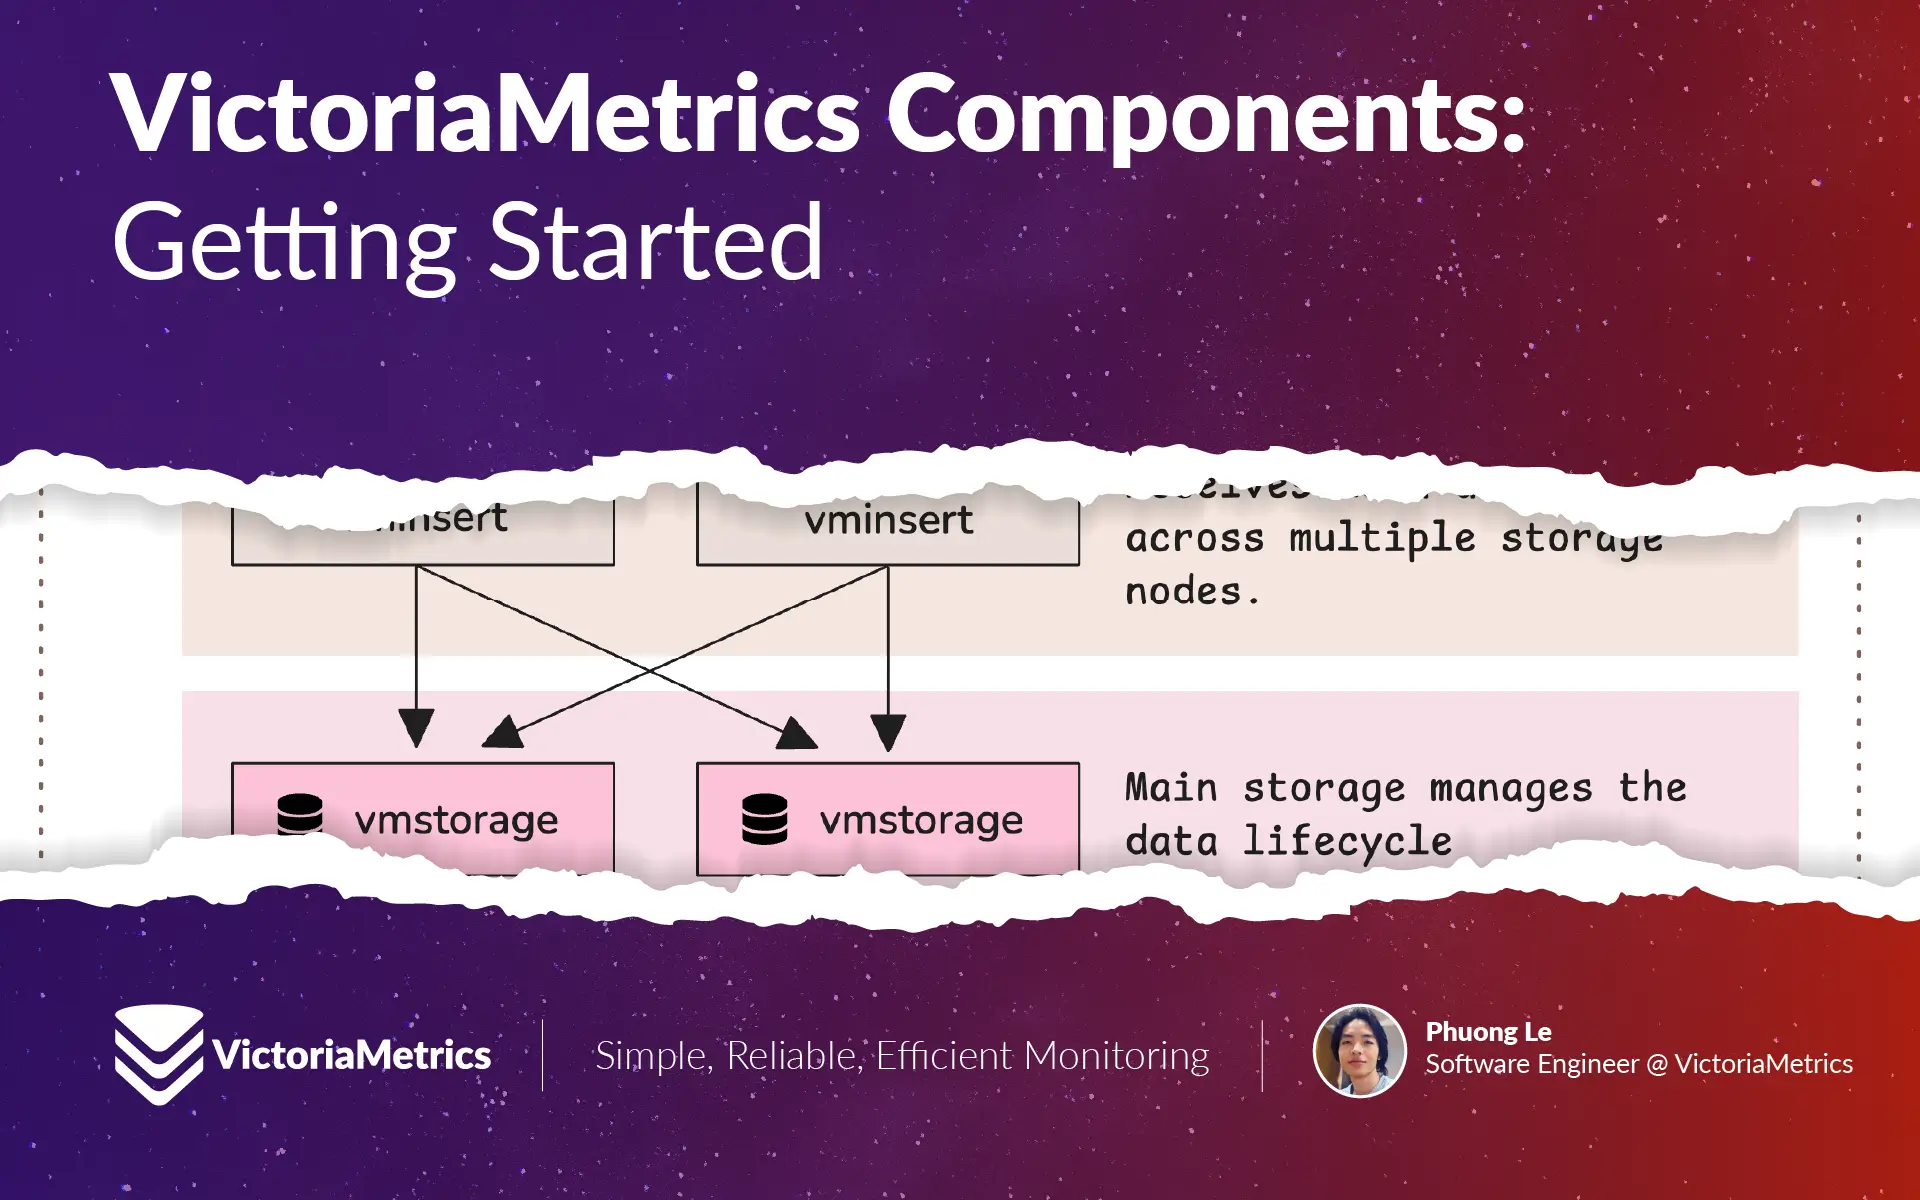
VictoriaMetrics Components: Getting Started
VictoriaMetrics is a fast, scalable monitoring system made of modular components like vminsert, vmstorage, and vmselect. It supports both single-node and clustered setups, along with tools for backup, restore, alerting, access control, and data migration. Data can be ingested, stored, queried, backed up, and restored with high performance and minimal resource use.
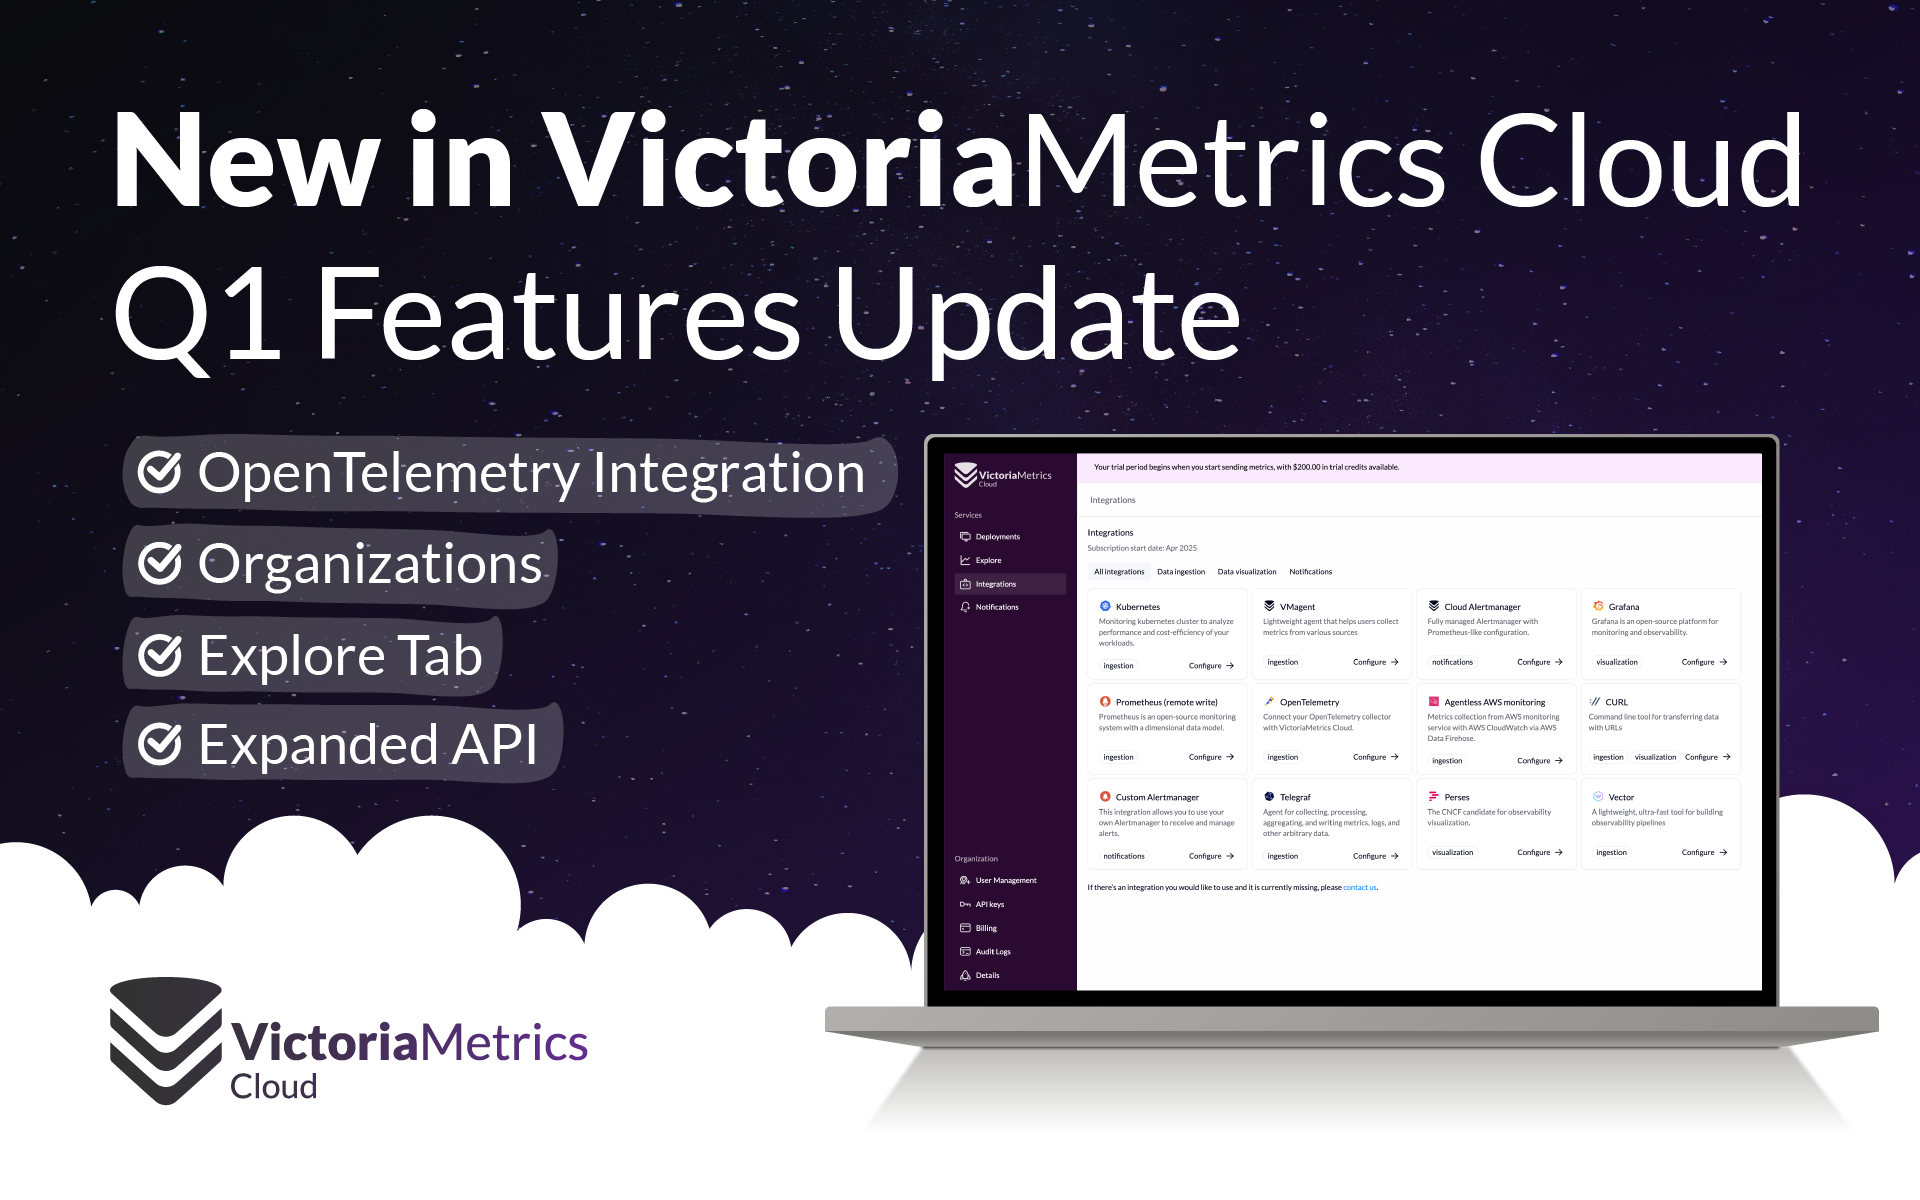
VictoriaMetrics Cloud: What's New in Q1 2025?
This post recaps the latest VictoriaMetrics Cloud updates, including new organization management features, OpenTelemetry integration, a powerful Explore tab, and expanded API capabilities, making your monitoring experience even more seamless and efficient.

Don’t default to microservices: You’ll thank us later!
We believe microservices shouldn’t be the default and that companies should start with monoliths until reality actually demands they scale and shift from one node to a cluster of nodes. As a result, we offer clustering on an open source basis because we want to support realistic growth. Read on for details!
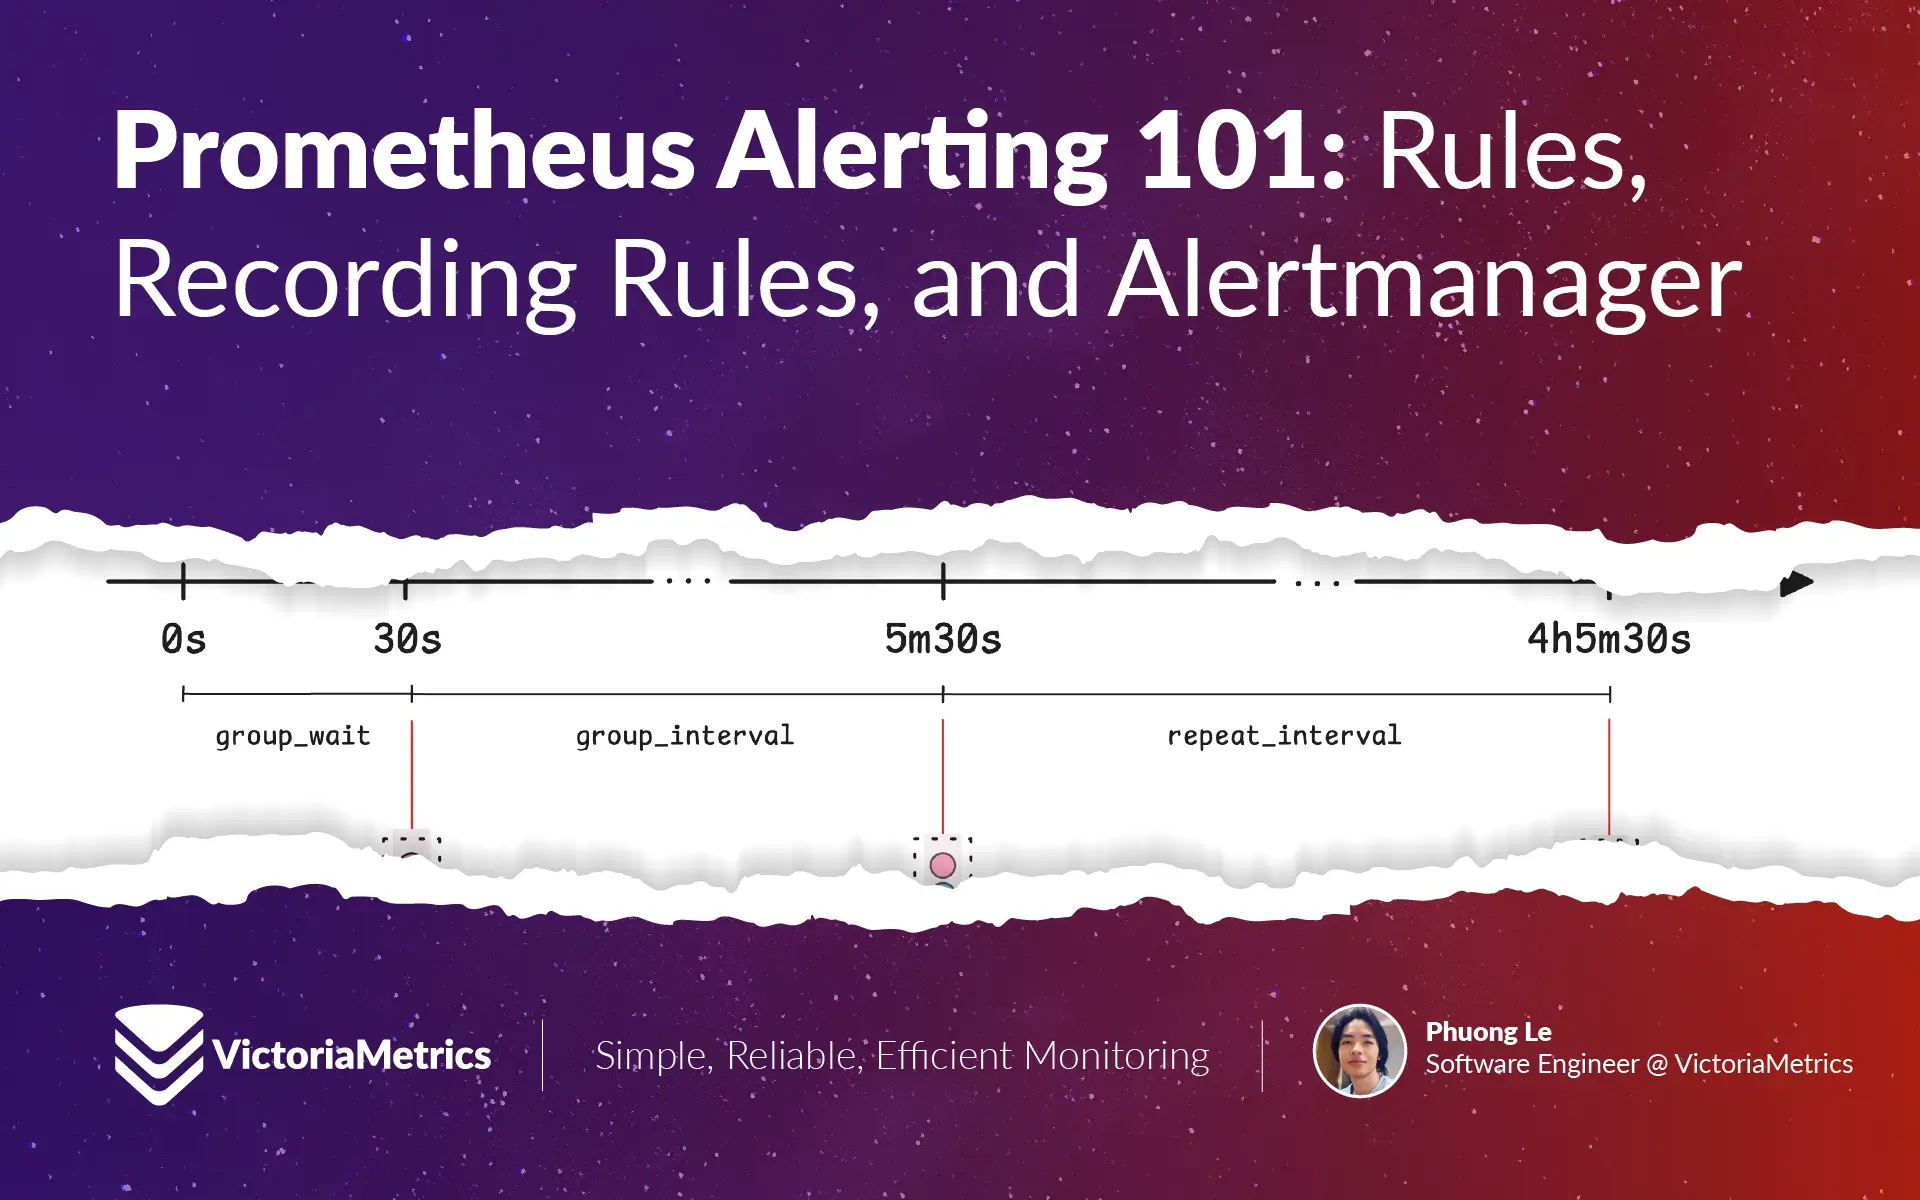
Prometheus Alerting 101: Rules, Recording Rules, and Alertmanager
Recording rules can transform complex PromQL queries into pre-computed metrics, eliminating repeated calculation overhead. When organized in groups, these alerting and recording rules can be precisely scheduled to run at specific times like 01:30, 02:30, and even execute in parallel for maximum efficiency.