- Blog /
- Rules backfilling via vmalert
Rules backfilling via vmalert
Share:


Recording rules is a clever concept introduced by Prometheus for storing results of query expressions in a form of a new time series. It is similar to materialized view and helps to speed up queries by using data pre-computed in advance instead of doing all the hard work on query time.
Like materialized views, recording rules are extremely useful when user knows exactly what needs to be pre-computed. For example, a complex panel on Grafana dashboard or SLO objective. Both have queries that rarely change, so recording rules could significantly simplify and speed up the execution.
But recording rules do not have a retroactive effect. Pre-computed results start to appear only after the moment recording rule was configured. Data before that time will be missing. And results of the recording rule can’t be changed in the past, only deleted or replaced.
Starting from v1.61.0, VictoriaMetrics gained a feature named replay as a part vmalert component. It allows running vmalert in a special mode to retroactively evaluate recording or alerting rules and backfill their results back to the database. Let’s see how this feature can be used in practice.
SLI/SLO calculation
#
SLI/SLO calculation is one of the best examples of using recording and alerting rules. The common practice is to measure SLO on big time windows, of at least 30d. For example, the service shouldn’t return more than 1% of errors on a 30d interval. And since SLI metrics are usually generated via recording rules, users need to wait for 30d until rules evaluate and SLO becomes meaningful. Let’s see how we can make it better.
I have 6 months of metrics collected from one of the VictoriaMetrics sandbox clusters. As an SLO I’d like to define 99.9% of successful requests served by VictoriaMetrics cluster on 30 days interval. To generate rules for this objective, I decided to use one of the most popular SLI/SLO frameworks slok/sloth with the following config:
version: "prometheus/v1"
service: "sandbox-vmcluster"
slos:
 # We allow failing 1 request every 1000 requests (99.9%).
 - name: "requests-availability"
   objective: 99.9
   description: "SLO based on availability for HTTP request responses."
   sli:
     events:
       error_query: sum(rate(vm_http_request_errors_total{job="vmselect-benchmark-vm-cluster"}[{{.window}}]))
       total_query: sum(rate(vm_http_requests_total{job="vmselect-benchmark-vm-cluster"}[{{.window}}]))
   alerting:
     name: VMHighErrorRate
To generate recording and alerting rules from this config, I ran the following command:
./sloth -i slo_config.yml > slo_rules.yml
The result of the command execution is a bunch of recording and alerting rules of the following form:
groups:
- name: sloth-slo-sli-recordings-sandbox-vmcluster-requests-availability
  rules:
  - record: slo:sli_error:ratio_rate5m
    expr: |
      (sum(rate(vm_http_request_errors_total{job="vmselect-benchmark-vm-cluster"}[5m])))
      /
      (sum(rate(vm_http_requests_total{job="vmselect-benchmark-vm-cluster"}[5m])))
...
The full list of generated rules is available here.
Now we can feed this configuration to the vmalert, and it will start evaluating the rules. But to retroactively evaluate these rules for all the data I already have, I’m going to run vmalert in replay mode using the same generated configuration file:
./vmalert -rule=slo_rules.yml \               # path to the configuration file
    -datasource.url=http://localhost:8428 \   # where to read metrics from
    -remoteWrite.url=http://localhost:8428 \  # where to persist results to
    -replay.timeFrom=2022-07-21T00:00:00Z \   # when to start the evaluation
    -replay.timeTo=2023-01-21T00:00:00Z       # when to end the evaluation
As a source of data and destination for persisting results, I’m using local installation
of single-node VictoriaMetrics.
The process of the replay mode looks like the following:
 The vmalert's replay mode in-progress.
In replay mode, rule groups and rules within groups are executed sequentially one by one.
This is especially important for rules chaining - approach when the rule depends on the results of the previous rule.
Just like in the SLI rules we generated above.
During evaluation, vmalert executes rule’s expression via /query_range API to minimize the number of API calls. The configured time range is split into smaller ranges, so the API calls remain efficient and resilient to time series churn. The cache on VictoriaMetrics side is automatically disabled by vmalert in order to prevent cache pollution. But VictoriaMetrics could have already cached responses for previously made requests, so it is recommended to follow general recommendations after data backfilling.
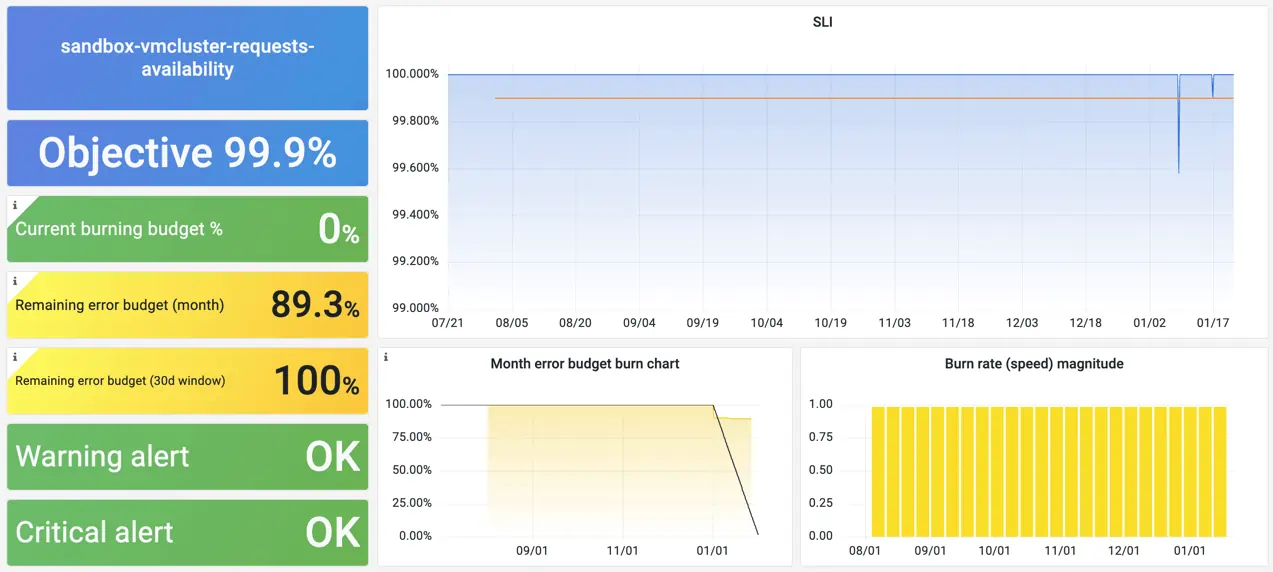
Once the replay is done, we should be able to see recording rules backfilled and available on the whole time range:
Screenshot from the Grafana dashboard for SLO/SLI metrics by slok/sloth.
And if we zoom-in and compare generated recording rule with the actual query used for its generation, we’ll see how they match:
 Comparing recording rule results to the actual query in vmui.
Retroactive alerts
#
Another cool thing about replay mode is that it supports retroactive evaluation of alerting rules.
Actually, this mode was introduced specifically to support alerts evaluation in the past
for satellite operator. So after we “replayed” SLO rules, we should be able to see whether any alerts triggered
in the past:
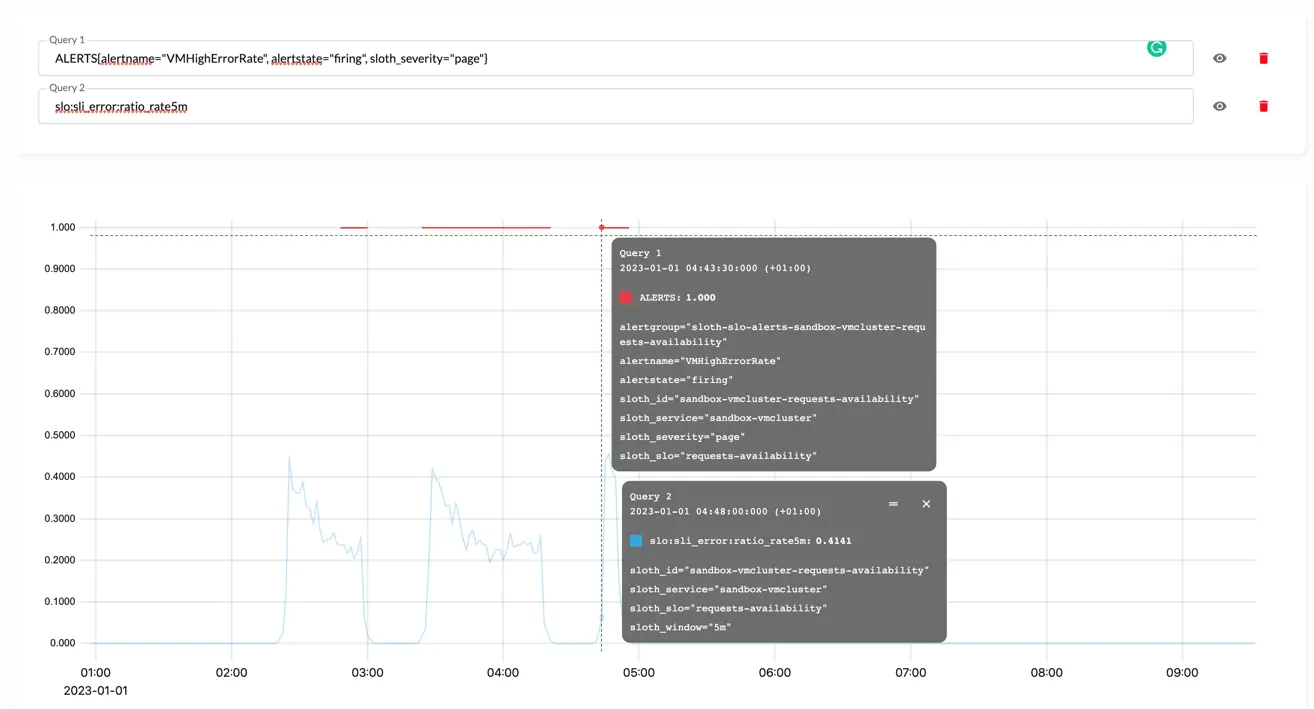 vmui screenshot of the triggered alerting rule after `replay`.
From the screenshot it is clear that alert actually triggered and its state correlates with errors rate spike.
Summary
#
Replay mode is a great feature for retroactive rules evaluation, both recording and alerting. The advantages of the
replay mode are the following:
- supports both recordings and alerting rules;
- support rules chaining within the group;
- uses Prometheus HTTP API and Remote Write protocol which makes it compatible with many other TSDBs;
- can be used for evaluating rules against single and clustered installations;
- can be configured with different endpoints for reading and writing, which makes it possible to migrate data from one installation to another via recording rules.
With all said, replay mode overcomes limitations of Prometheus backfilling for recording rules.
But the replay mode has its own limitations:
- Graphite query engine isn’t supported;
querytemplate function is disabled for performance reasons;limitgroup’s param has no effect during replay.
Leave a comment below or Contact Us if you have any questions!
comments powered by Disqus