- Blog /
- How to reduce expenses on monitoring: be smarter about data
How to reduce expenses on monitoring: be smarter about data
Share:


This blog post is also available as a recorded talk with slides.
Monitoring can get expensive due to the huge quantities of data that need to be processed. In this blog post, you’ll learn the best ways to store and process monitoring metrics to reduce your costs, and how VictoriaMetrics can help.
This blog post will only cover open-source solutions. VictoriaMetrics is proudly open source. You’ll get the most out of this blog post if you are familiar with Prometheus, Thanos, Mimir or VictoriaMetrics.
In the previous part, you saw how swapping VictoriaMetrics in for Prometheus can make your monitoring more efficient. If that was the equivalent of getting a faster car to win more races, in this part you’ll learn how to become a better driver, by being smarter about your monitoring.
Query tracing to find bottlenecks
#
Users of PostgreSQL might be familiar
with EXPLAIN,
a command used to give insight into how the database will run a query. The information that EXPLAIN ANALYZE provides
can help to figure out why a query is slow, and what can be done to speed it up.
VictoriaMetrics has a very similar tool known as query tracing. Query tracing helps take the guesswork out of speeding up VictoriaMetrics queries by showing exactly where time is spent in processing a query. If you would like to play with query tracing, you can visit play.victoriametrics.com and try it for yourself.
Take the following query as an example:
sum(rate(grpc_server_handled_total[5m]))
Running this over the last 30 days of data takes around 4 seconds to execute:
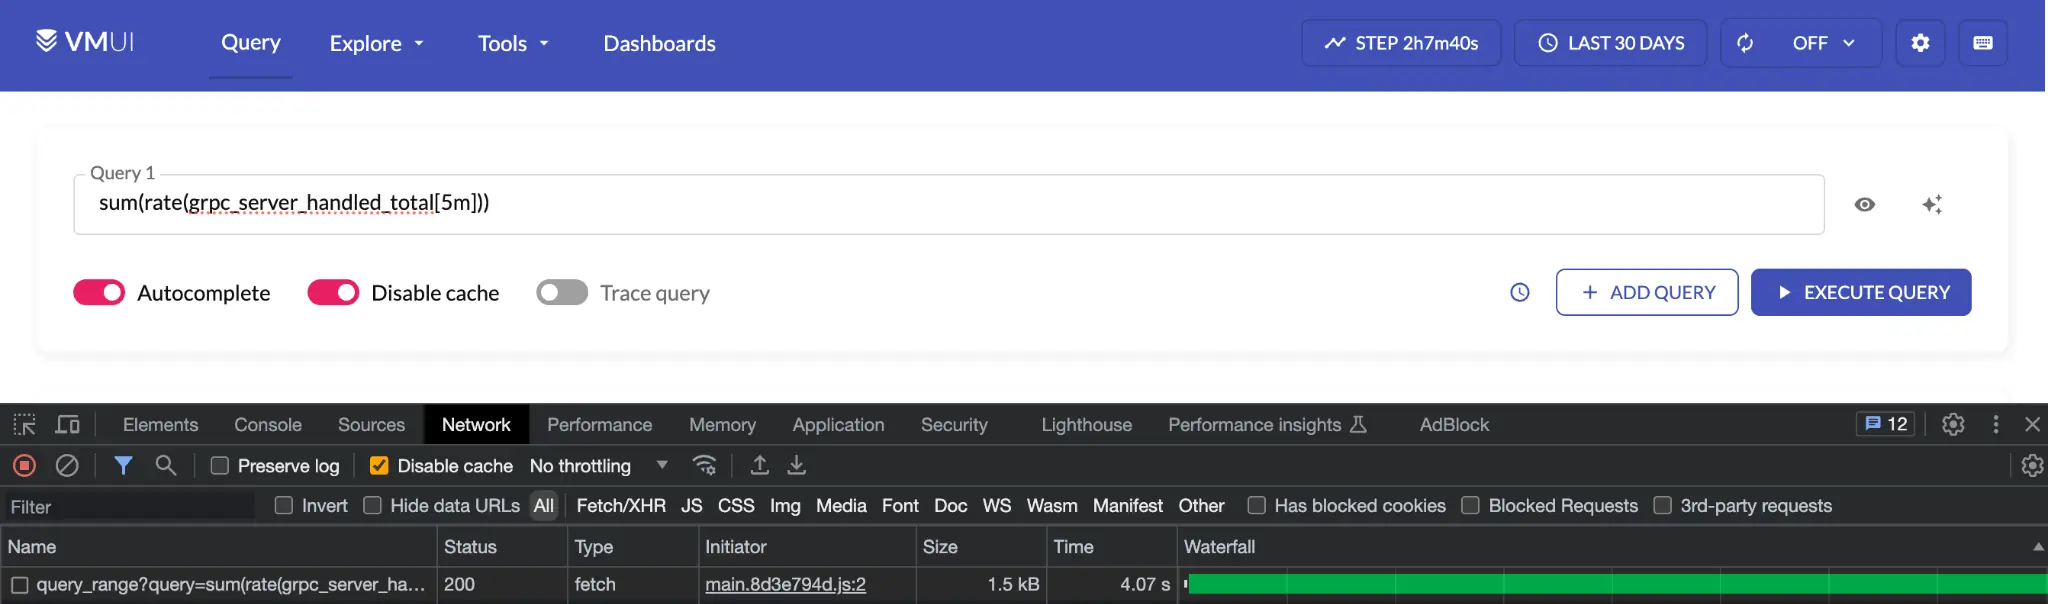 Query over 30d takes 4 seconds to execute. Can we learn why?
To figure out why, we can toggle the Trace query switch in the UI and re-run the query. This will return the steps
that VictoriaMetrics took when processing the query and the duration of each step:
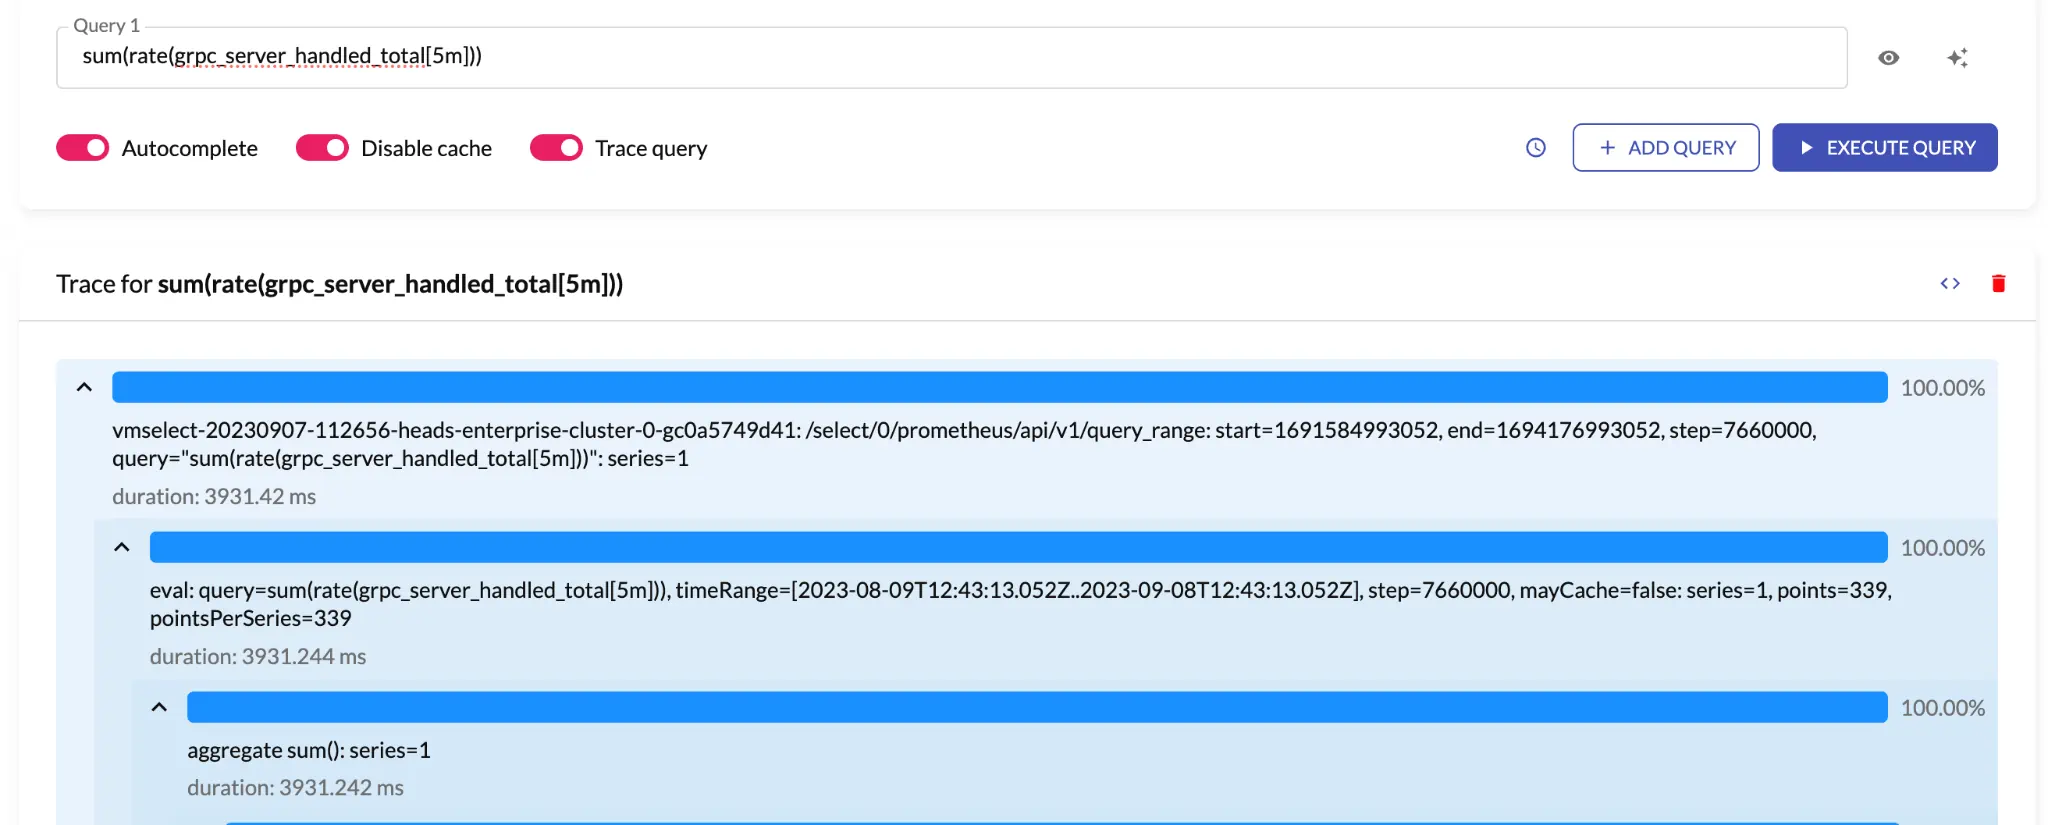 Query over 30d with enabled tracing.
In the screenshot above, the blue bars represent the percentage of time taken for each step. Child steps are represented with indentation and the absolute duration of each step is displayed underneath the step. Aside from being visible in the UI, the trace information is sent as a JSON. This means that you can also programmatically analyze traces.
Looking through the trace further, it looks like 91% of the time was spent on vmselect while aggregating
~9400 series containing 13 million data samples:
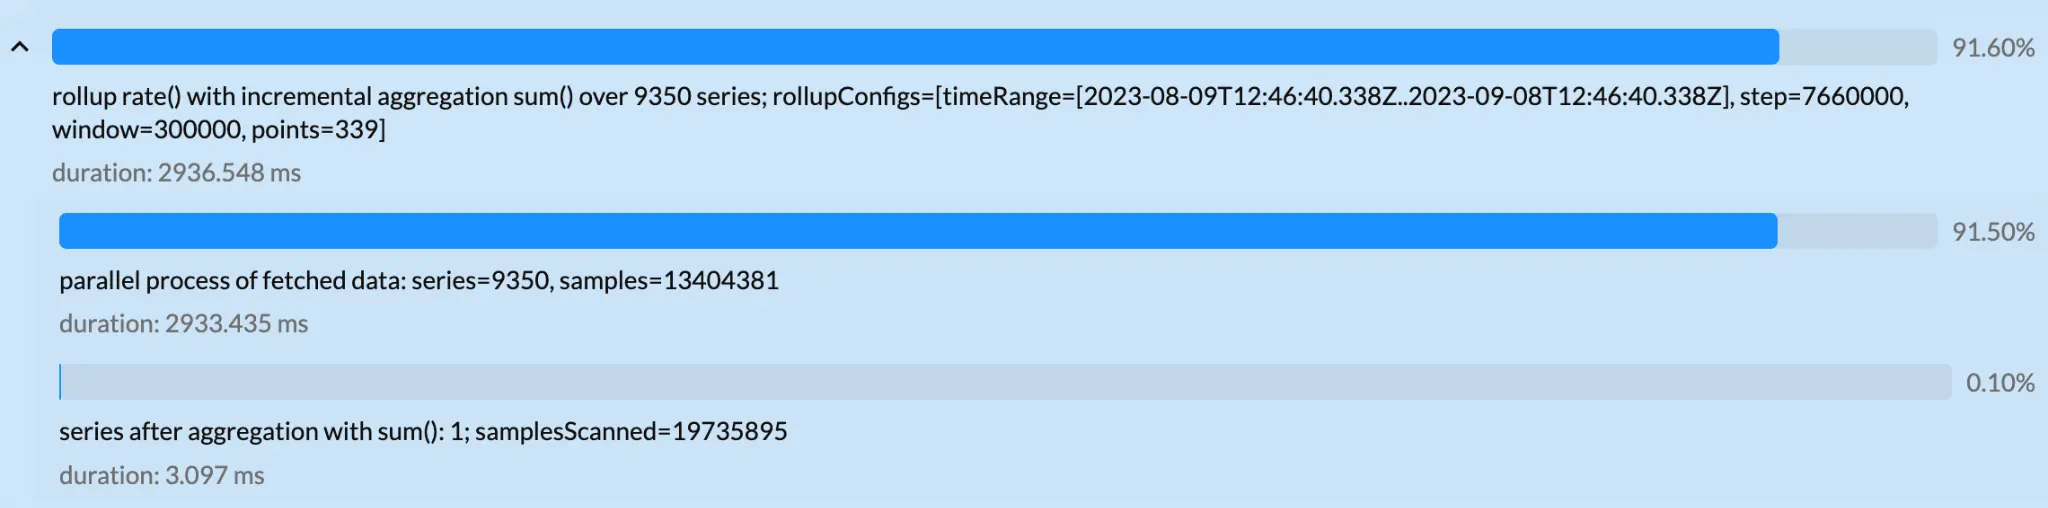 Query over 30d: processes 9.4K series, 13Mil data samples.
vmselect is the
VictoriaMetrics query processing frontend
and in the playground env it has only one allocated CPU. It looks like this query
is slow because it is processing a huge amount of data on a single CPU. To speed the query up, therefore, we can do one
of two things:
- Allocate more resources to
vmselect - Be smarter about data
In the next section, we’ll take a look at the cardinality explorer, a tool that helps us understand the amount of data we store and where we can trim data.
Cardinality explorer
#
Why are there over 9000 time series and so many samples returned for our query above? To understand our data, we can use a tool called cardinality explorer which is available through the VictoriaMetrics UI. For those following along with the playground, this is available through “Explore” > “Explore cardinality”.
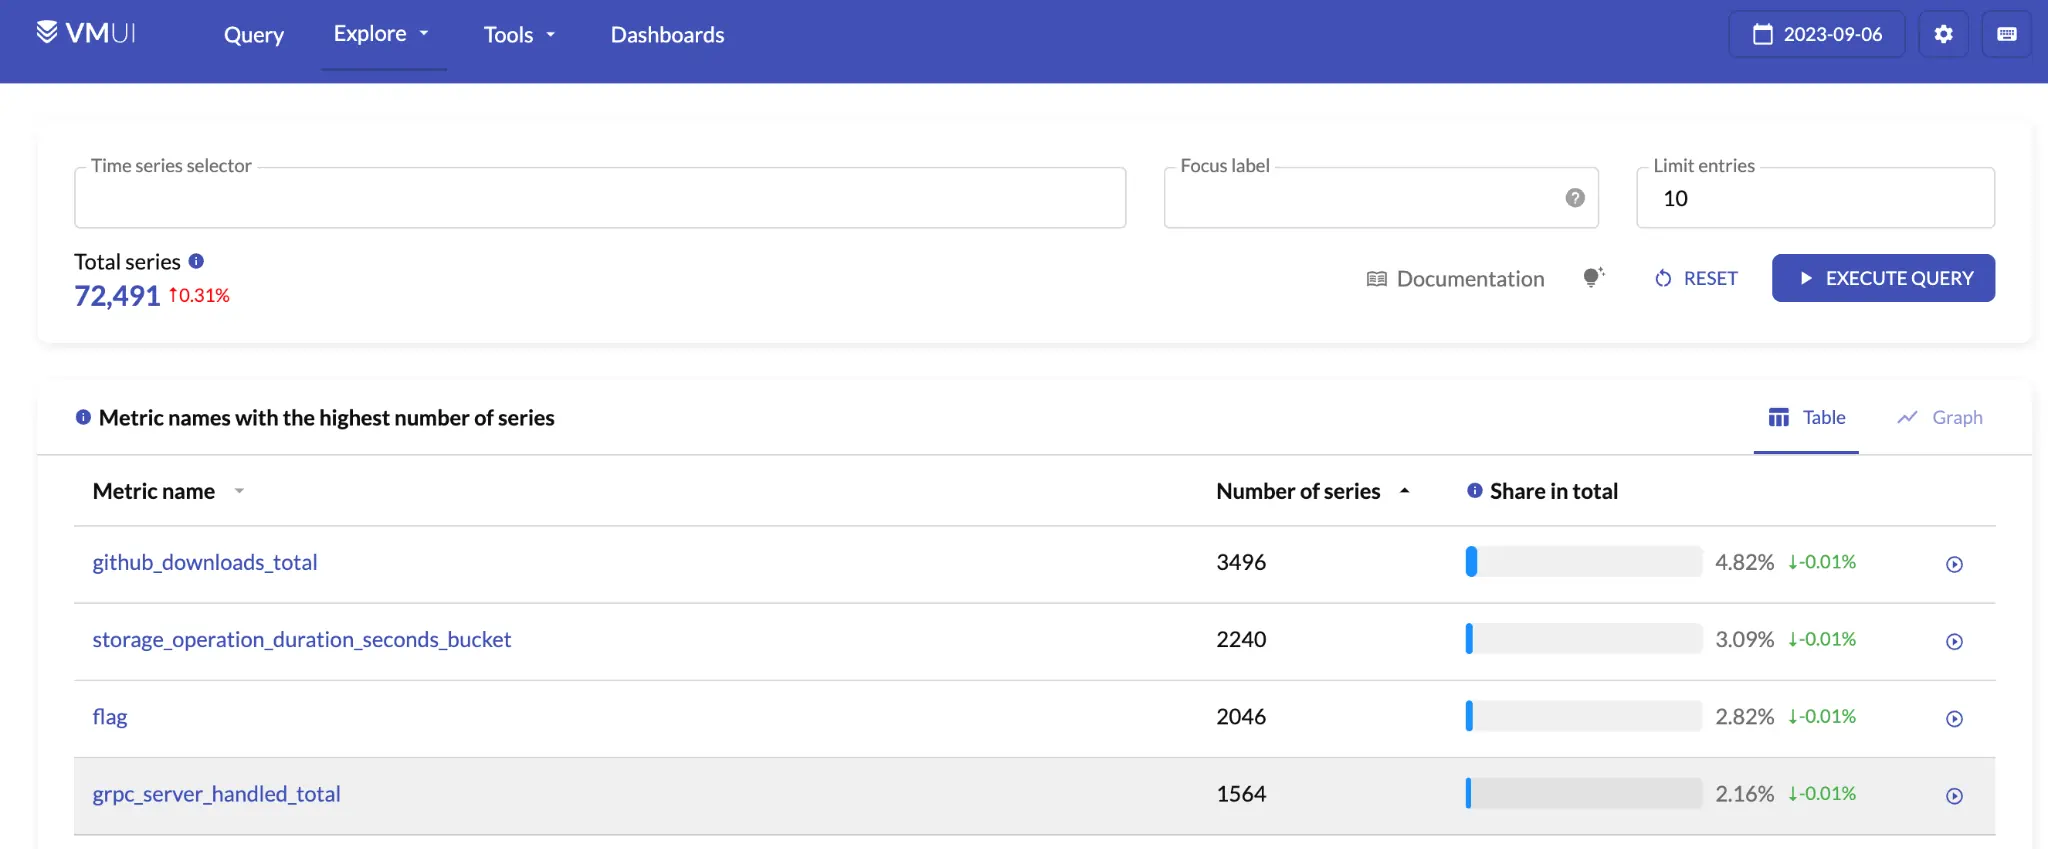 Cardinality explorer view.
Cardinality explorer shows you information about the metrics that are stored in VictoriaMetrics.
The default view gives the top metric names
by number of time series, and as you can see from the screenshot above,
grpc_server_handled_total is one of the largest metrics we are storing.
You may notice that cardinality explorer reports that it only has 1500 time series. This is because cardinality explorer shows you a single-day view, while the query we were executing earlier was over 30 days. Over time, as applications are deployed and redeployed, old time series become inactive and new time series are created. This effect is known as churn rate and it increases the number of time series stored over time.
Clicking the metric name will bring you to a drilled-down view that shows the labels that are stored for the metric.
Below is what this looks like for grpc_server_handled_total:
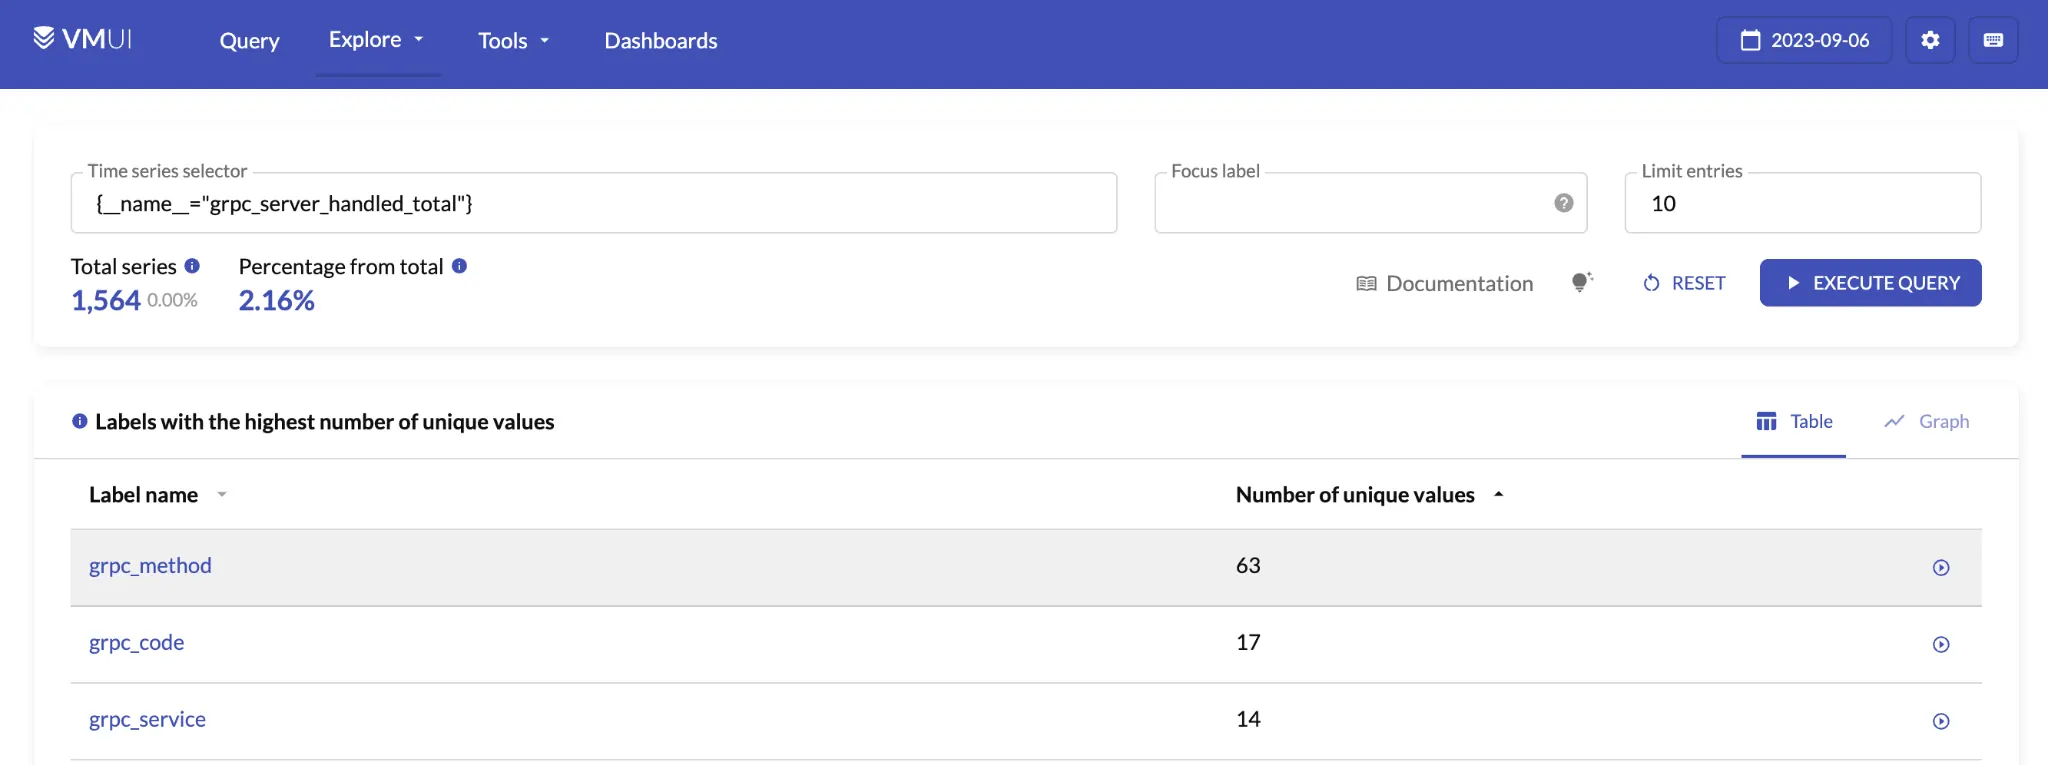 Cardinality explorer: `grpc_server_handled_total` metric details.
The most “expensive” label on this metric is grpc_method
as it has 63 unique values. While 63 doesn’t sound like a lot, the number of unique time series that we have to store
for a metric, i.e. the cardinality, is calculated
by multiplying the number of unique values in each label together. This means that grpc_method is making the
number of time series our query has to retrieve 63x larger.
The query we originally ran doesn’t need the precision that grpc_method provides. Since we don’t need this particular
label, we can get rid of it and our query will run significantly faster. Keeping cardinality under control is a powerful
tool when dealing with time-series databases. For more, take a look at
our cardinality explorer blog post.
Cardinality explorer allows you to identify:
- Metric names with the highest number of series
- Labels with the highest number of series
- Values with the highest number of series for the selected label
- label=name pairs with the highest number of series
- Labels with the highest number of unique values
Cardinality explorer gives valuable insights into why the metric we want to explore is expensive and hints for how to make it cheaper. It is available by default in VictoriaMetrics, and you can even query Prometheus using the cardinality explorer starting in VictoriaMetrics v1.94.0.
Streaming aggregation vs recording rules
#
When working with Prometheus, you might use recording rules to improve query speed. Recording rules pre-aggregate metrics by creating a new metrics set but with a reduced amount time series. Querying pre-aggregated metrics with lower number of time series is faster than querying original metrics.
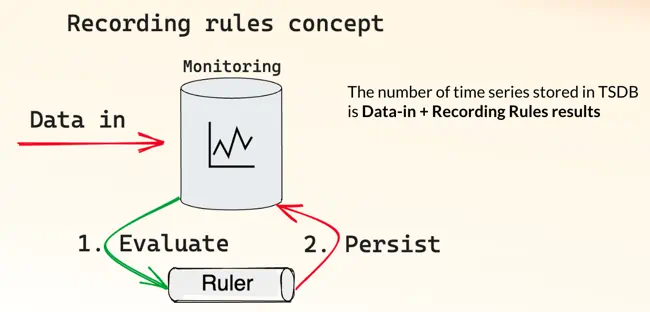 Recording rules concept: data gets persisted into database and then aggregated via Ruler.
Recording rules operate on data that has already been written to the database, and write the aggregated version of that data back to the database. This means that recording rules add to the amount of data that you need to store in total. Recording rules need to be executed on interval basis, contributing to the overall load on the database.
VictoriaMetrics provides an alternative to recording rules in the form of streaming aggregation. Streaming aggregation is a similar concept to recording rules, except the aggregation happens before the data ever hits the database.
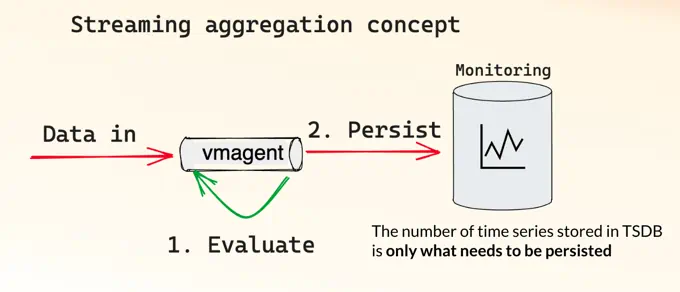 Stream aggregation concept: data gets aggregated before it gets into database.
By aggregating the data before it has been written, you only end up storing the data that you will later query. Below is an example of vmagent configuration for streaming aggregation:
- match: "grpc_server_handled_total"   # time series selector
  interval: "2m"                       # on 2m interval
  outputs: [ "total" ]                 # aggregate as counter
  without: [ "grpc_method" ]           # group without label

# Result:
#   grpc_server_handled_total:2m_without_grpc_method_total
The above configuration is already available on the playground, so you can query it if you are following along. Querying this metric instead of the non-aggregated metric reduces the time taken from 4 seconds to a fraction of a second:
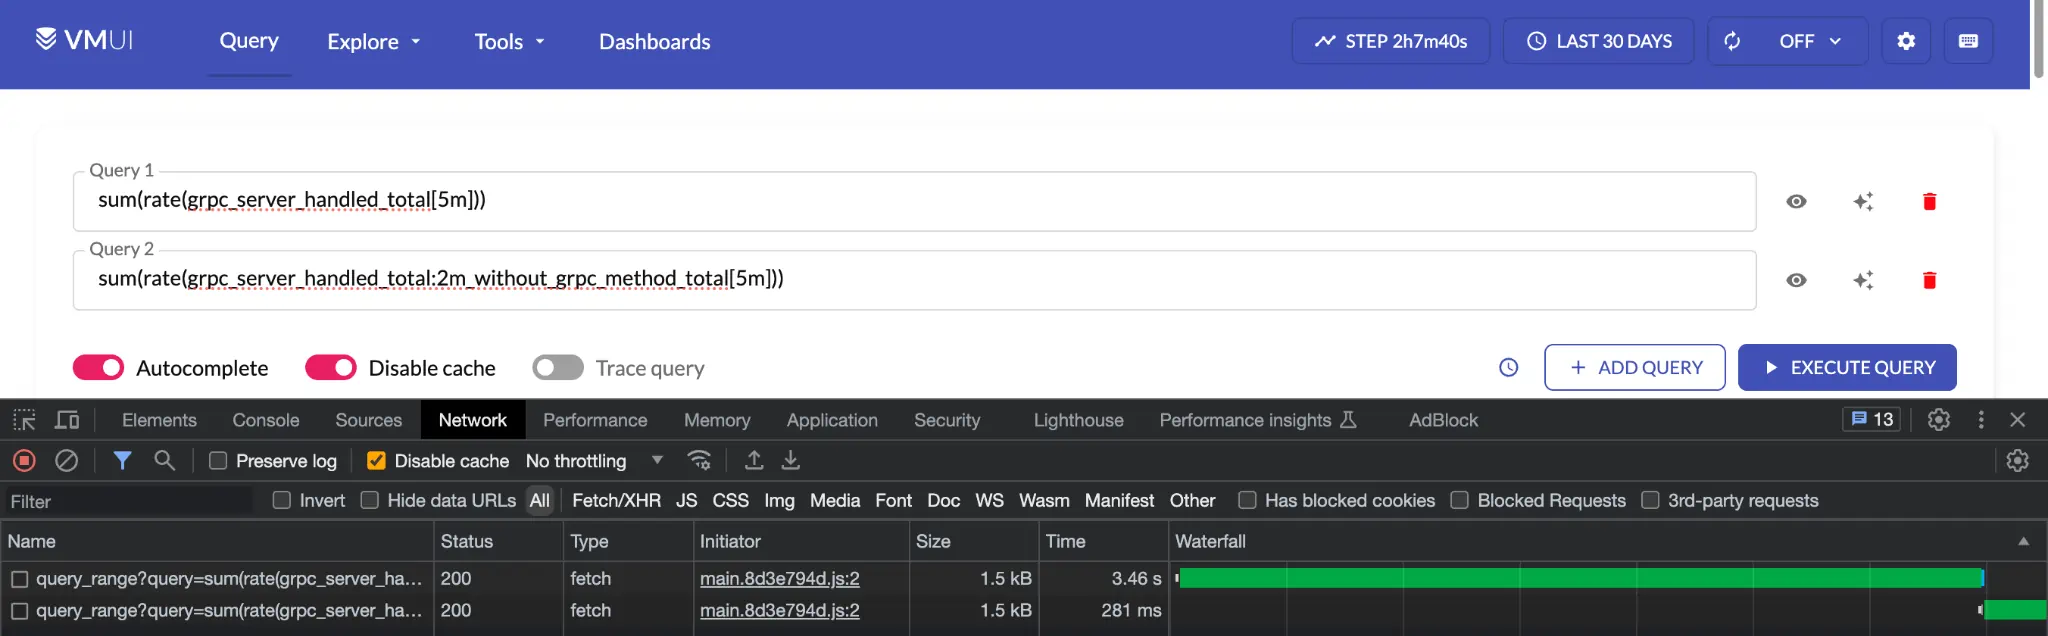 Comparing queries with raw metrics and metrics produced by stream aggregation.
Streaming aggregation provides both cost savings and speed boosts to your queries:
- Aggregates incoming samples in streaming mode before data is written to remote storage
- Works both with metrics from any supported data ingestion protocol and metrics scraped from Prometheus-compatible targets
- Is a statsd alternative
- Is a recording rules alternative
- Reduces the number of stored samples
- Reduces the number of stored series
- Is compatible with any tool supporting the Prometheus remote write protocol
Stream aggregation is available in vmagent, metrics collector from VictoriaMetrics ecosystem. Compatibility with Prometheus standards means vmagent and stream aggregation can be used with Prometheus or any other system which supports Prometheus remote-write protocol.
You can read more in the streaming aggregation docs.
Reducing significant figures
#
Operations involving floating-point arithmetic are tend to produce results with high entropy, measurement errors or false precision.
For example, let’s take a look at common recording rule that calculates average CPU usage:
rules:
  - record: instance:cpu_utilization:ratio_avg
    expr: 100 - (avg by (instance) (rate(node_cpu_seconds_total{mode="idle"}[1m])) * 100)
This recording rule will produce the following results on the playground:
{"instance":"10.71.0.8:9101"}   37.12491991997818
{"instance":"10.142.0.48:9100"} 37.12499331333188
If you were asked which instance consumed more CPU in the results above, you would likely go digit-by-digit and stop
at the first digit that was different. Similarly, if you were asked what the average consumption of instance
10.71.0.8:9101 was, you would likely say 37%, not 37.12491991997818%. In both of these cases, we don’t need
the full “length” of the numbers to provide an answer. But storing samples with such values heavily impacts
compression ratio in a negative way, due to high entropy of the values.
VictoriaMetrics lets you configure the number of significant figures that you want to keep. Reducing the number of significant figures reduces the number of possible values and makes it more likely that two values will be the same. This improves the compression ratio of the metrics you collect.
According to the tests described in
this blogpost,
going from 13 significant figures to 8 reduces the compressed size of each sample from 1.2B to 0.8B,
saving of a third from your network bandwidth/disk usage. If you took the first sample from above and set it to
8 significant figures, it would go from 37.12491991997818 to 37.12492. For most applications,
this loss of precision is barely noticeable.
Saving network costs
#
Network usage is also a monitoring expense. It is normally free within the same cloud provider networking zone, but is paid between different Availability Zones.
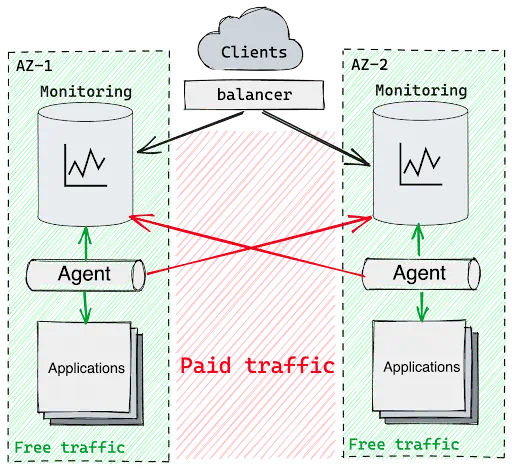 The network traffic between Availability Zones.
This means that if you want to build a monitoring platform with high availability, then you will need to send traffic across zones. And the price for this traffic, depending on the cloud provider costs, could become a significant part of your monthly bill.
VictoriaMetrics vmagent uses the enhanced version of Prometheus remote-write protocol with better compression:
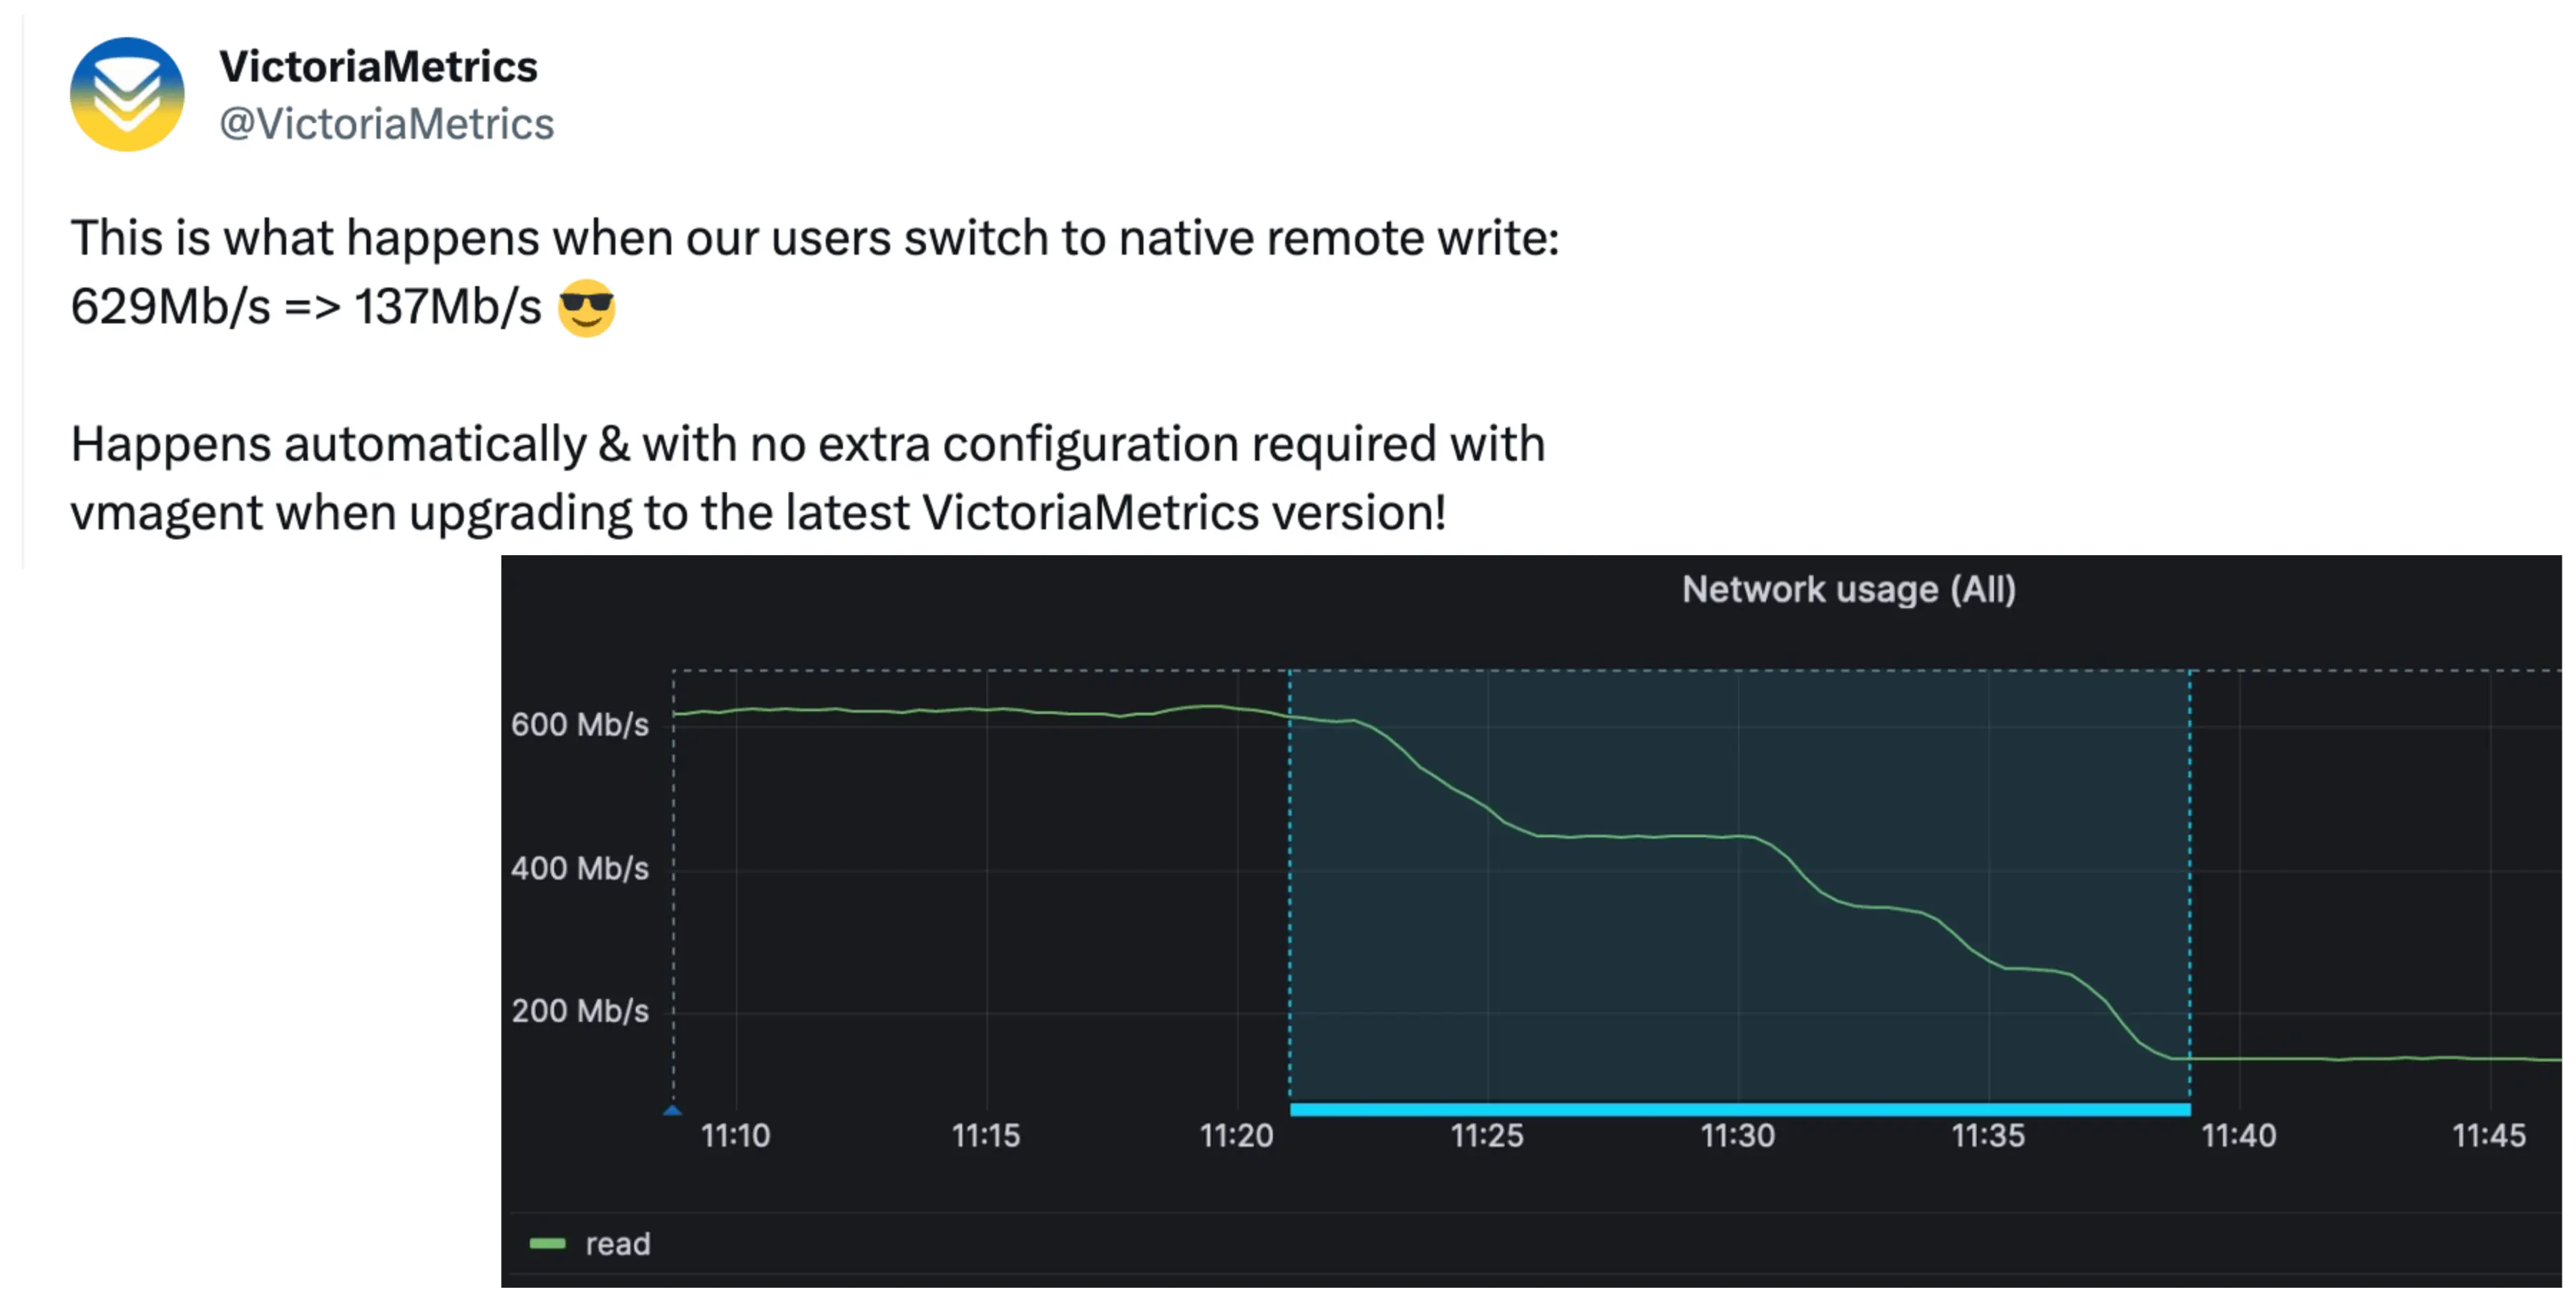 The change in network traffic after switching to VictoriaMetrics-native `remote_write` protocol.
Above is a screenshot of the network usage before and after a VictoriaMetrics customer switched
the VictoriaMetrics-native remote_write protocol. The user achieved 4.5x less network usage than with the default
Prometheus remote_write protocol, resulting in a direct impact on their cloud provider bills.
Aside from achieving smaller network usage out of the box, VictoriaMetrics can also be configured to reduce network usage further by trading CPU, latency, or precision for less network usage:
| Settings | Trade-off |
|---|---|
| remoteWrite.vmProtoCompressLevel | Increased compression level, traded for higher CPU usage |
| remoteWrite.maxBlockSize, remoteWrite.maxRowsPerBlock, remoteWrite.flushInterval | Increased batch size leading to better compression ratio, traded for latency |
| remoteWrite.significantFigures, remoteWrite.roundDigits | Reduced precision/entropy, better compression ratio |
For more, we wrote a whole blog post on saving network costs using VictoriaMetrics.
Conclusion
#
Monitoring can be costly and create large engineering burdens. VictoriaMetrics helps you reduce the cost of your monitoring out of the box, and small configuration tweaks can further reduce your expenses. What’s more, VictoriaMetrics is completely open ‘source and support is available from the team that wrote it.
This article was originally a talk at stackconf 2023. You can watch the talk on YouTube, or read the slides. This YouTube playlist contains more talks from our team.
Leave a comment below or Contact Us if you have any questions!
comments powered by Disqus