- Blog /
- How to reduce expenses on monitoring: Swapping in VictoriaMetrics for Prometheus
How to reduce expenses on monitoring: Swapping in VictoriaMetrics for Prometheus
Share:


This blog post is also available as a recorded talk with slides.
Monitoring can get expensive due to the huge quantities of data that need to be processed. In this blog post, you’ll learn the best ways to store and process monitoring metrics to reduce your costs, and how VictoriaMetrics can help.
This blog post will only cover open-source solutions. VictoriaMetrics is proudly open source. You’ll get the most out of this blog post if you are familiar with Prometheus, Thanos, Mimir or VictoriaMetrics.
See the second blog post in this series - How to reduce expenses on monitoring: be smarter about data.
Before we can talk about reducing monitoring expenses, we first need to understand monitoring systems. Below is a typical monitoring architecture:
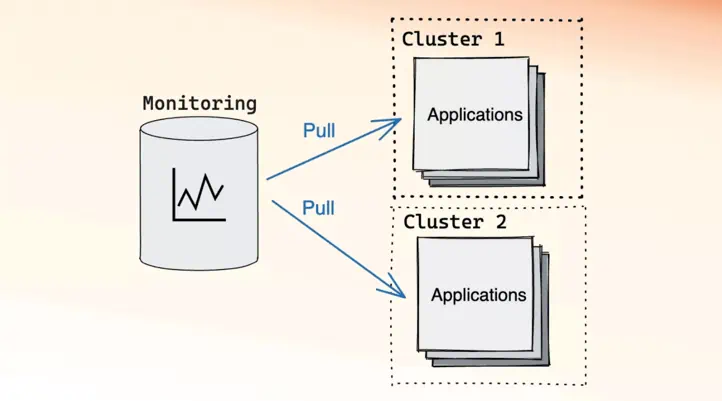 Example of pull model monitoring
In the above architecture, there is a monitoring system that is responsible for periodically scraping metrics from the services it knows about. This architecture is called the pull model, since the monitoring system is actively pulling data. The pull model was popularized by Prometheus and is also supported by VictoriaMetrics.
The complement to the pull model is the push model:
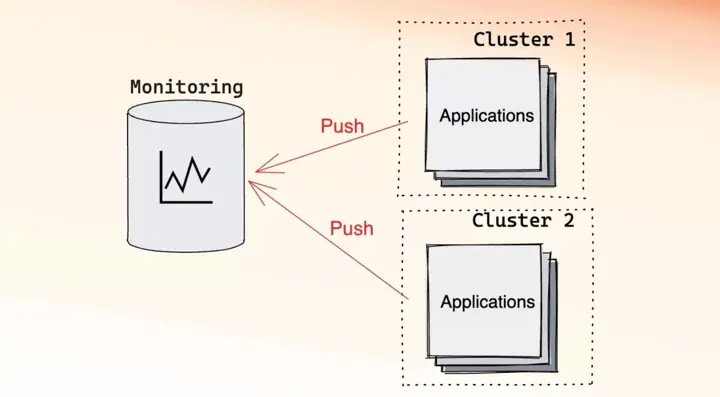 Example of push model monitoring
The push model is the inverse of the pull model. In the push model, applications know about the monitoring system and are responsible for pushing metrics into it. The push model has been supported by VictoriaMetrics from the beginning, is supported by Mimir, and recently Prometheus introduced support for it behind a feature flag.
It is possible to mix and match the two models:
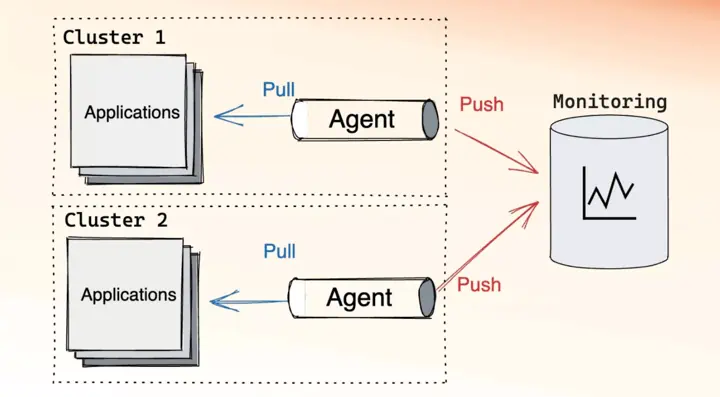 Example of mixed model monitoring: push and pull
In the mixed topology, there is usually an agent that is responsible for collecting metrics, similar to the monitoring system in the pull model. The agent is placed as close to the applications as possible, ideally within the same cluster. After collecting the metrics, the agent is then responsible for sending them to the monitoring system, like the application would in the push model.
No matter which architecture you choose, there will be four factors that contribute to your infrastructure bill at the end of the month:
- CPU
- Memory
- Disk
- Network
Making your systems more efficient is a bit like trying to win more car races, in that you have a few paths to victory: either get a faster car, or become a better driver, or both. A faster car in monitoring terms could mean using a more efficient software, while becoming a better driver could mean applying tricks to reduce the work your monitoring system needs to do. In this series of blogposts, you will see how to reduce expenses using these two different approaches.
Swapping in VictoriaMetrics for Prometheus
#
The monitoring equivalent of getting a faster car is to swap your current database for a more efficient one. In this section, we’ll take a look at swapping in VictoriaMetrics for Prometheus.
VictoriaMetrics is a drop-in replacement for Prometheus, with little to no configuration changes required. You can just swap the binaries in many cases. If you’re interested in trying VictoriaMetrics with your system, check out the docs for more information.
Benchmark setup
#
For benchmarking purposes, we use our Remote write benchmark tool which we already mentioned in previous blog posts:
- How to generate 100 million samples/s of production-like data
- Grafana Mimir and VictoriaMetrics: performance tests
This benchmark was designed to test time series databases by pushing data. While Prometheus supports both push and pull models, its pull model seems much more efficient and optimized right now. So to make the benchmark fair we configured both Prometheus and VictoriaMetrics single-node to scrape the same list of targets using the same config, and execute the same list of read queries generated by a standalone ruler:
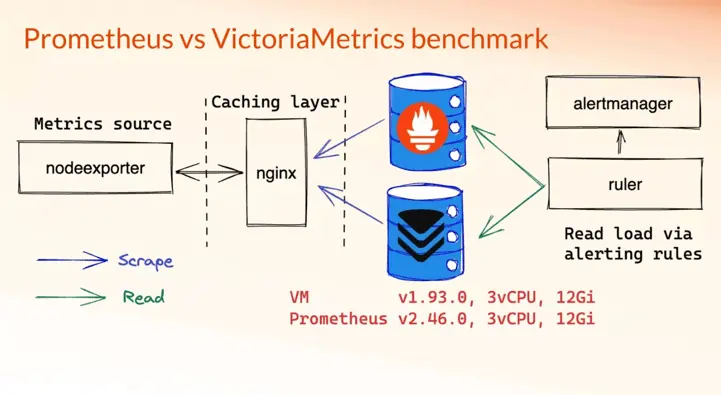 Architecture of benchmark suite for testing read/write load on VictoriaMetrics and Prometheus. The benchmark repo is available here
Here are some of the specifications for this benchmark:
- VictoriaMetrics and Prometheus running on the same instance configuration (3 vCPUs, 12 GiB RAM);
- 1000 Node Exporter targets to simulate monitoring of 1000 instances, each target exposes about 1200 unique time series;
- 15s scrape interval, defines how frequently to scrape targets.
For 1000 targets 1200 time series each the ingestion should be around
1000 * 1200 / 15s = 80K samples/s; - 30s rules evaluation interval, defines how often to send read queries. For this set of rules benchmark would generate about 1 read request per second;
- 5% churn rate every 10 minutes,
defines how many targets will change their labels within 10min interval. In other words,
1000 targets * 5% * 1200 = 60K new time serieswill be generated every 10 minutes.
The churn rate above simulates metric targets changing over time. This is of particular interest when monitoring applications deployed on Kubernetes. Kubernetes has the concept of pods, which are ephemeral instances of an application. Whenever a new version of an application is deployed or needs to be restarted, a new pod is created. Since each pod has a randomly generated name, recreating a pod creates a new metrics target and invalidates the old one.
Results
#
The benchmark ran for seven days in this experiment. System metrics for both, Prometheus and VictoriaMetrics, were captured on Grafana snapshot here.
On average, the ingestion rate for both Prometheus and VictoriaMetrics was around ~80 K samples/second:
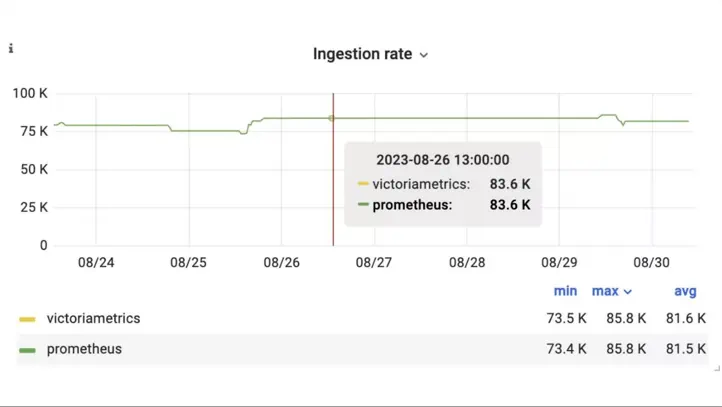 Ingestion rate of samples/s into VictoriaMetrics and Prometheus during the benchmark
The set of time series that a database recently wrote data to, or read data from, is referred to as the set of active time series. Usually, the number of active time series has the highest impact on the memory usage. Below is the graph showing the number of active time series for Prometheus and VictoriaMetrics during this benchmark:
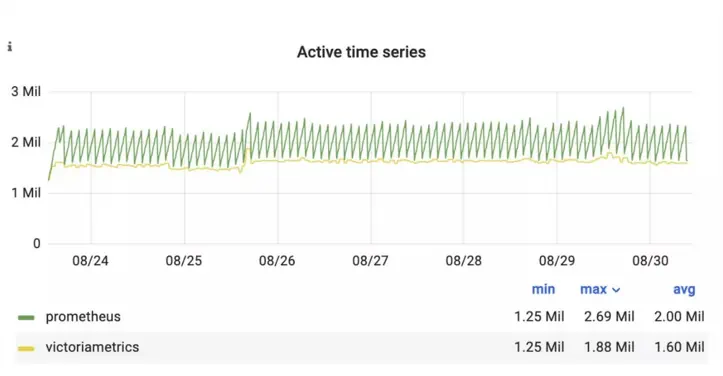 Active time series of VictoriaMetrics and Prometheus during the benchmark
While the two lines look quite different, this is just due to how the two databases measure active time series. VictoriaMetrics has a sliding time window, while Prometheus (Thanos and Mimir) has fixed two hour intervals for collecting metrics and flushing them to disk.
In terms of CPU, VictoriaMetrics and Prometheus behaved similarly:
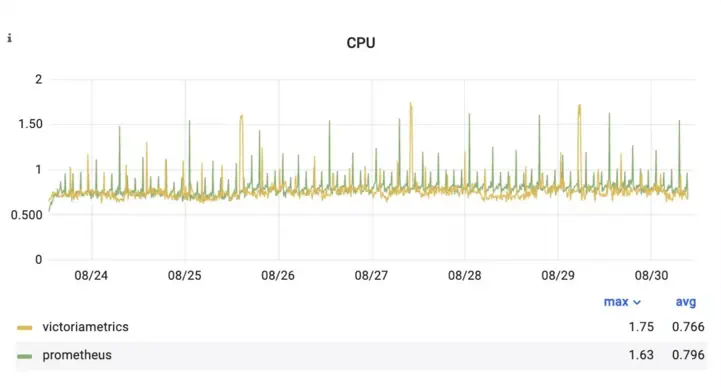 CPU usage of VictoriaMetrics and Prometheus during the benchmark
While the results above were comparable between VictoriaMetrics and Prometheus, the results get interesting when looking at query latency. VictoriaMetrics was on average 16x faster than Prometheus using the same list of alerting rules and the same dataset:
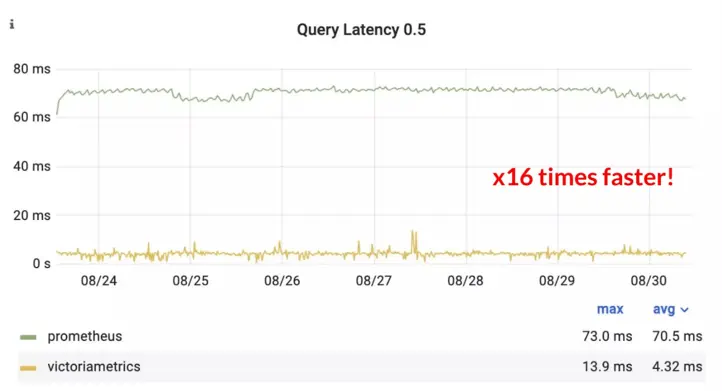 Latency (50th percentile) of read queries for VictoriaMetrics and Prometheus during the benchmark
The above graph is at the 50th percentile. This means that the median time VictoriaMetrics takes to serve a query is 16x faster than the average time Prometheus takes. This gap closes when looking at the 99th percentile, i.e. the slowest queries, but VictoriaMetrics is still 1.9x faster:
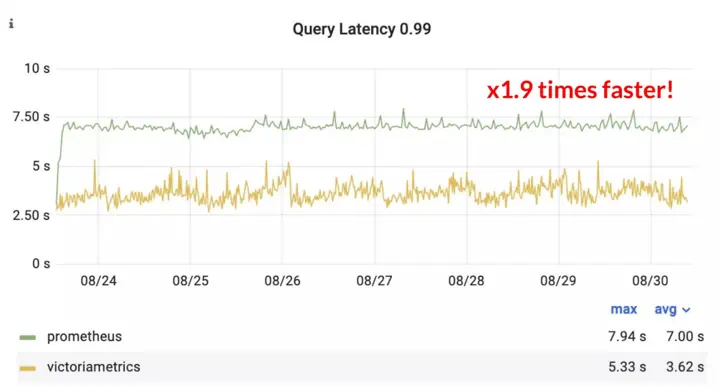 Latency (99th percentile) of read queries for VictoriaMetrics and Prometheus during the benchmark
As well as serving reads faster, VictoriaMetrics also used 1.7x less memory than Prometheus:
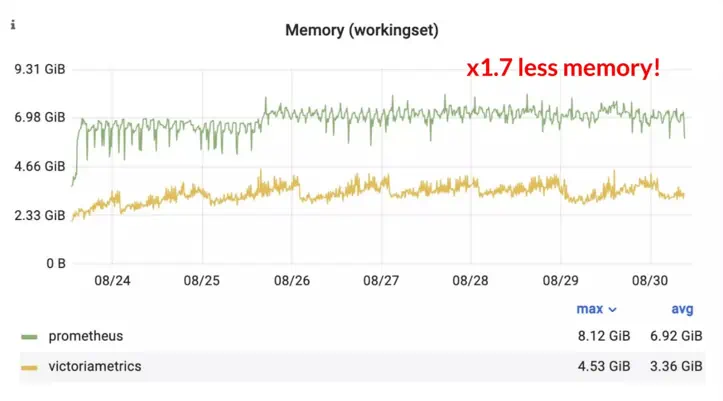 Memory usage of VictoriaMetrics and Prometheus during the benchmark
VictoriaMetrics uses an improved version of the Gorilla compression method that Prometheus uses, as documented by our CTO, Aliaksandr Valialkin, in this blog post. This results in VictoriaMetrics using 2.5x less disk space for the same data:
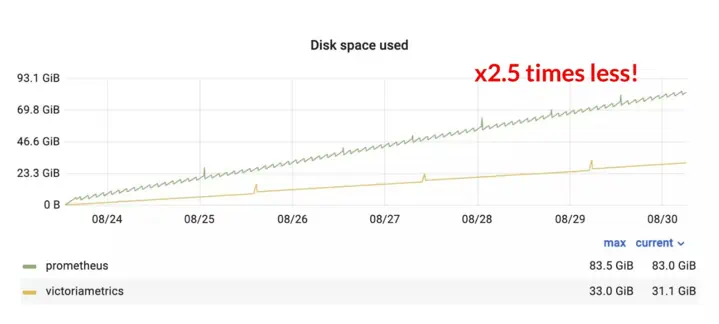 Disk usage of VictoriaMetrics and Prometheus during the benchmark
Below is a summary of the results from this experiment:
| Prometheus | VictoriaMetrics | |
|---|---|---|
| CPU avg used | 0.79/3 cores | 0.76/3 cores |
| Disk usage | 83.5 GiB | ✅ 33 GiB |
| Memory max used | 8.12/12 GiB | ✅ 4.5/12 GiB |
| Read latency 50th | 70.5ms | ✅ 4.3ms |
| Read latency 99th %ile | 7s | ✅ 3.6s |
Swapping in VictoriaMetrics for Prometheus can provide huge gains for little effort! This is one of the simplest things one could do to reduce expenses on monitoring. However, VictoriaMetrics provides additional tools and features for improving cost-efficiency and performance. See the second blog post in this series - How to reduce expenses on monitoring: be smarter about data.
Leave a comment below or Contact Us if you have any questions!
comments powered by Disqus