- Blog /
- What's New in VictoriaMetrics Cloud Q3 2026? VictoriaTraces, a Revamped Overview and Monitoring, Alerting for Logs and Traces, and a new Beta coming soon
What's New in VictoriaMetrics Cloud Q3 2026? VictoriaTraces, a Revamped Overview and Monitoring, Alerting for Logs and Traces, and a new Beta coming soon
Share:


Q3 2026 has been one of the greatest quarters for VictoriaMetrics Cloud, and that is thanks to
the whole team, including open source, of course. The big milestone is that
VictoriaTraces is now part of VictoriaMetrics Cloud,
which means that the full VictoriaStack lives in one managed place, with a single bill
and the same experience users already know.
Alongside that, we kept pushing on transparency. The Overview and Monitoring pages have been
revamped to show users everything we look at when we investigate a deployment ourselves. We also added
Alerting Rules for Logs and Traces, enabled stream aggregation for VictoriaMetrics Single
instances, and much more. Also, stay tuned because we’re launching a closed beta for the not-that-much secret
project we mentioned last quarter, code-named Visum: our upcoming visualization tool.
As usual, if you missed our Quarterly Live Update, you can watch the full recording here:
Let’s go!
VictoriaTraces in VictoriaMetrics Cloud
#
Users of VictoriaMetrics Cloud expect everything to be managed. So we’ve worked this quarter to finally provide a complete and centralized observability suite with all signals: metrics, logs and traces.
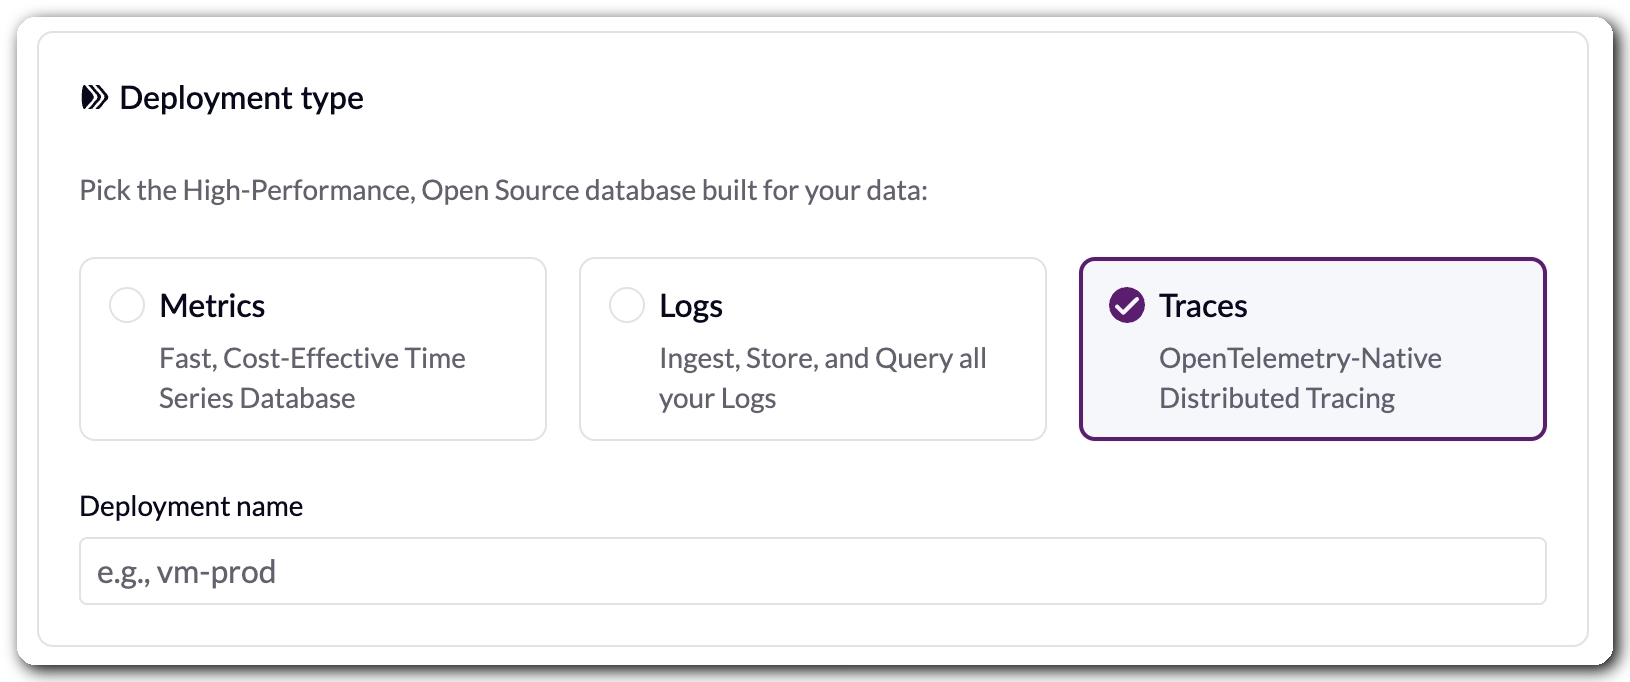
With VictoriaTraces, the full VictoriaStack is ready to be installed and managed by our team within
minutes. Users only need to pick the type, the region and a tier, and the deployment will be up and
running in no time.
Exploring Spans
#
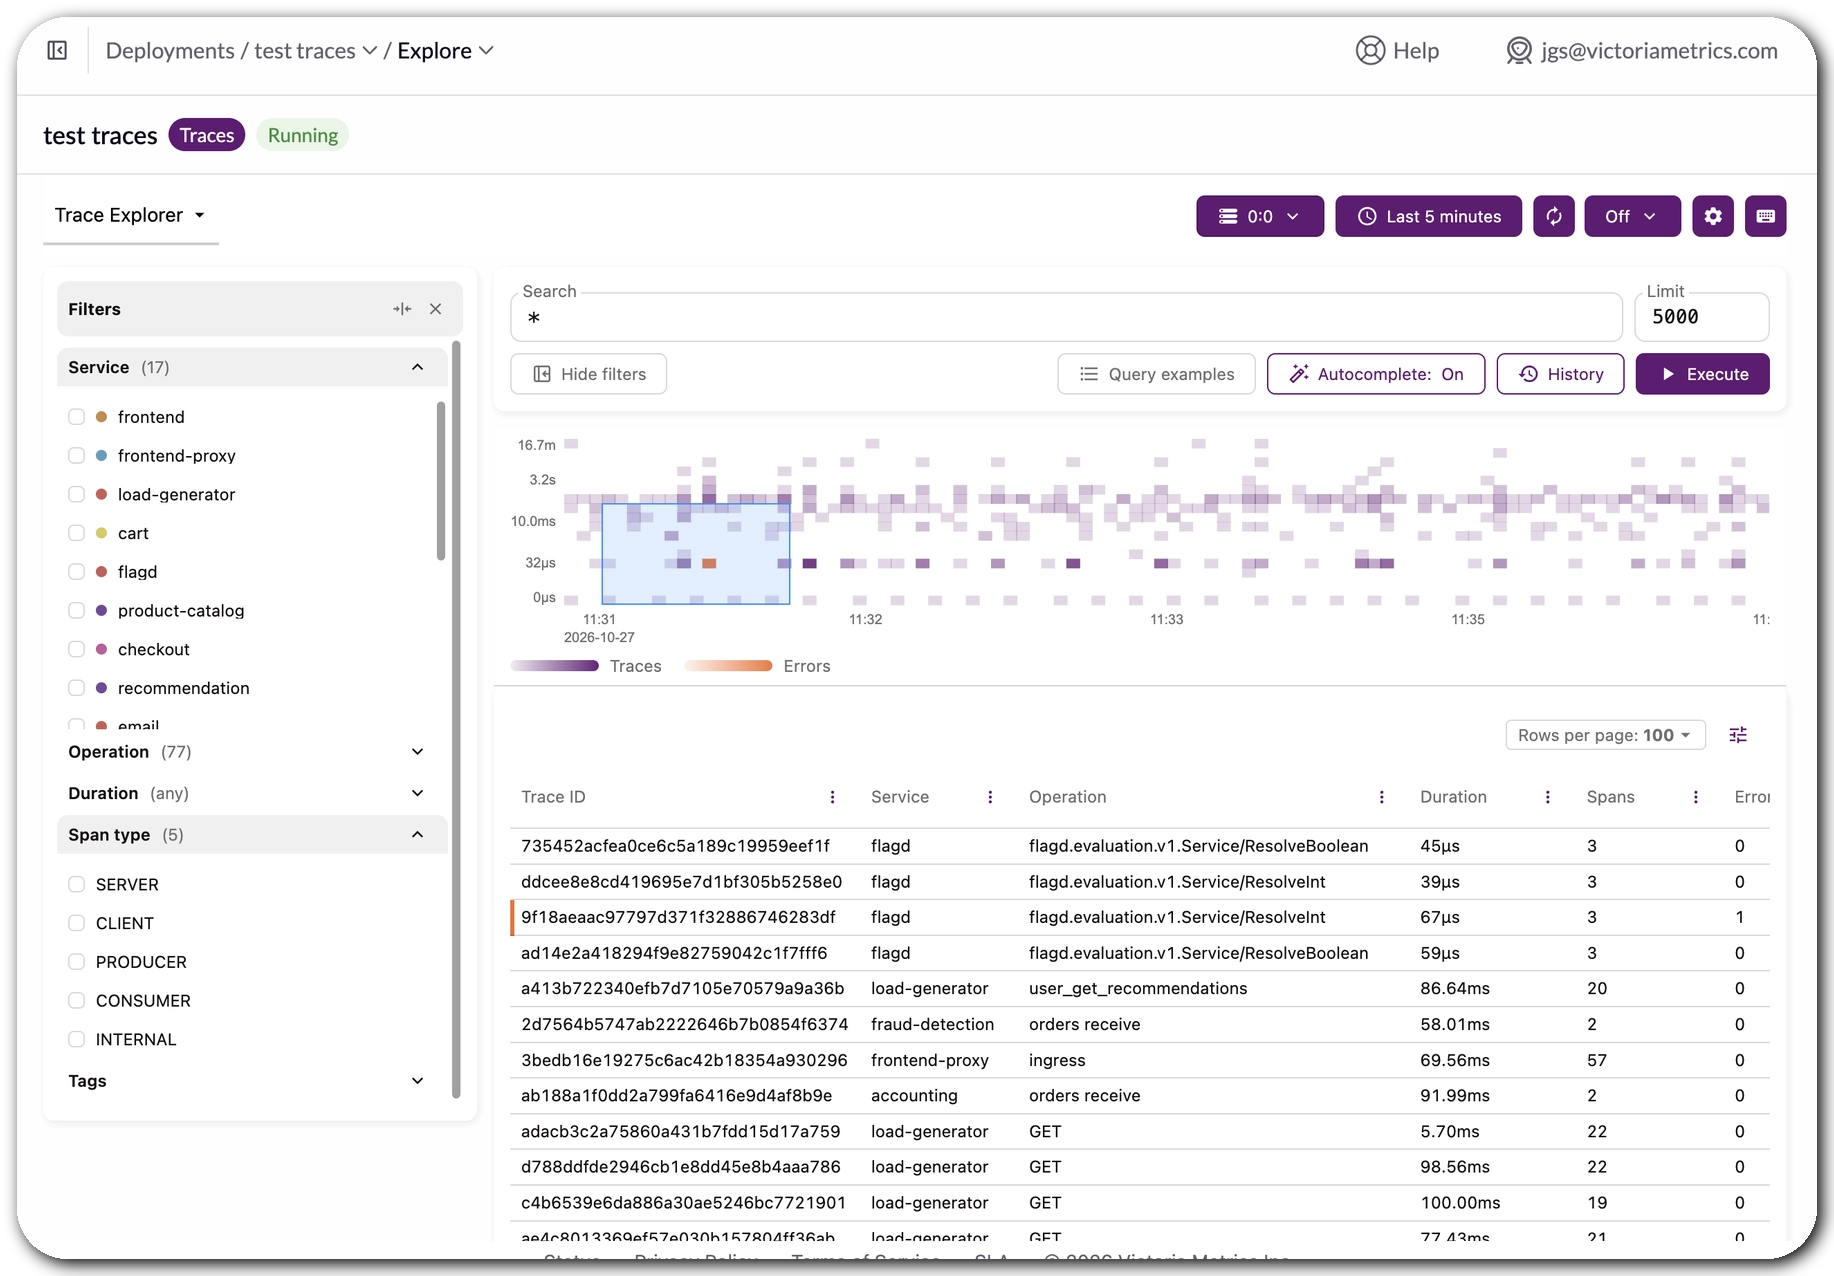
When we were about to release VictoriaTraces in VictoriaMetrics Cloud, the first question was: what do we give users to explore their data? Then the team started working on it. Those of us who have been in the tracing world for years can tell that this UI is fantastic.
It is called VTUI (first available in open source, of course), and it’s now included in
VictoriaMetrics Cloud. This means that there’s no extra tooling needed anymore.
If you like what you’re seeing, wait for what’s coming at the end of this post!
From the Explore section, now users can:
- Select the area of time to investigate within a heatmap that highlights errors
- Filter by service, operation, duration, errors, span types and more
- Query with LogsQL, helped by
Examples,AutocompleteandTenant selection - Check the
Query history, which is super useful in the middle of an investigation
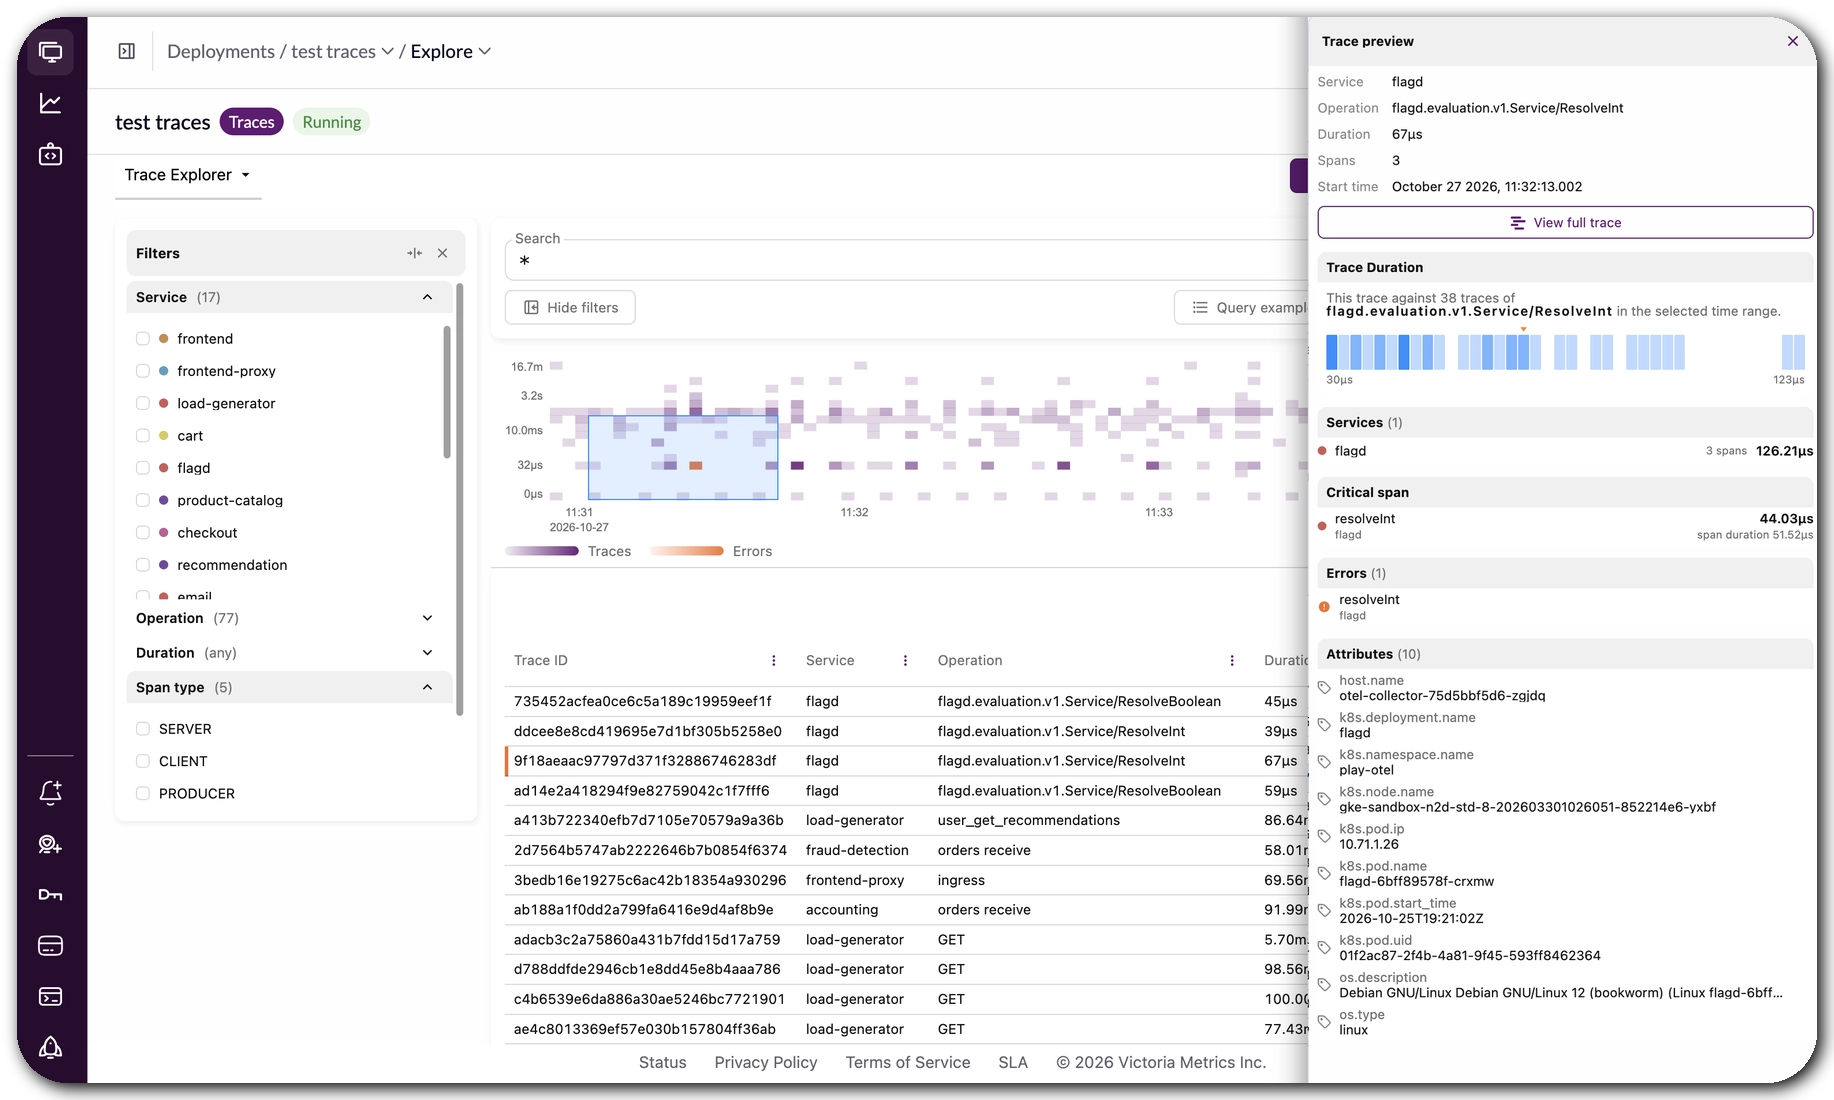
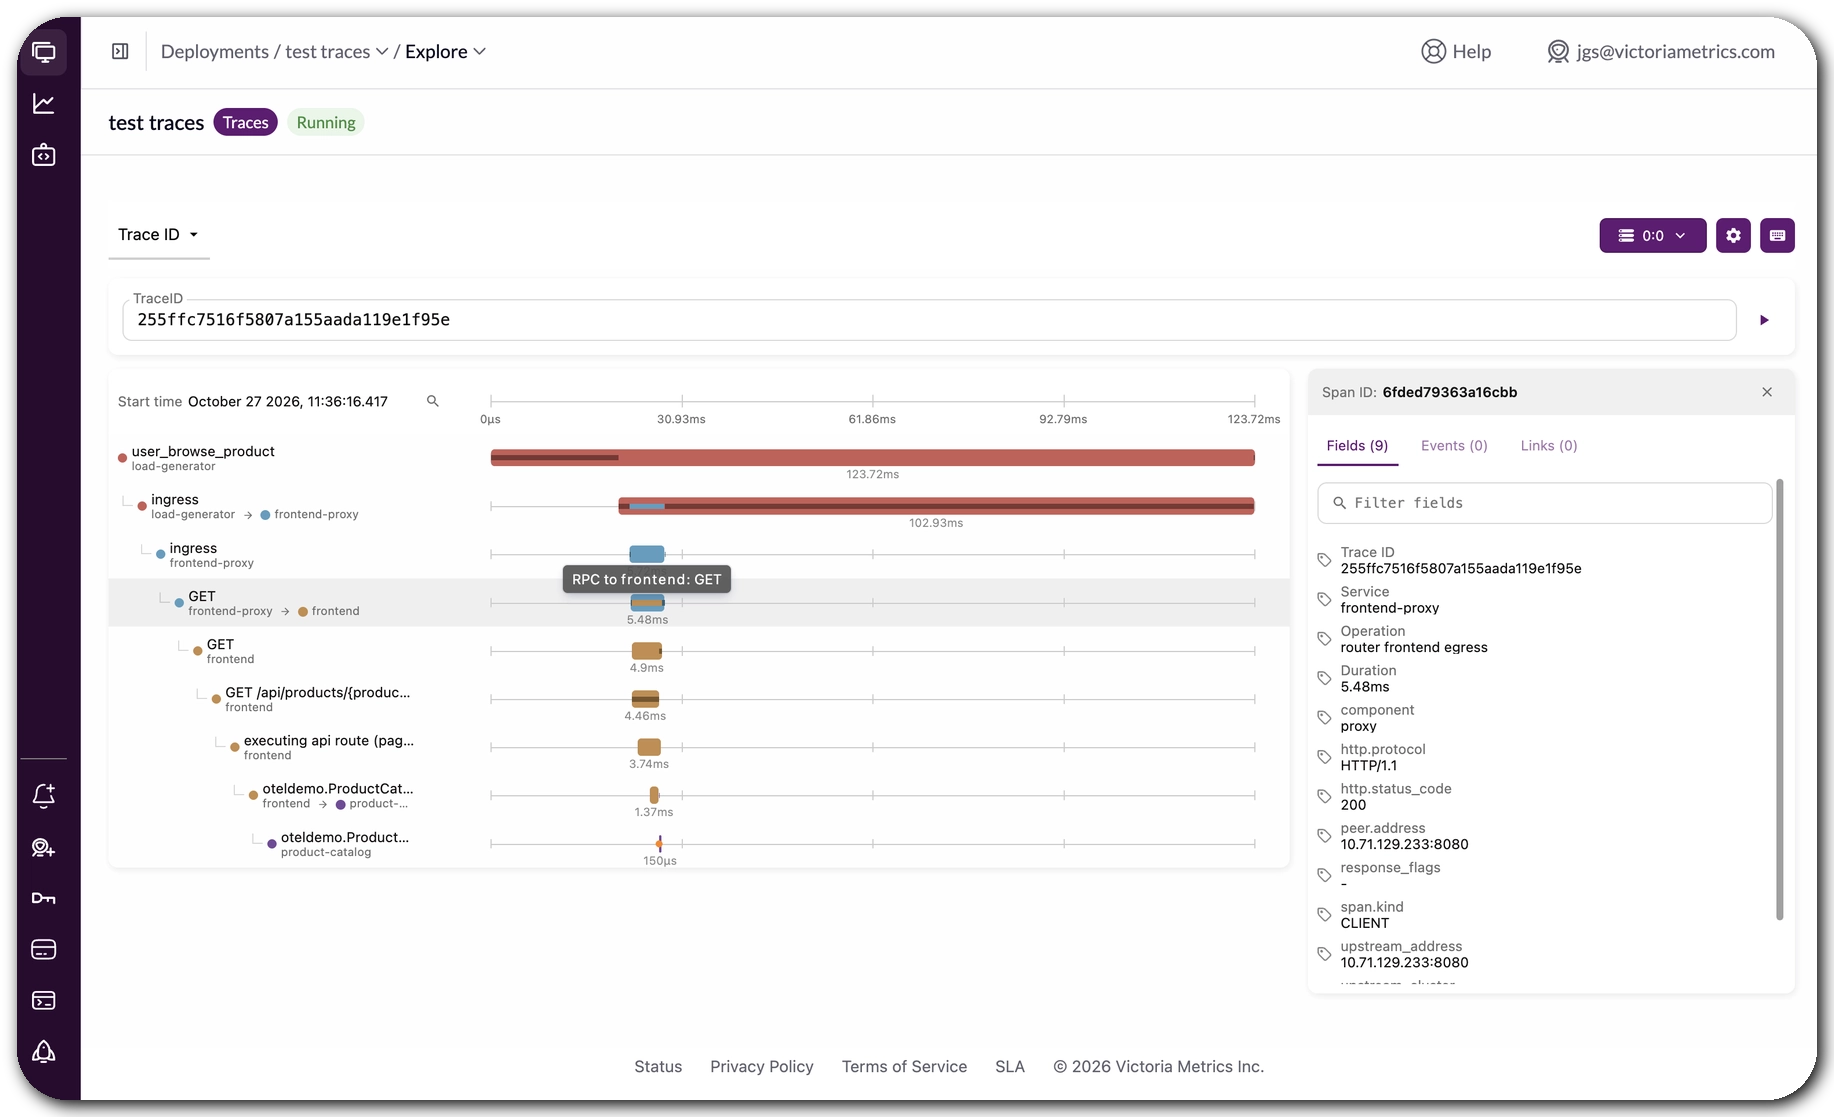
One of our favorite features is the Trace preview. Selecting a trace shows how its duration
compares to the rest of the traces for the same operation on a color-coded heatmap, so it is immediately clear where it sits.
It also shows the Critical Span, the Errors and all the Attributes, without leaving the list.
For deeper investigations, the Trace View shows the span timeline, the
critical span, Events (even if they are deprecated in OpenTelemetry, and we won’t open that Pandora’s box
today) and Links.
Sending Traces
#
As in every VictoriaMetrics Cloud deployment, Integrations are one click away. VictoriaTraces is
compatible with the OpenTelemetry Collector, and even faster with vtagent,
and data can be visualized in Grafana or Perses too (and soon without leaving VictoriaMetrics Cloud!).
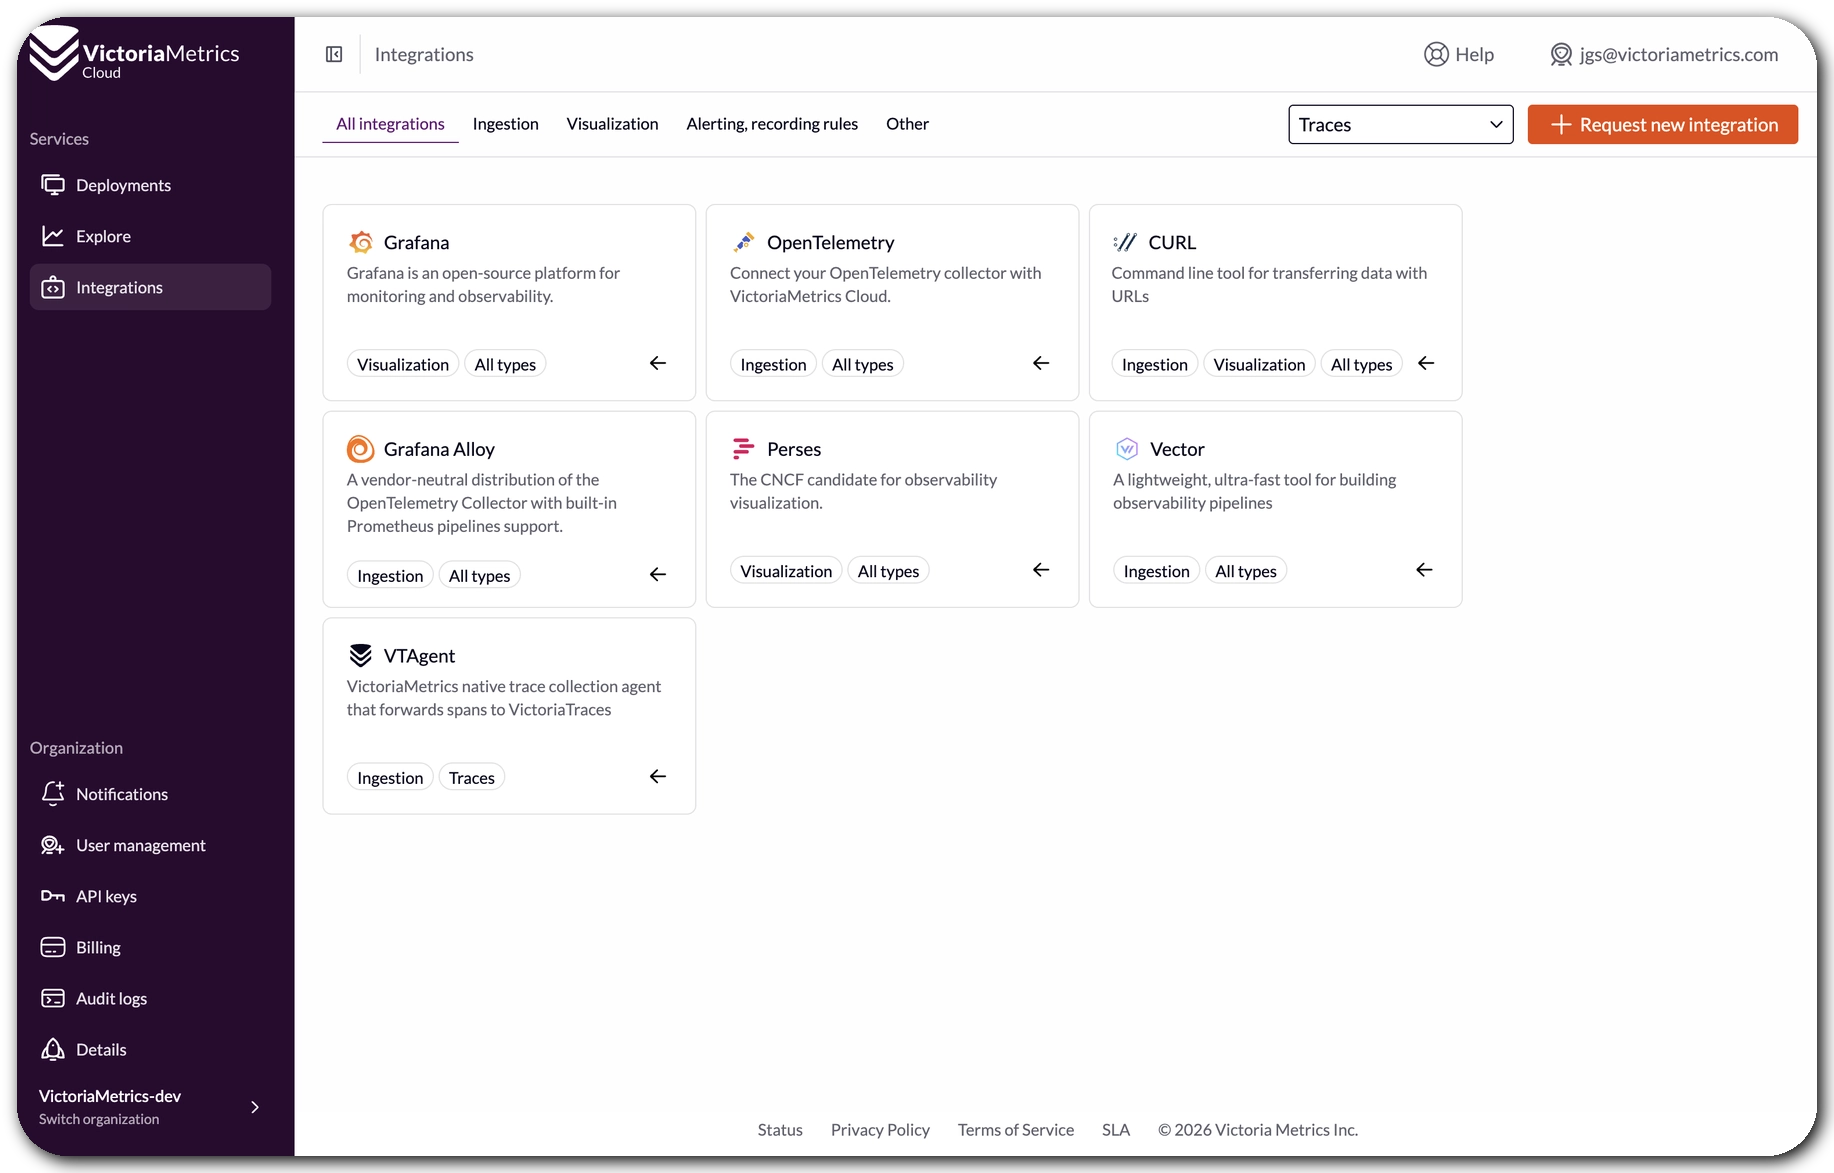
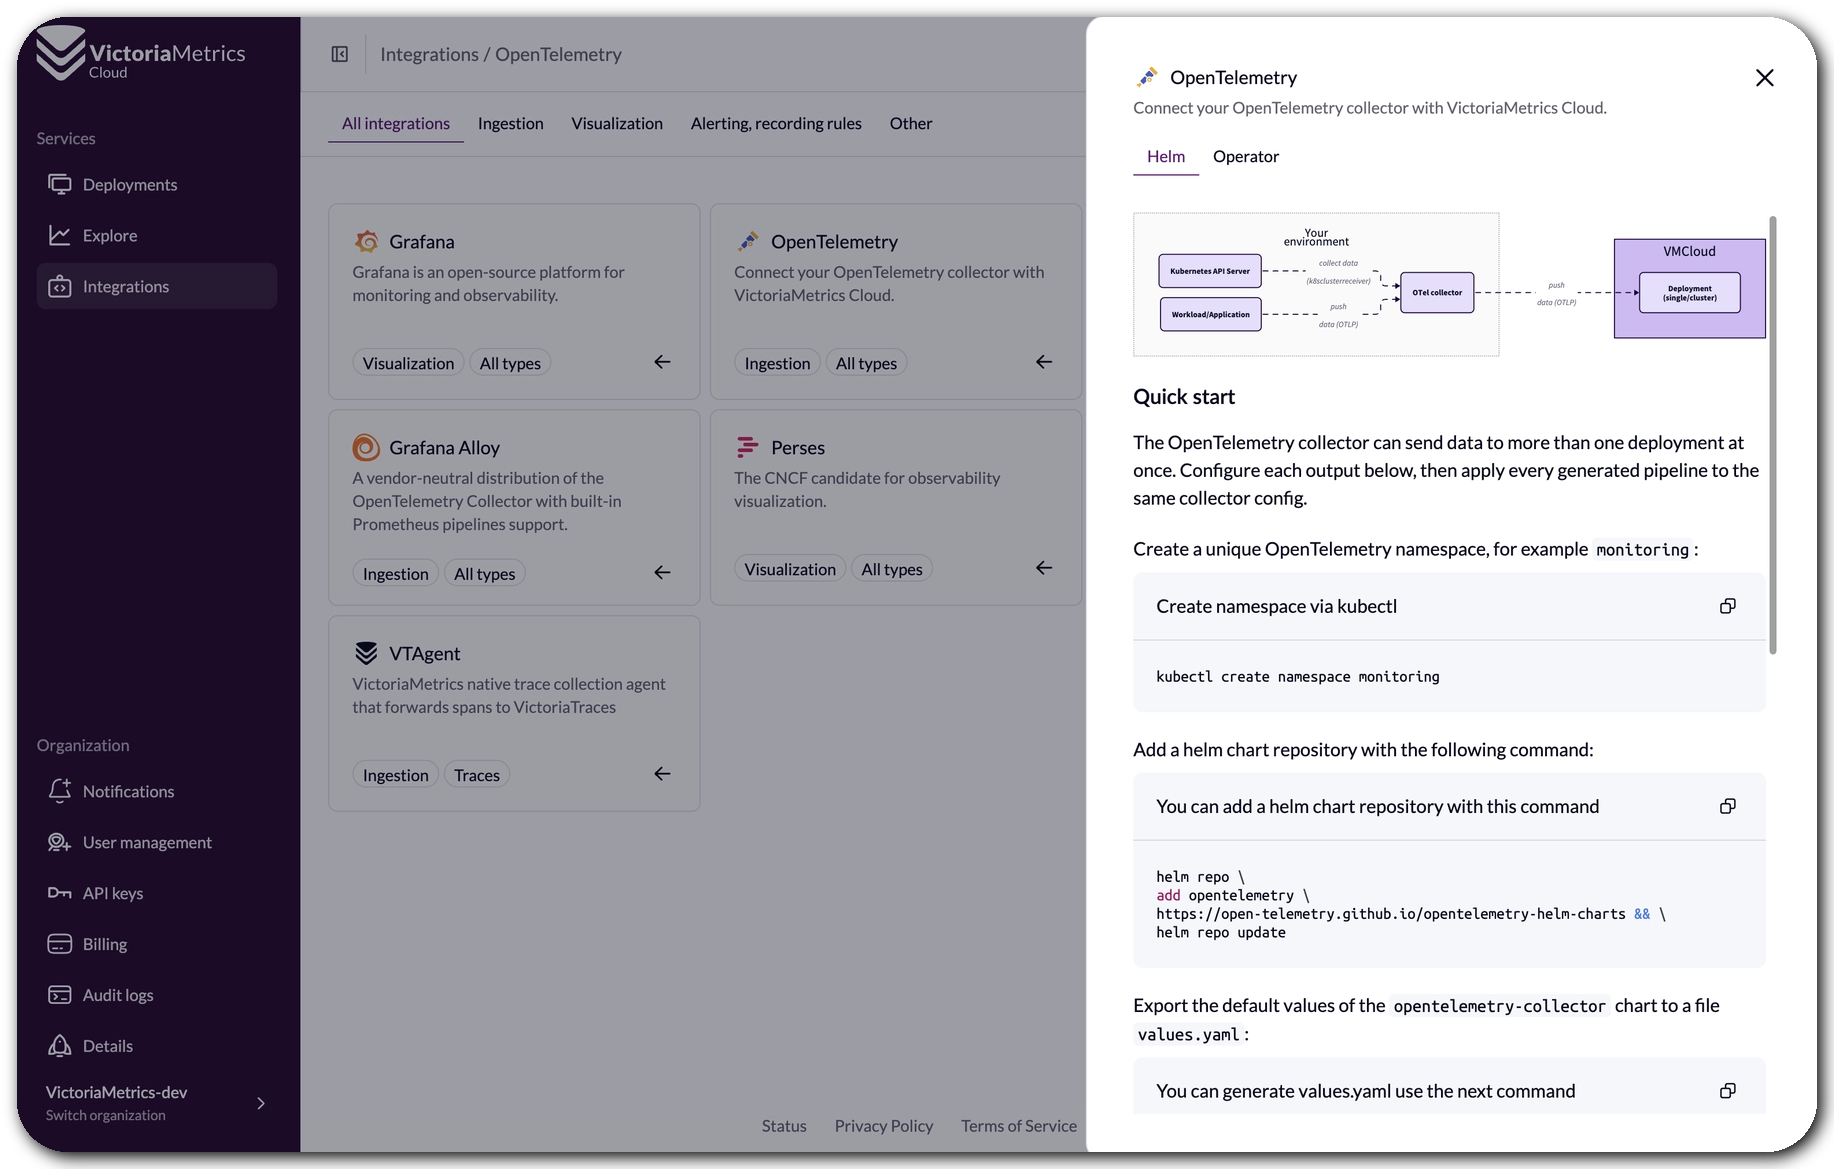
Each guide is interactive and paste-ready. Users wanting to integrate OpenTelemetry without reading documentation (or, let’s be honest, spending tokens on it) can come here, copy the snippets and get started easily.
Choosing a Tier
#
VictoriaTraces in VictoriaMetrics Cloud is based on the open source project, and its single-node instances are already multitenant, so there’s no need for clusters to get started. As usual, tiers are based on compute units: users pick as many resources as needed and are billed for them.
One of the benefits of this system is that spikes in ingestion or reading are not charged.
Of course, deployments can be scaled up and down at any time, backups and support are included, and storage can grow as needed, so there is no need to commit to a lot of it from day one.
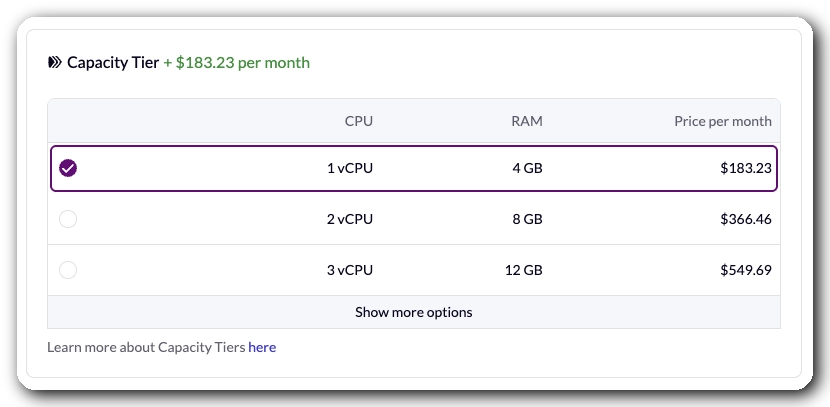
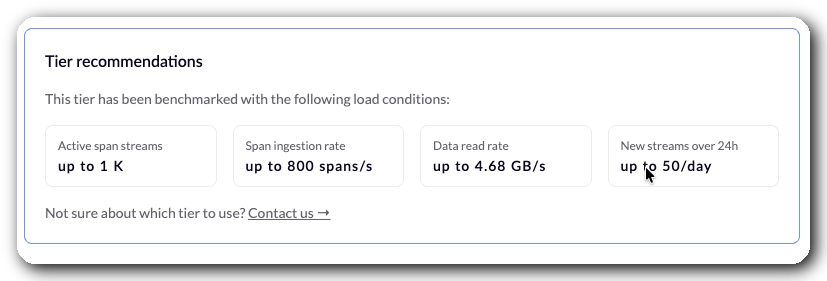
To help choosing a tier, we ran some benchmarks. And as every benchmark, take them with a grain of salt. Many benchmarks out there only measure writes. In ours, we did both reading and writing at the same time, and we’d actually say we leaned towards over-reading on purpose. This way we are not overselling anything: no promises about ingesting petabytes of spans per millisecond that crash as soon as somebody runs a query. Anyone may find the details and recommendations in the VictoriaTraces tiers documentation.
We will keep running these exercises but, for help deciding, just write to us and we will help pick one, or arrange a PoC for big volumes.
Ready to see traces in action? Sign up for VictoriaMetrics Cloud and try it with a one-month free trial, no credit card required.
Better Overview: Everything at a Glance
#
We have been talking about making our tiers more transparent for a while. We are showing components, metrics and resource usage, so it was time to improve the first thing users see when opening a deployment page.
This is how the Overview page looks now:
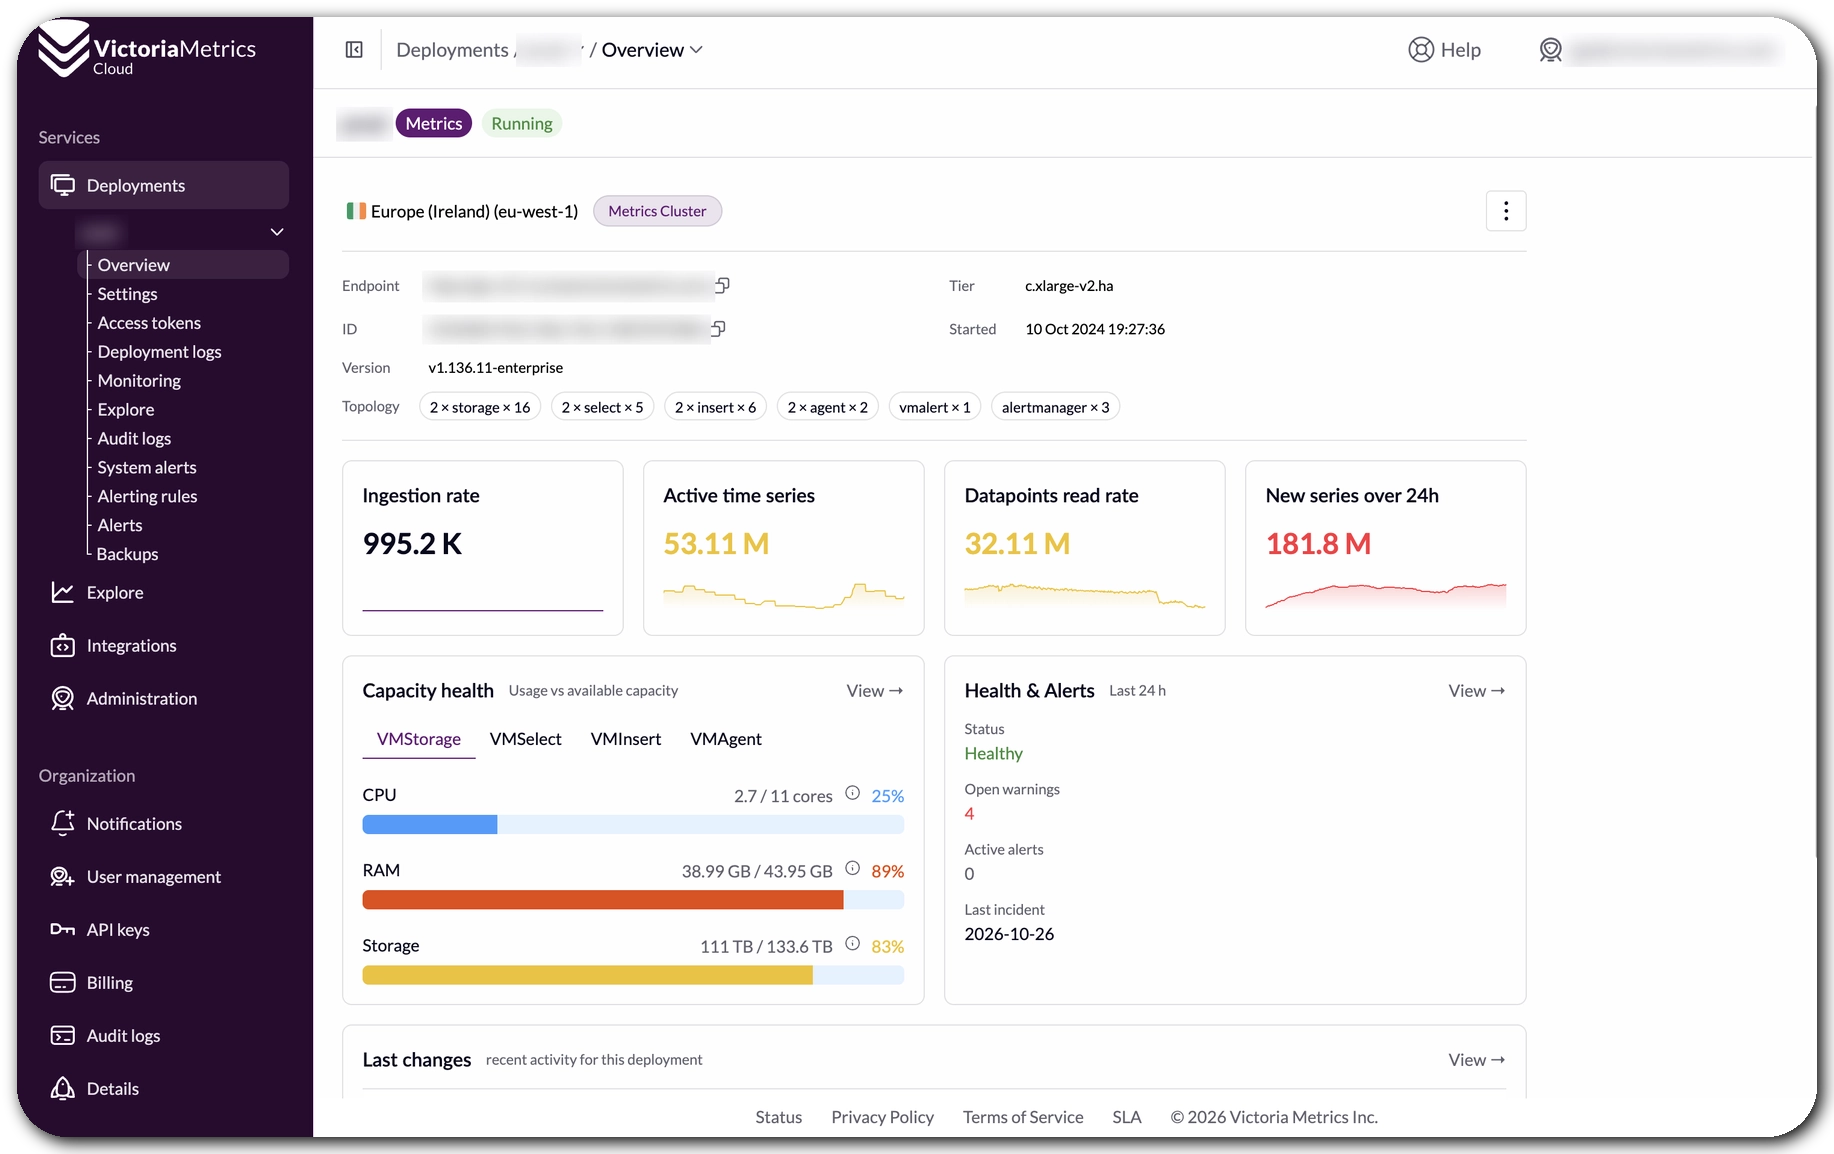
Now this page shows everything relevant for users at a glance:
- Basic info and topology: copy the endpoint to integrate faster, and check the topology that has
been deployed. This is especially relevant for
Clusterdeployments, where every component and its replicas can be seen. - Real time KPIs: for VictoriaMetrics instances, for example, that means ingestion rate, active time series, read rate and new series over 24 hours.
- Resource consumption: as our tiers are based on compute units, CPU, RAM and storage can be checked
per component. If
vmstorageis almost out of RAM, users can open a support ticket and we will help, or scale the tier on their own. - Health and alerts, with links to navigate to relevant pages.
- Last changes: showing latest events from
Audit logs, such as new deployments or access tokens created.
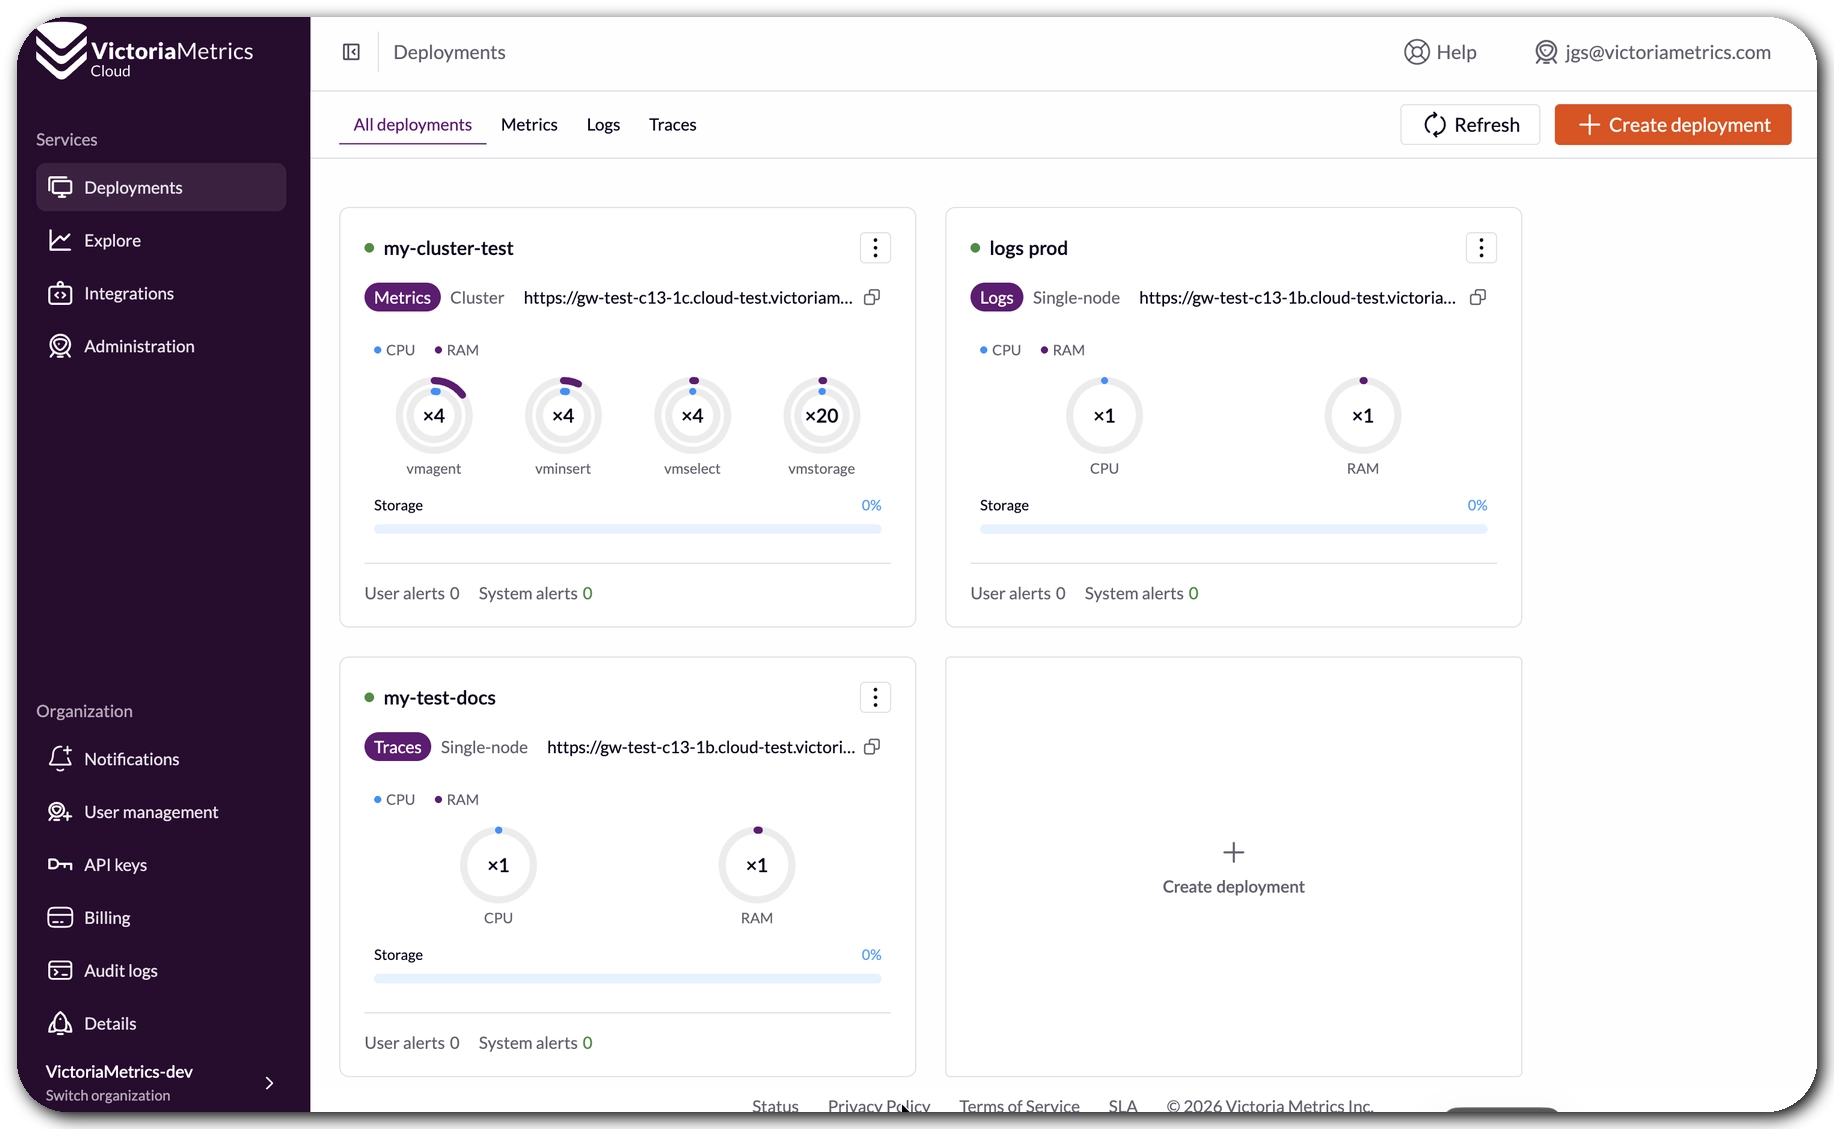
We also renewed the Deployments page, so the whole fleet may be managed in a few clicks. Many users have different VictoriaMetrics instances, for staging and production, together with VictoriaLogs and VictoriaTraces deployments. Now all of them can be seen in one page, with the relevant information and links of each one available at a glance.
Better Monitoring: Do It Like the Pros
#
The other feature we’re very proud of is the new Monitoring page, that we advanced in the
Q2 update.
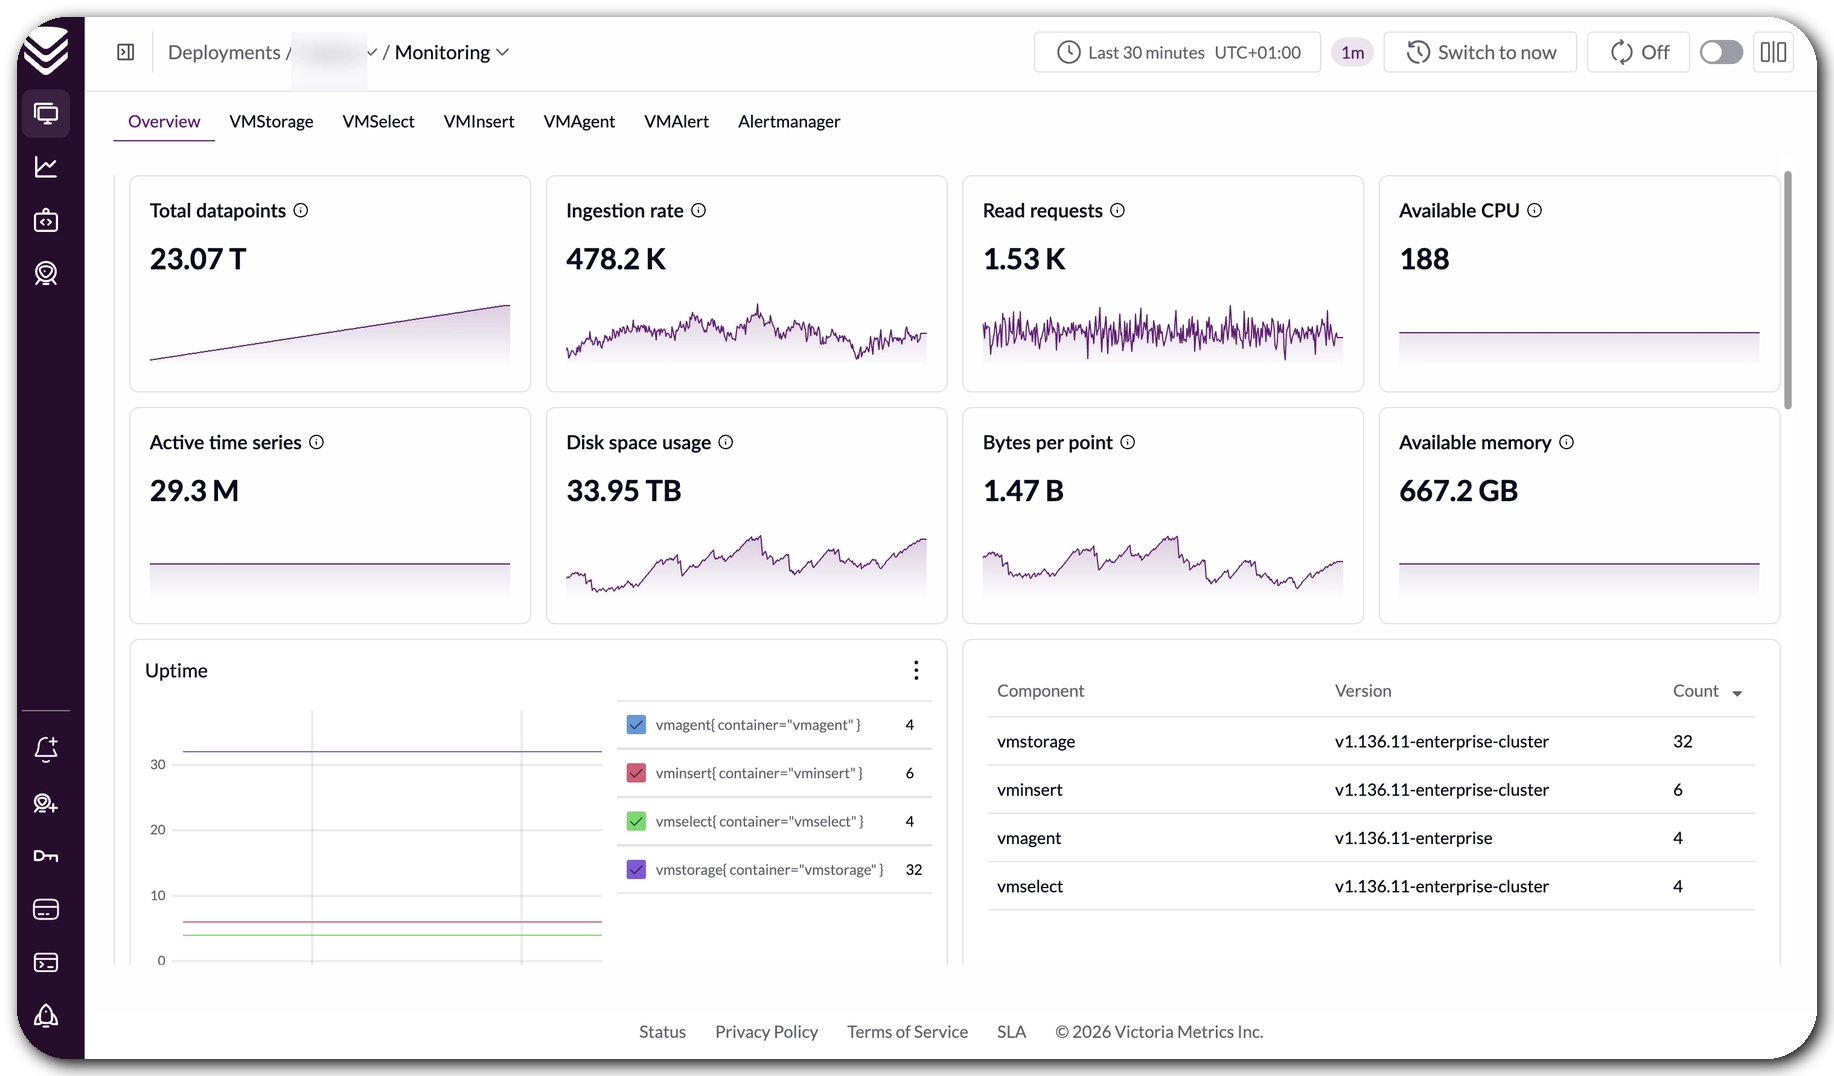
It natively shows the same information we use ourselves when we investigate issues or want to know
how an instance is performing. Those who have followed our monitoring guidelines will
recognize these visualizations from the public Grafana dashboards. Now they are included in VictoriaMetrics Cloud… Natively!
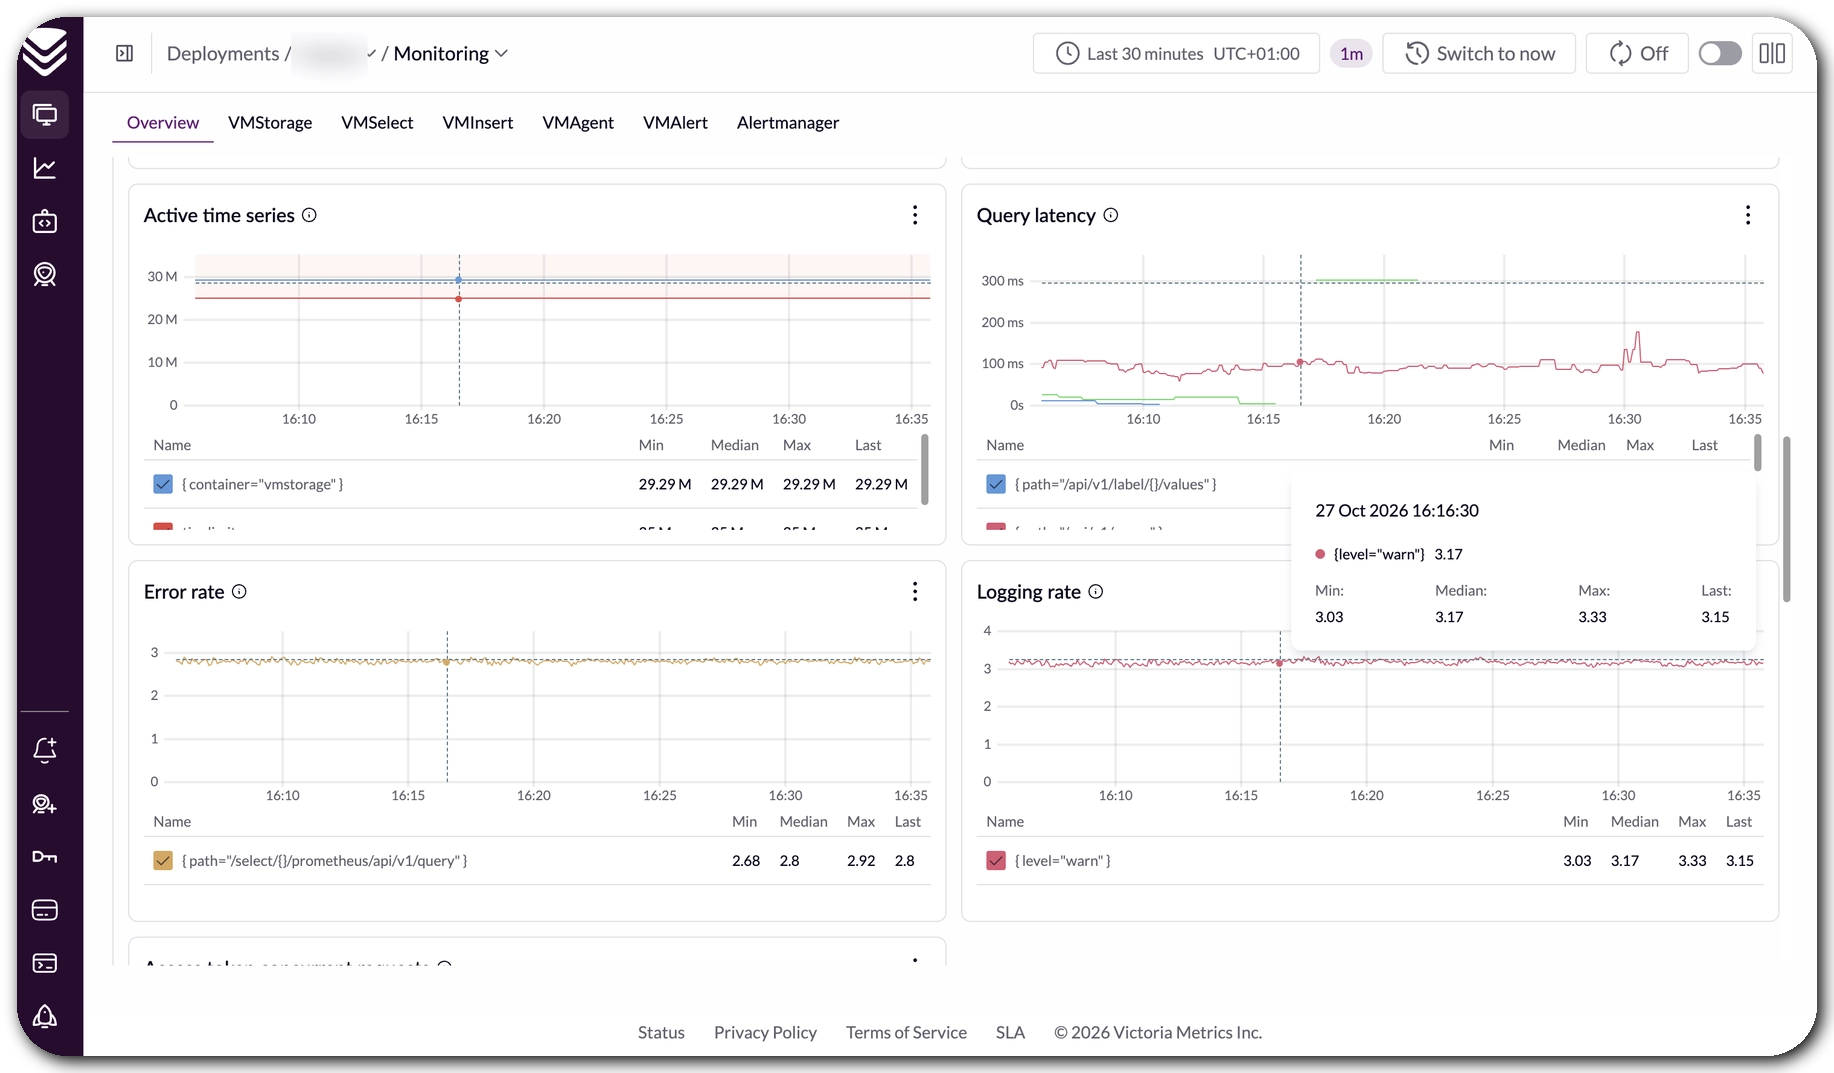
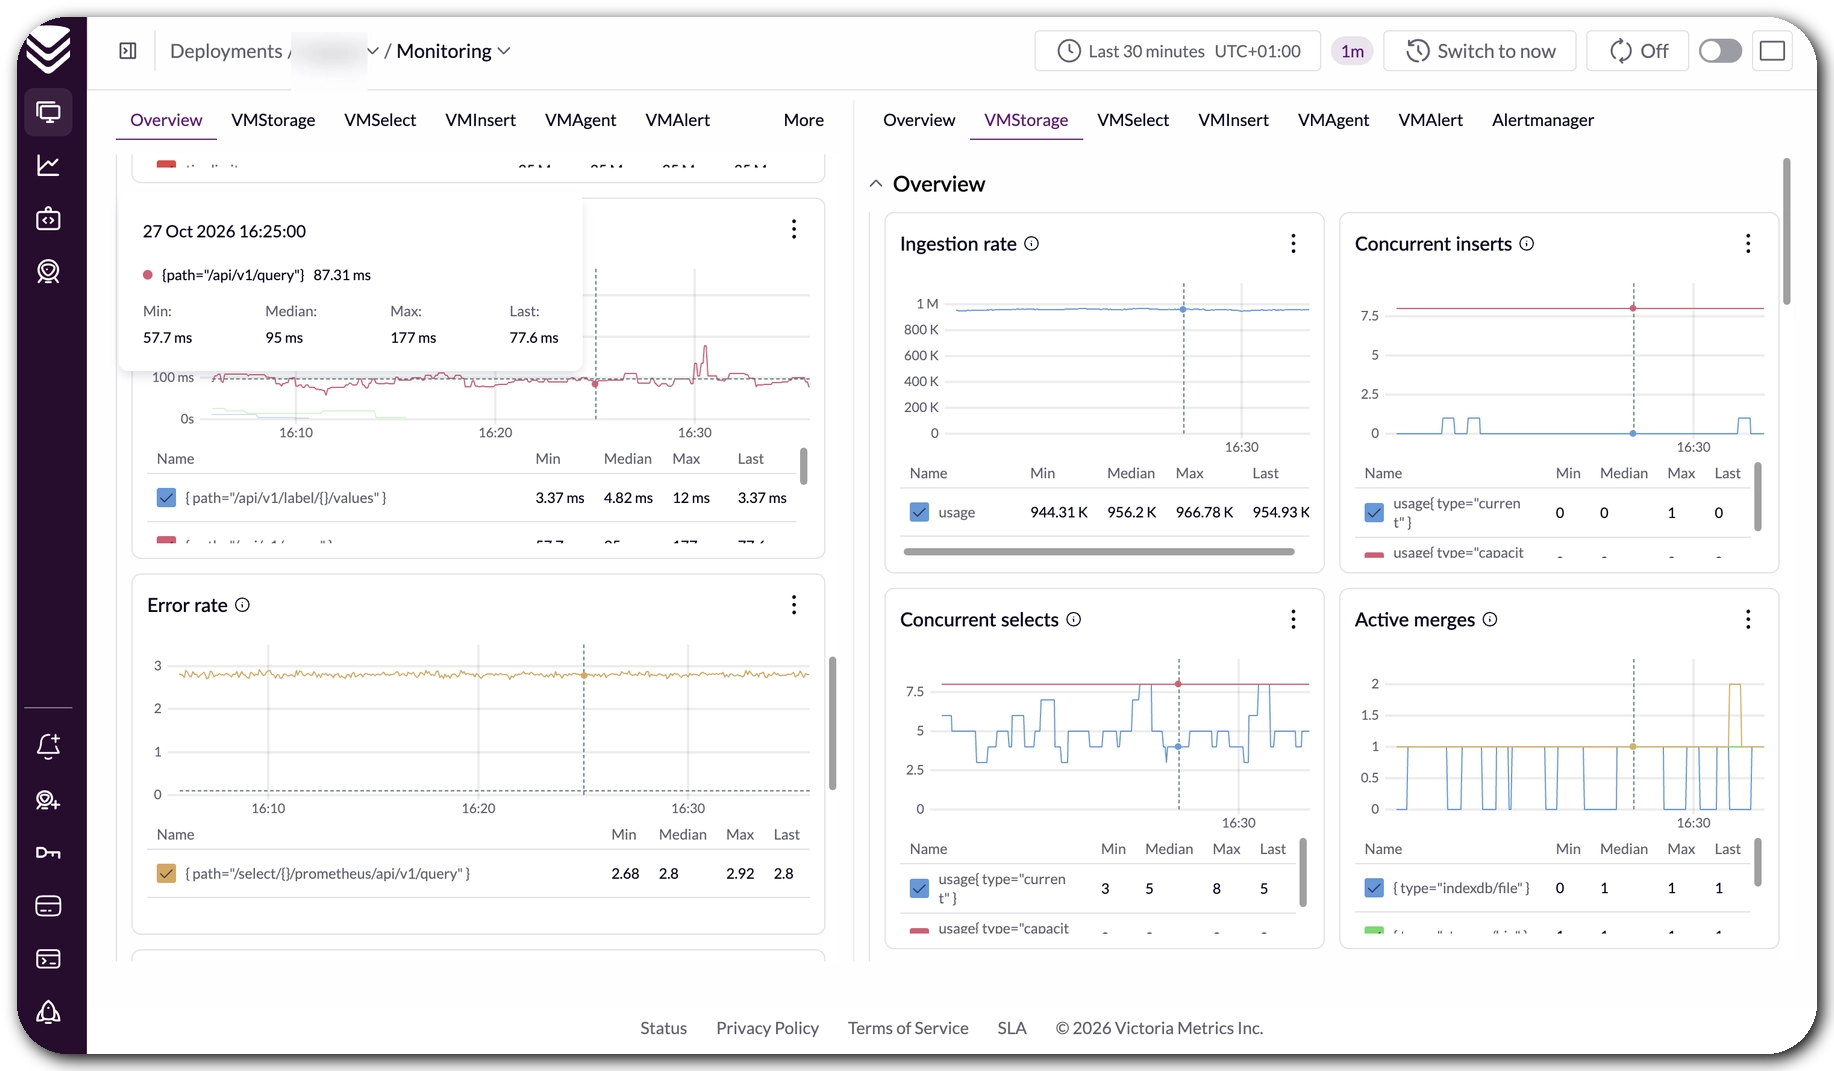
We learned that sharing this with everybody is better:
- Transparent tiers: it is easier to understand why a tier fits (or doesn’t) a given workload, and scaling and usage become more evident.
- Per-component breakdown: available to check each component of a deployment on its own tab.
- All data available: all the relevant metrics are there to explore.
And one more cool feature: the screen can be split, so one side can scroll while the other stays in place for comparing. This is perfect for correlating events that produced errors, for example, looking at two components side by side.
Alerting for Logs and Traces
#
People were asking a lot for this one: Recording and Alerting rules for VictoriaLogs and VictoriaTraces. As we were saying earlier, VictoriaMetrics Cloud users want everything to be managed in the Cloud, so this was a must.
Those already using alerting with metrics know how it works. A vmalert component is installed when creating
rules, either alerting or recording ones. It reads from the deployment, generates the results as new metrics,
and an optional notifier, based on Alertmanager, may be deployed to send alerts to Slack, email or any webhook.
Readers can learn more in the alerting setup docs.
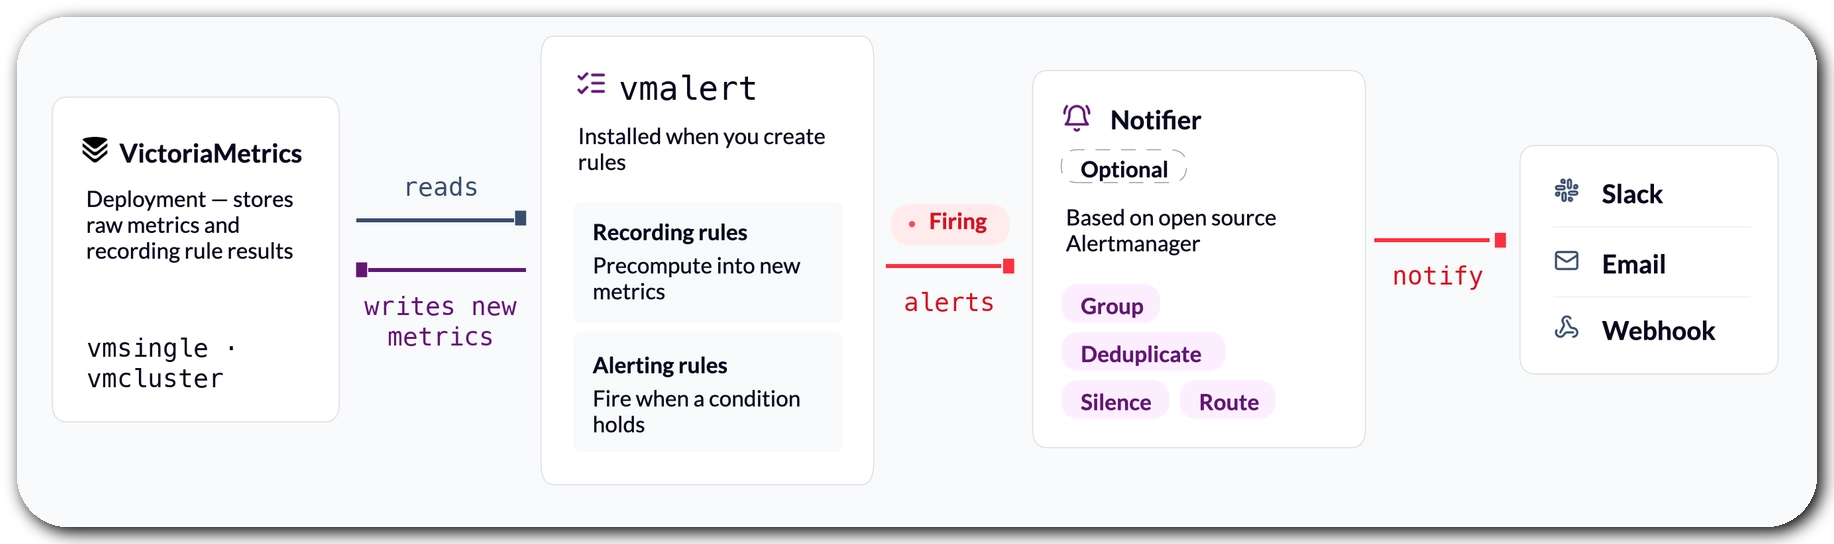
vmalert reads from the deployment, writes rule results back as new metrics and sends firing alerts to the optional notifierFor logs and traces it works in a very similar way, with one difference:
- Alerting rules work directly on the VictoriaLogs or VictoriaTraces deployments.
- To have recording rules, or alert states surviving
vmalertrestarts, a VictoriaMetrics instance is needed to store the results.
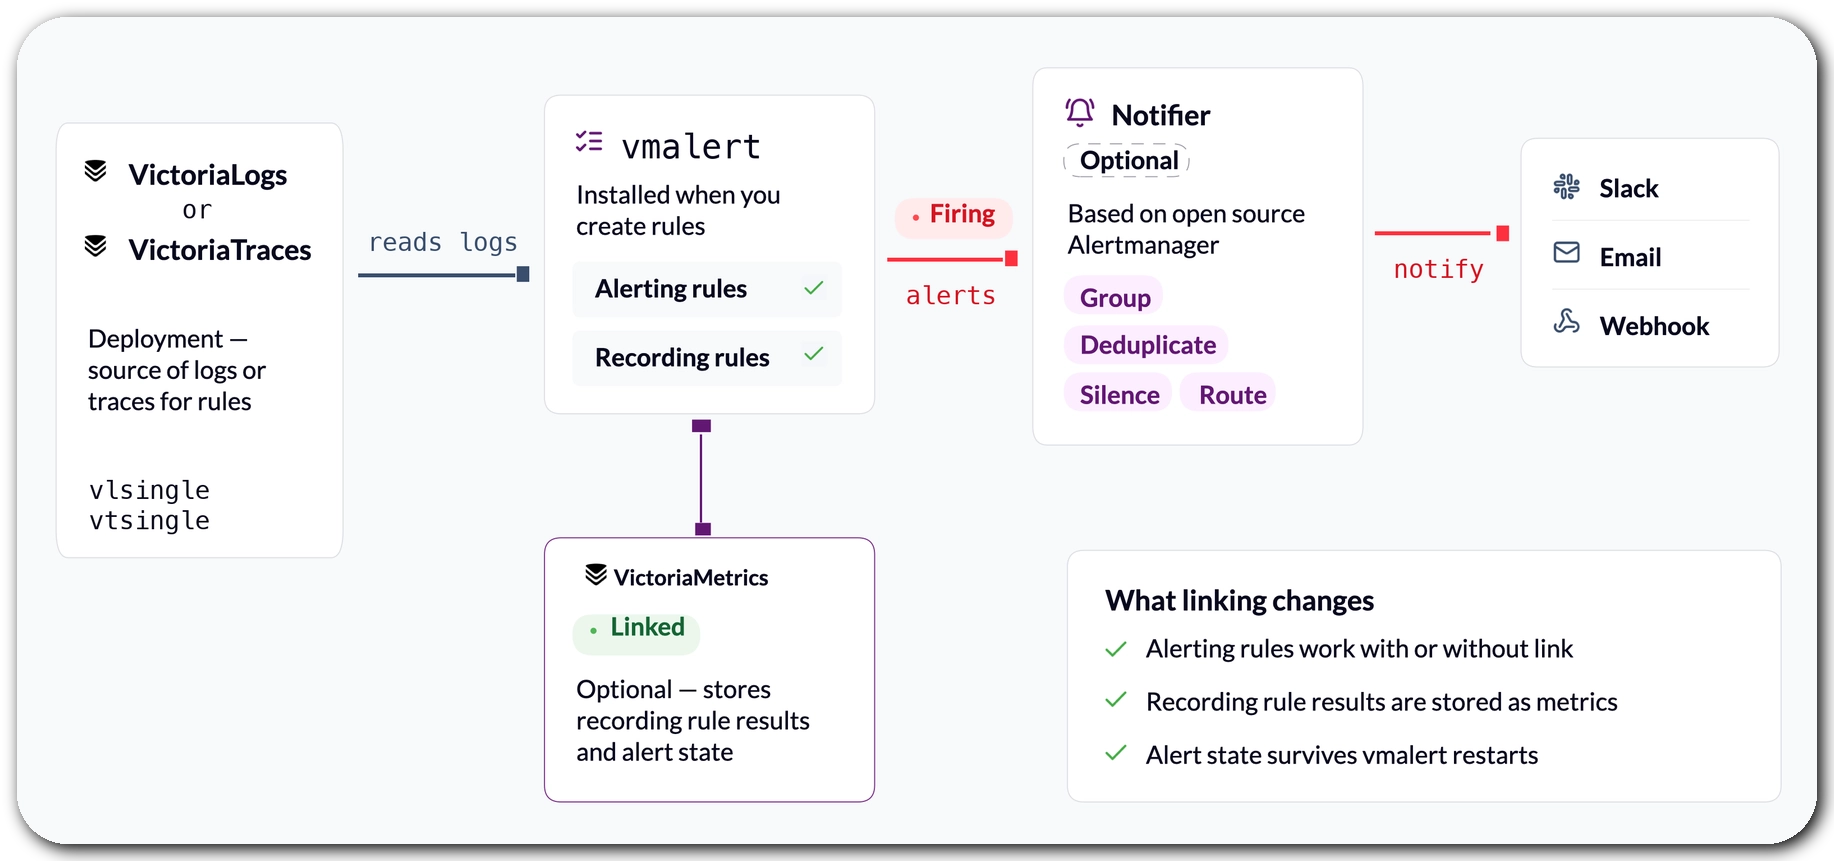
That is why the ability to link a metrics deployment to logs or traces deployments was added. It is just another optional component when configuring alerting. Both deployments need to sit in the same region.
This is a first step, and we have more planned for our whole alerting experience, so stay tuned!
Stream Aggregation for VictoriaMetrics Single
#
The last big feature of the quarter is another one that our customers were asking for a lot.
We talked about recording rules before: a vmalert that reads a lot of data and runs queries that
can be quite complex.
But those who know the key features of VictoriaMetrics may want to use another great feature instead: stream aggregation. The difference between both mechanisms relies on when the computation happens.
With recording rules, all the raw series are stored first and computed afterwards. With stream aggregation, samples are aggregated in memory on the fly, in a single pass, and then only the aggregates are written (and the raw input only when users choose to keep it).


It is now available for VictoriaMetrics Single instances in the Cloud. It can be configured under
Settings → Advanced settings → Stream aggregation (YAML). It is best for when:
- A recording rule is slow because it scans many raw series
- Users don’t need the raw series, only the aggregate
- High-cardinality labels or scrape frequency are inflating storage
Stream aggregation adds CPU and memory load, so a higher tier may be needed. When unsure, talk to us and we will help size it.
Other Updates, Improvements and Bug Fixes
#
As always, there are many smaller changes that came from user feedback:
- API and Terraform support for VictoriaLogs and VictoriaTraces. The whole stack can be managed as code, learn more in the API and Terraform docs.
- Access tokens. Better handling of tokens, with system-managed ones instead of random ones.
- Logs live tailing is now available in the console UI. We know our users (and founders!) love this feature. It comes with VLUI, but we needed to do some internal work to make it happen in VictoriaMetrics Cloud.
- Explore page added several UX improvements.
- Docs now include rule presets integrations with several other pages being improved, as usual.
What’s Next?
#
Clusters, Tiers and More
#
We are working on several features, some of which we have been mentioning in previous updates:
- New compute-based model: the clusters are ready and we are finalizing the implementation. The ladder of scaling will be much smoother, and the pricing and everything around it will be much better.
- Clusters for VictoriaLogs and VictoriaTraces: we will start working on them after releasing the new Metrics clusters. We had a very interesting conversation about this just this week, so expect news soon.
- SOC 2: the evaluation is still ongoing.
- S3 storage: as soon as it is ready in open source, we will work to make it happen in VictoriaMetrics Cloud.
- Generic OAuth: more flexibility to authenticate. Today users can log in with email and password or with Google, and we know that SSO is a big ask. This is definitely on the roadmap.
The Big Thing: project code-named Visum
#
We know: clusters, tiers, all of that is exciting. But for us, the biggest thing coming is this one.
We have metrics, we have logs, and now we have traces. So we have everything centralized in VictoriaMetrics Cloud. What else do we need? A super cool visualization tool.
Its project name is Visum and we will be launching a closed beta very soon (we are talking weeks, so it is coming soon).
It will be a single pane of glass for all observability data. Users will be able to:
- See services end to end and their dependencies
- Read RED metrics per service
- Drill down into all signals and correlate them, thanks to a new concept: connection groups
- Run incident investigations across metrics, logs and traces in one place
- Keep findings in dashboards and notebooks
- Integrate it with favorite AI tooling and agents
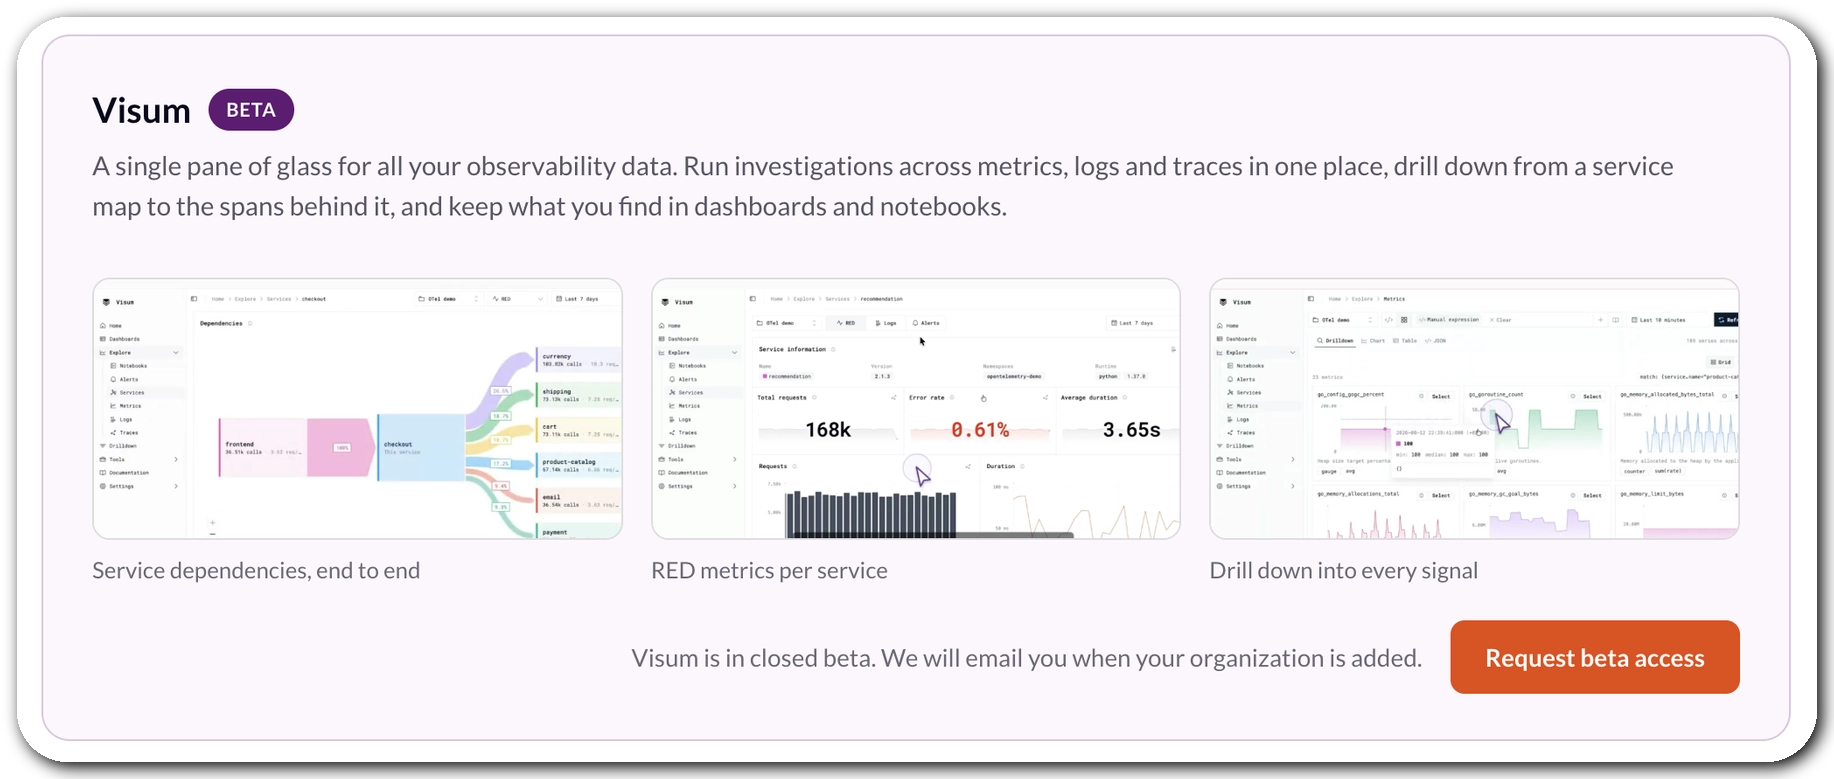
We would need hours to talk about everything the team is doing in this area, so stay tuned!
Those wanting to be among the first to try it will find a Request beta access button in the console. Click it and we will enable it as soon as it’s ready!
In a few words: VictoriaMetrics Cloud console is the control plane where users deploy and manage the
VictoriaStack, and Visum will be the new portal that accesses that data, so everything
will be found there.
See You in the Next One!
#
As always, thanks for being part of the VictoriaMetrics community. User feedback, bug reports, and feature requests are what keep us moving in the right direction.
Ready to try everything we shipped this quarter? Sign up for VictoriaMetrics Cloud and get the first month free, no credit card required!
Leave a comment below or Contact Us if you have any questions!
comments powered by Disqus
You might also like:
What's New in VictoriaMetrics Cloud Q2 2026? Transparent Credits, Navigation Improvements, and a New Path for Cluster Tiers
Q2 2026 brought transparent credits reporting for prepaid billing, many navigation improvements across the console, progress on SOC 2, and a first look at the compute-based model that will reshape how VictoriaMetrics Cluster is sized and priced.
What's New in VictoriaMetrics Cloud Q1 2026? Logs, MCP Server, Better Alerting, and... a Secret Project
Q1 2026 brought VictoriaLogs GA, a hosted MCP Server, a brand new cost calculator, a major expansion of alerting rule presets with a new editor, infrastructure improvements, notifications via generic webhooks and a few things we are cooking.
VictoriaLogs in VictoriaMetrics Cloud: Fast, Cost-Effective Log Management is Here
Announcing VictoriaLogs in VictoriaMetrics Cloud: fast, cost-effective log management with native OpenTelemetry support, LogsQL for powerful analysis, and integrations with Grafana and Perses for complete observability monitoring, is the best option to save costs when compared to other alternatives like ElasticSearch or Datadog.