- Blog /
- What's New in VictoriaMetrics Cloud Q2 2026? Transparent Credits, Navigation Improvements, and a New Path for Cluster Tiers
What's New in VictoriaMetrics Cloud Q2 2026? Transparent Credits, Navigation Improvements, and a New Path for Cluster Tiers
Share:


This quarter we’ve been busy investing a lot of effort into improving how users understand and control what they pay for VictoriaMetrics Cloud, and how to move around the console while doing it, with major UX improvements across different sections and functionalities. The big piece of work is transparent credits reporting, giving prepaid customers full visibility into balance, consumption, and expiration. Alongside that, we shipped navigation improvements, with a new collapsible sidebar functionality, a first step into the mobile experience, and homogenization in several parts of the console. We also have some quieter but important updates: SOC 2 work is done and awaiting evaluation and our secret project is going beta very soon (this is not to just make a free cliffhanger, but to let you know that we’re working hard behind the scenes).
As usual, if you missed our Quarterly Live Update, you can watch the full recording here:
Let’s go!
Credits: Full Visibility Into Your Balance
#
If you run VictoriaMetrics Cloud under a yearly contract, or you’ve received credits from a trial (or unfortunately an SLA compensation), you now have a dedicated Credits section sitting alongside our existing Stripe and AWS Marketplace options. It brings the same prepaid budget model that procurement-heavy teams already expect, but with the transparency we think it deserves.
As previously mentioned, credits can come from a few places: a negotiated yearly contract, a trial, or as compensation for an SLA breach. If you want a yearly commitment with prepaid credits, talk to us and our sales team will get it set up.
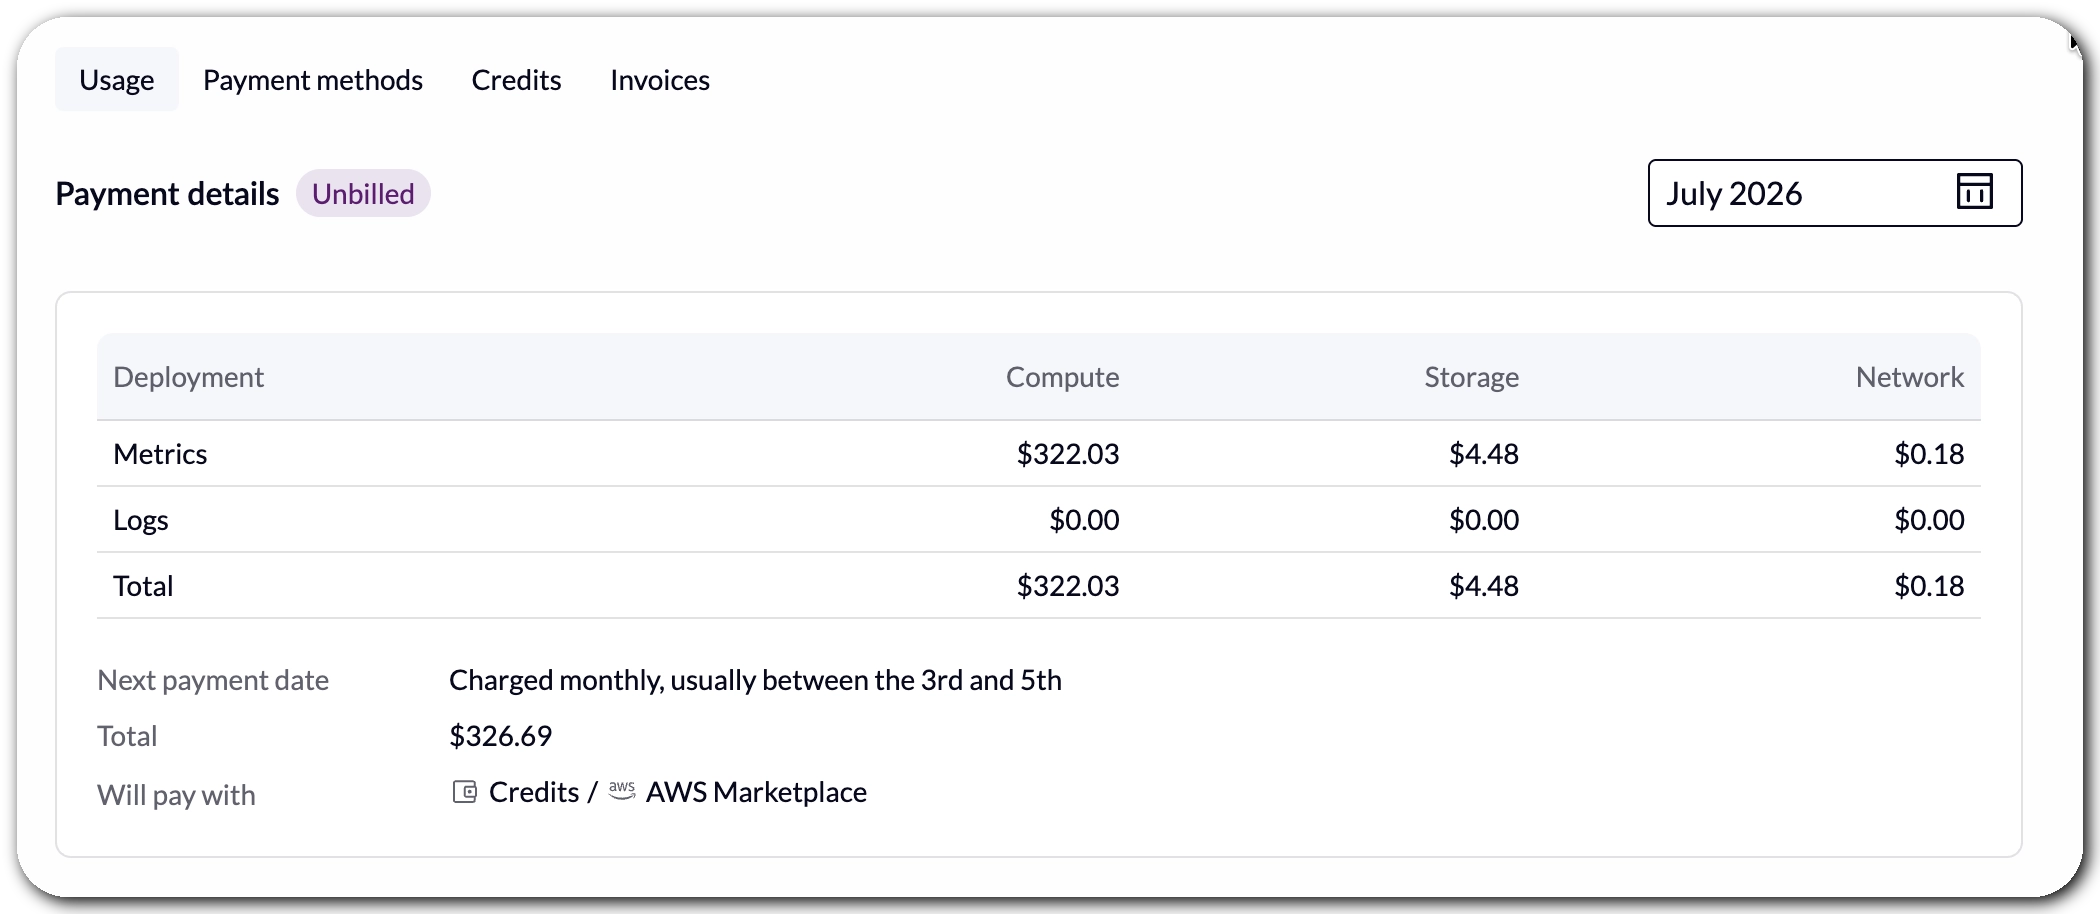
Once credits are active on your organization, charges are deducted from them first. Only once credits are depleted or unavailable does billing fall back to your selected payment method, whether that’s a bank card or AWS Marketplace. You can always check which method is currently being used to cover your usage from the Billing Usage page.
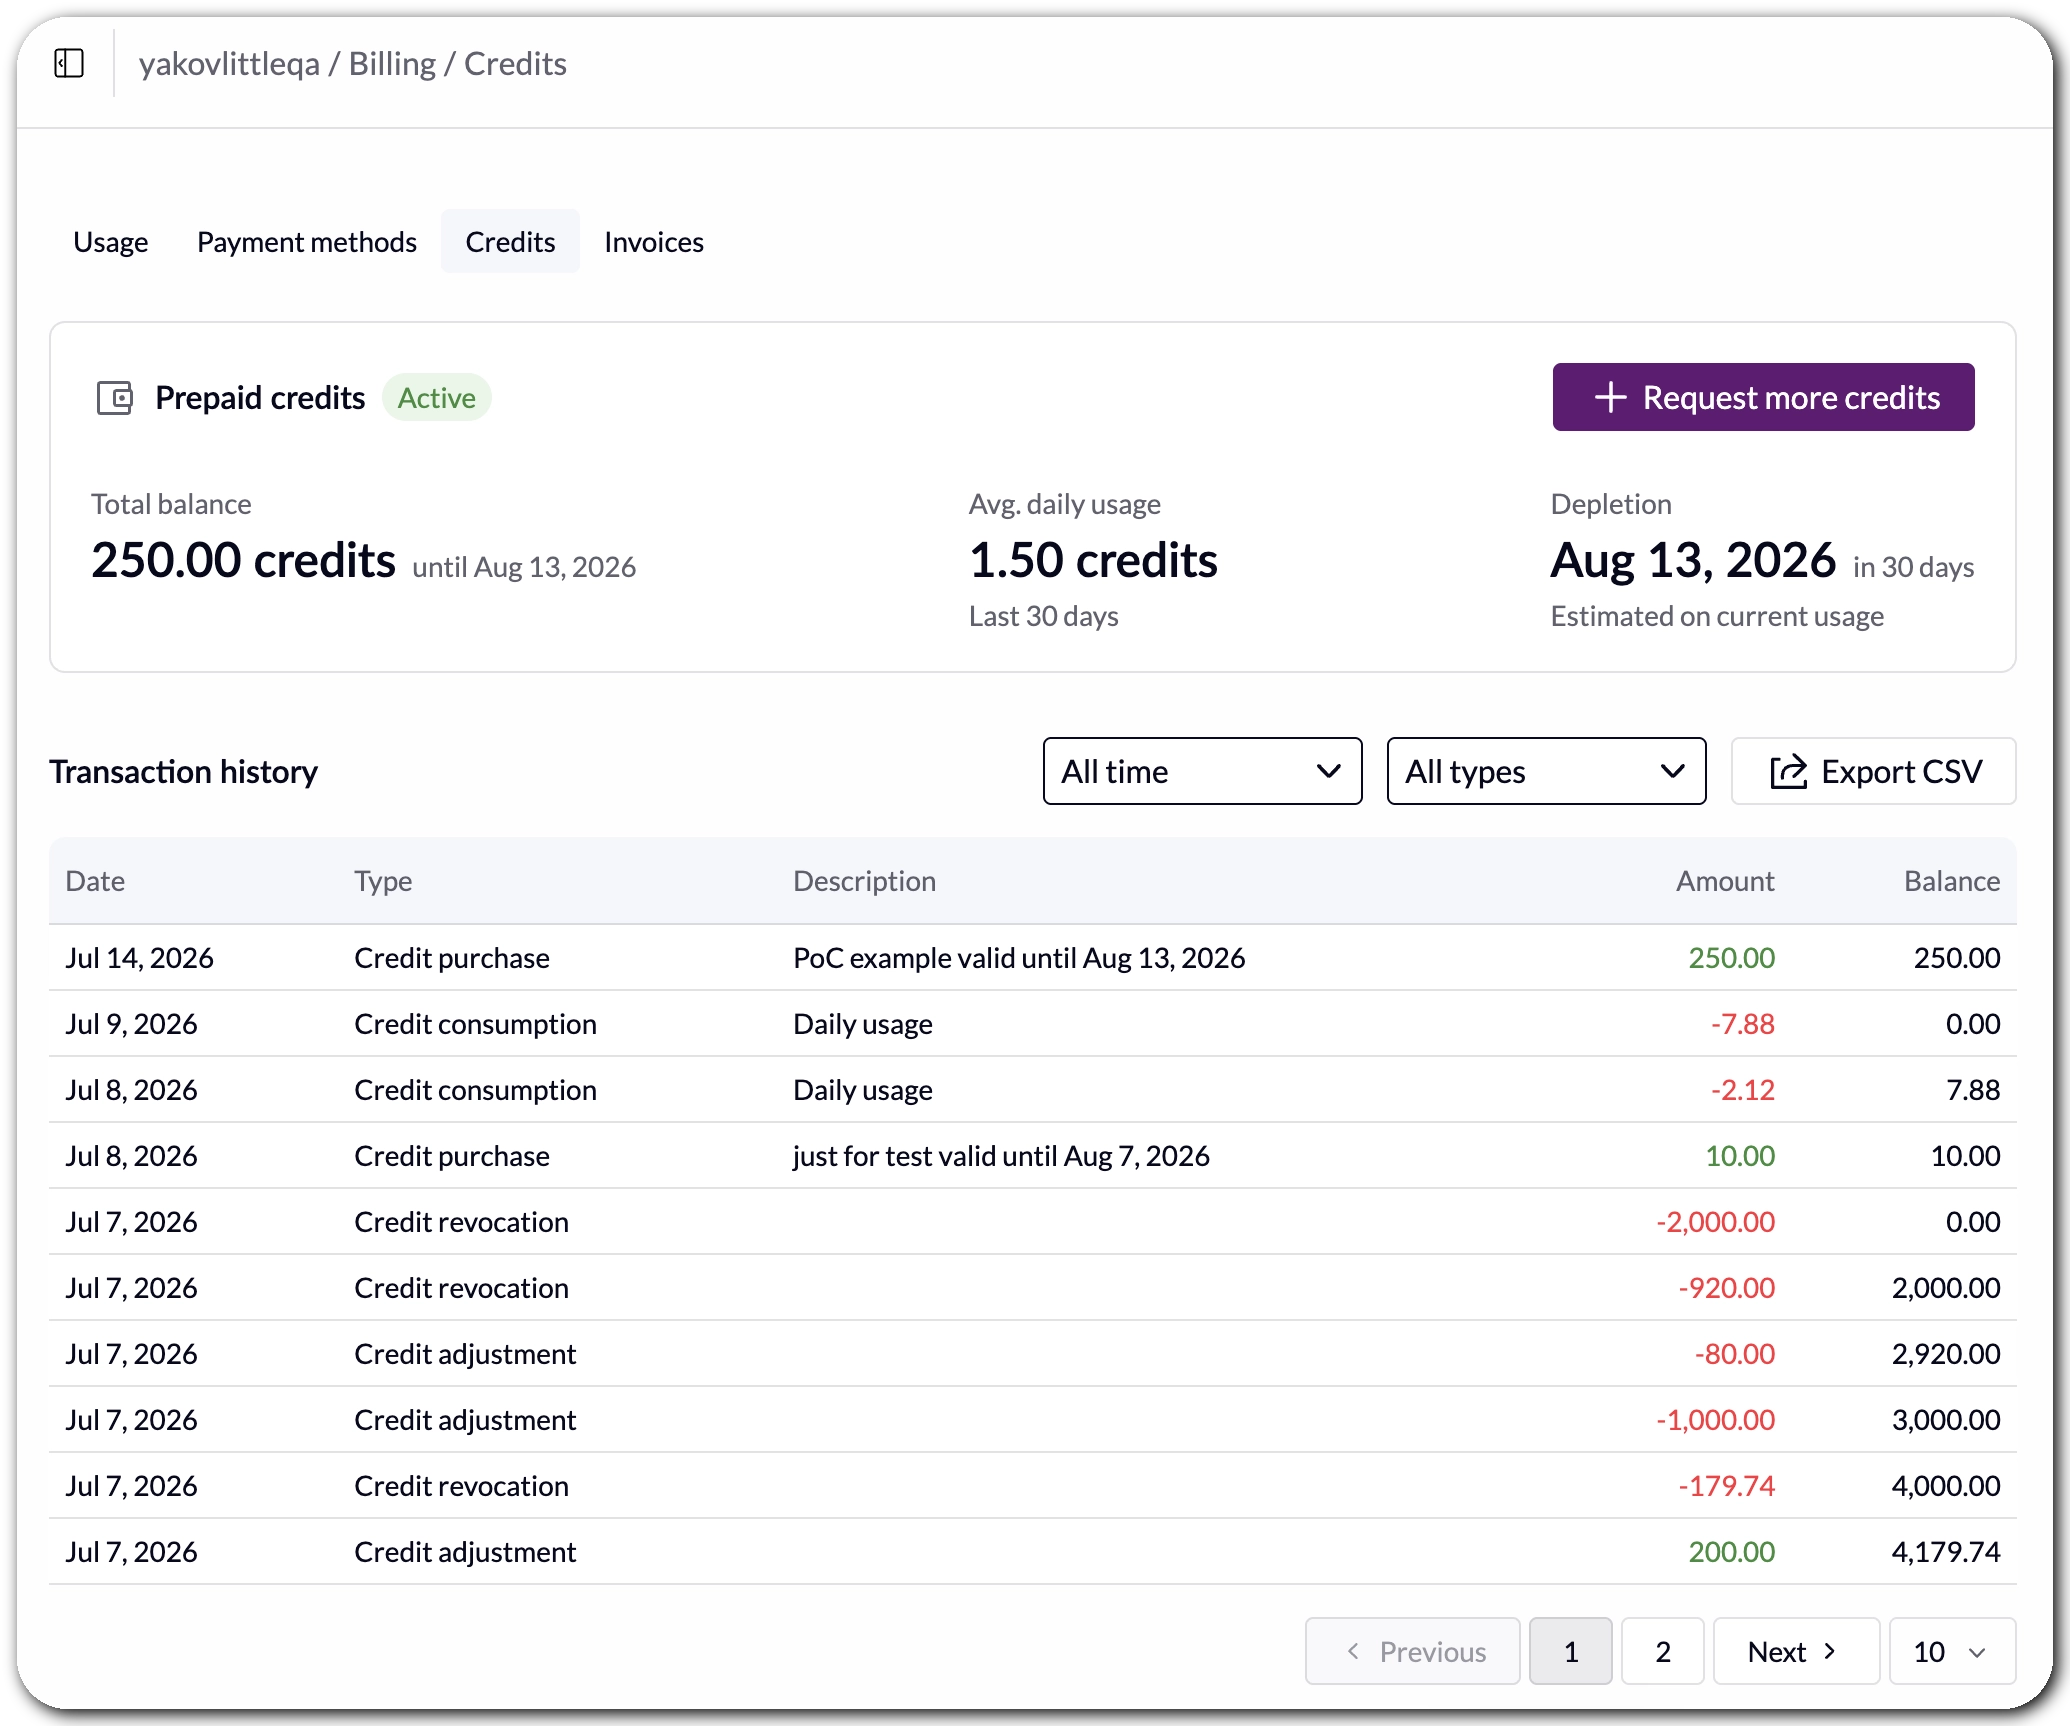
The new Credits page under Billing gives you:
- Your current balance, and how much has been consumed
- Average daily usage across the last 30 days
- A forecasted run-out date, based on that average, so you know when to expect a top-up conversation
- Expiration dates broken down per credit package, since different packages can expire at different times, for example, “X credits will expire in N days, Y credits will expire in M days, Z credits have no expiration date”
- A full export as CSV, if you want to bring the numbers into your own reporting
Every credit added or subtracted is also logged as an event, so you have a clear audit trail of purchases, consumption, revocations, and manual adjustments, useful if finance or support ever need to dig into a specific change.
Proactive notifications
As forecasted run-out date approaches, users get notified.
And if credits run out entirely, nothing dramatic happens by surprise: your organization follows the exact same grace period, warnings, and suspension logic we already apply to accounts without a payment method on file, with clearer messaging in the console pointing you to add a payment method or request more credits.
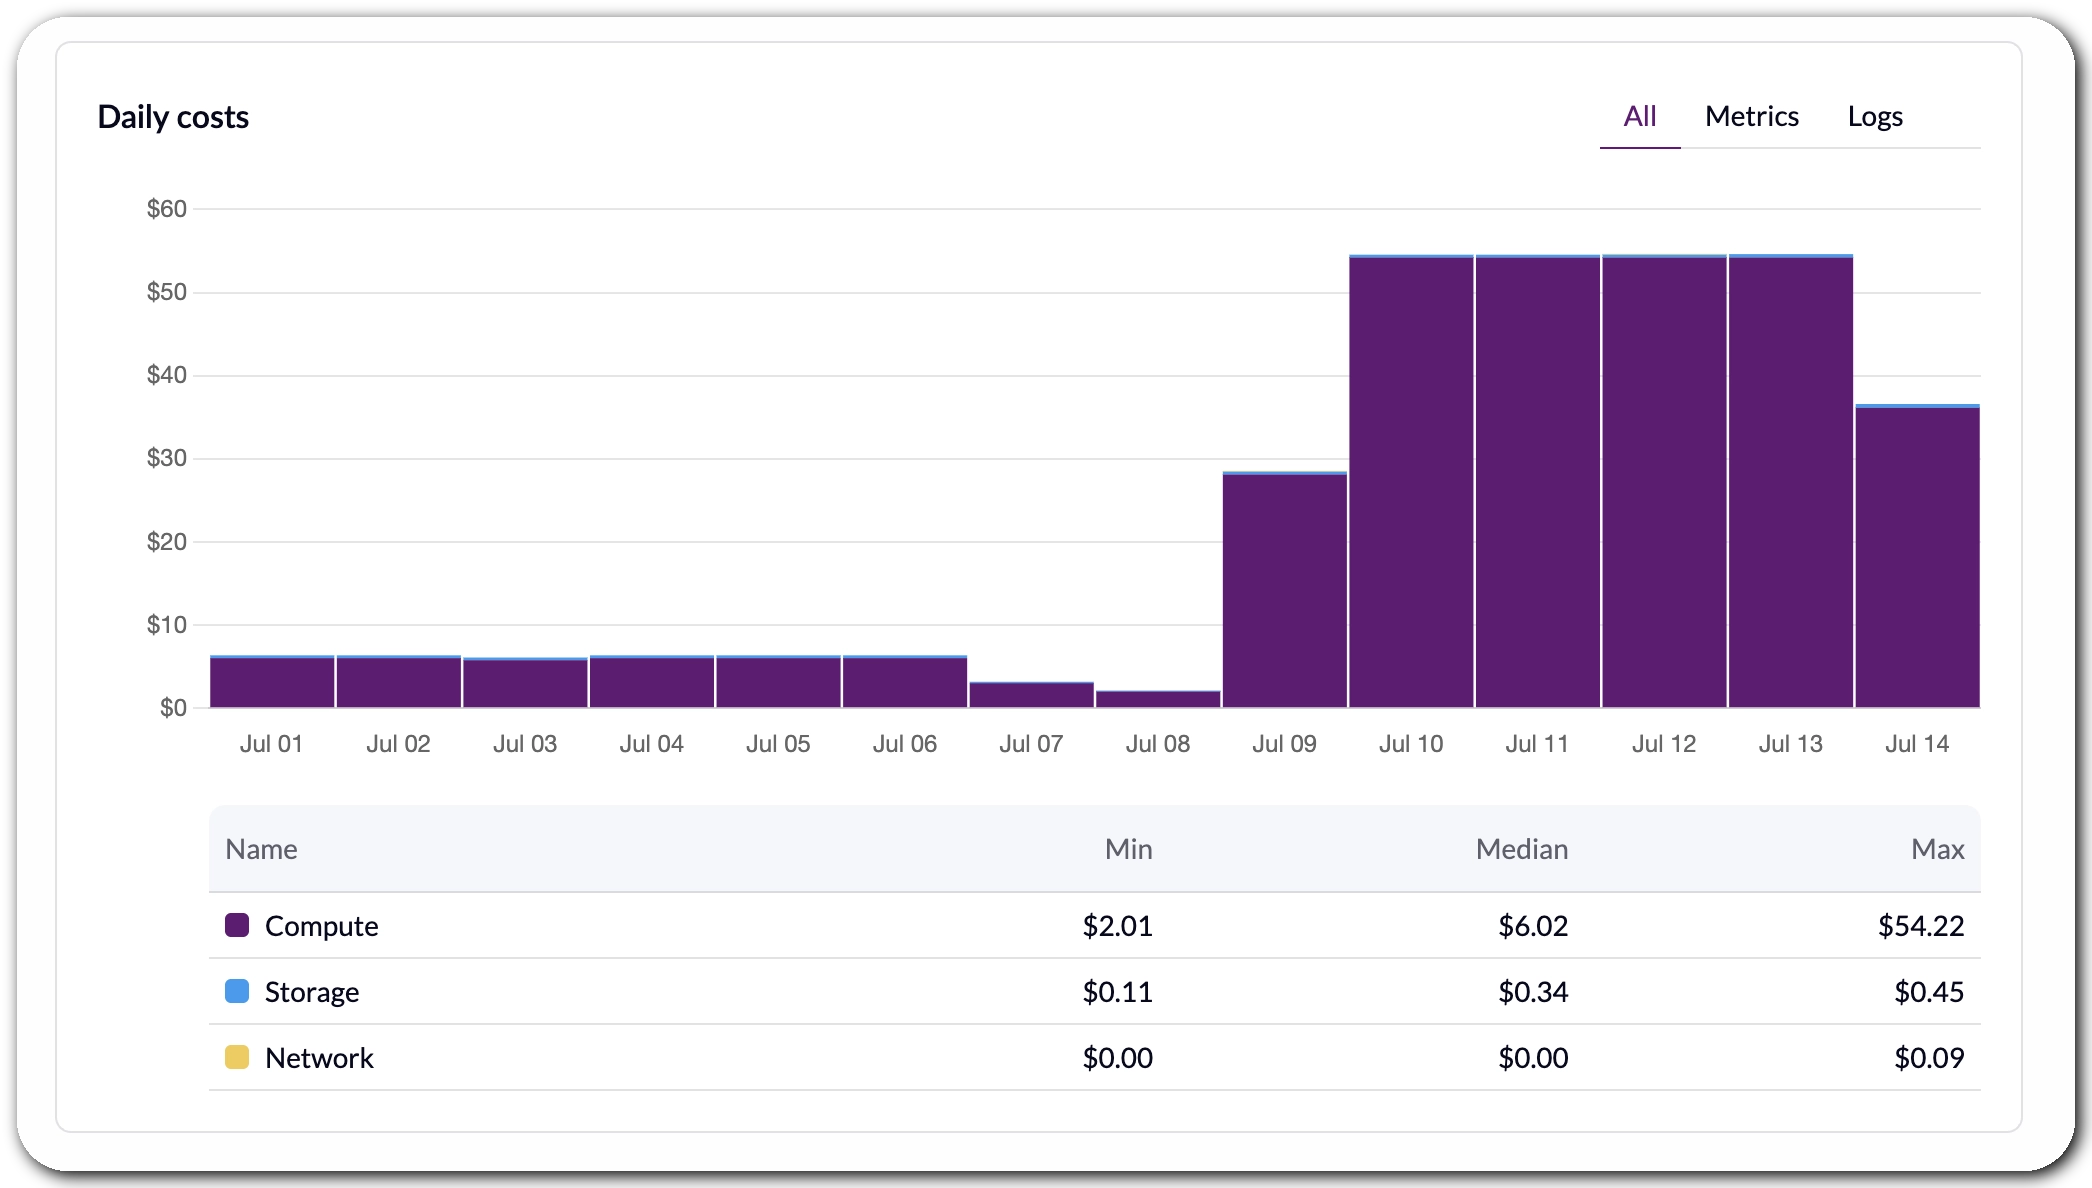
Last but not least, we have refreshed how the daily usage is presented and broken down now by:
- Deployment type: Metrics or Logs (and Traces soon!)
- Usage type: Compute, Storage or Network
- With daily entries and monthly selectors to allow controlling and understanding costs
You can read more in our billing FAQ, or sign up for VictoriaMetrics Cloud and try it yourself with a one-month free trial, no credit card required.
A Better Ship to Navigate the Cloud
#
The console has grown a lot over the last few quarters: metrics, logs, alerting, integrations, billing… So we decided it was about time to spend some efforts to improve navigation. Whether you’re a fan of pure cinema or you don’t like to be Nolan-splained, navigating the Cloud product should never become an Odyssey.
Collapsing the Side Panel
#
When we’re trying to debug a complex problem, everything else is a distraction. Now, VictoriaMetrics Cloud has modernized the side panel and it’s able to be collapsed into a smaller bar, letting you focus on what matters most.
Mobile, for the First Time
#
We wanted to democratize Cloud so everybody would be able to see it as Nolan intended
in their preferred device (last joke about this, I promise!). VictoriaMetrics Cloud now adapts to
mobile devices. While there’s still more work to be done, we noticed more and more users were
utilizing their pocket devices to access the Product, so we wanted to lend a hand. It’s already
traumatic enough needing to check some metrics on the go, so we hope this would make our users'
life (a bit) easier.
Explore Improvements
#
The Explore view in VictoriaMetrics is where users dive into their data. We wanted to improve
their experience this quarter by adding the following changes:
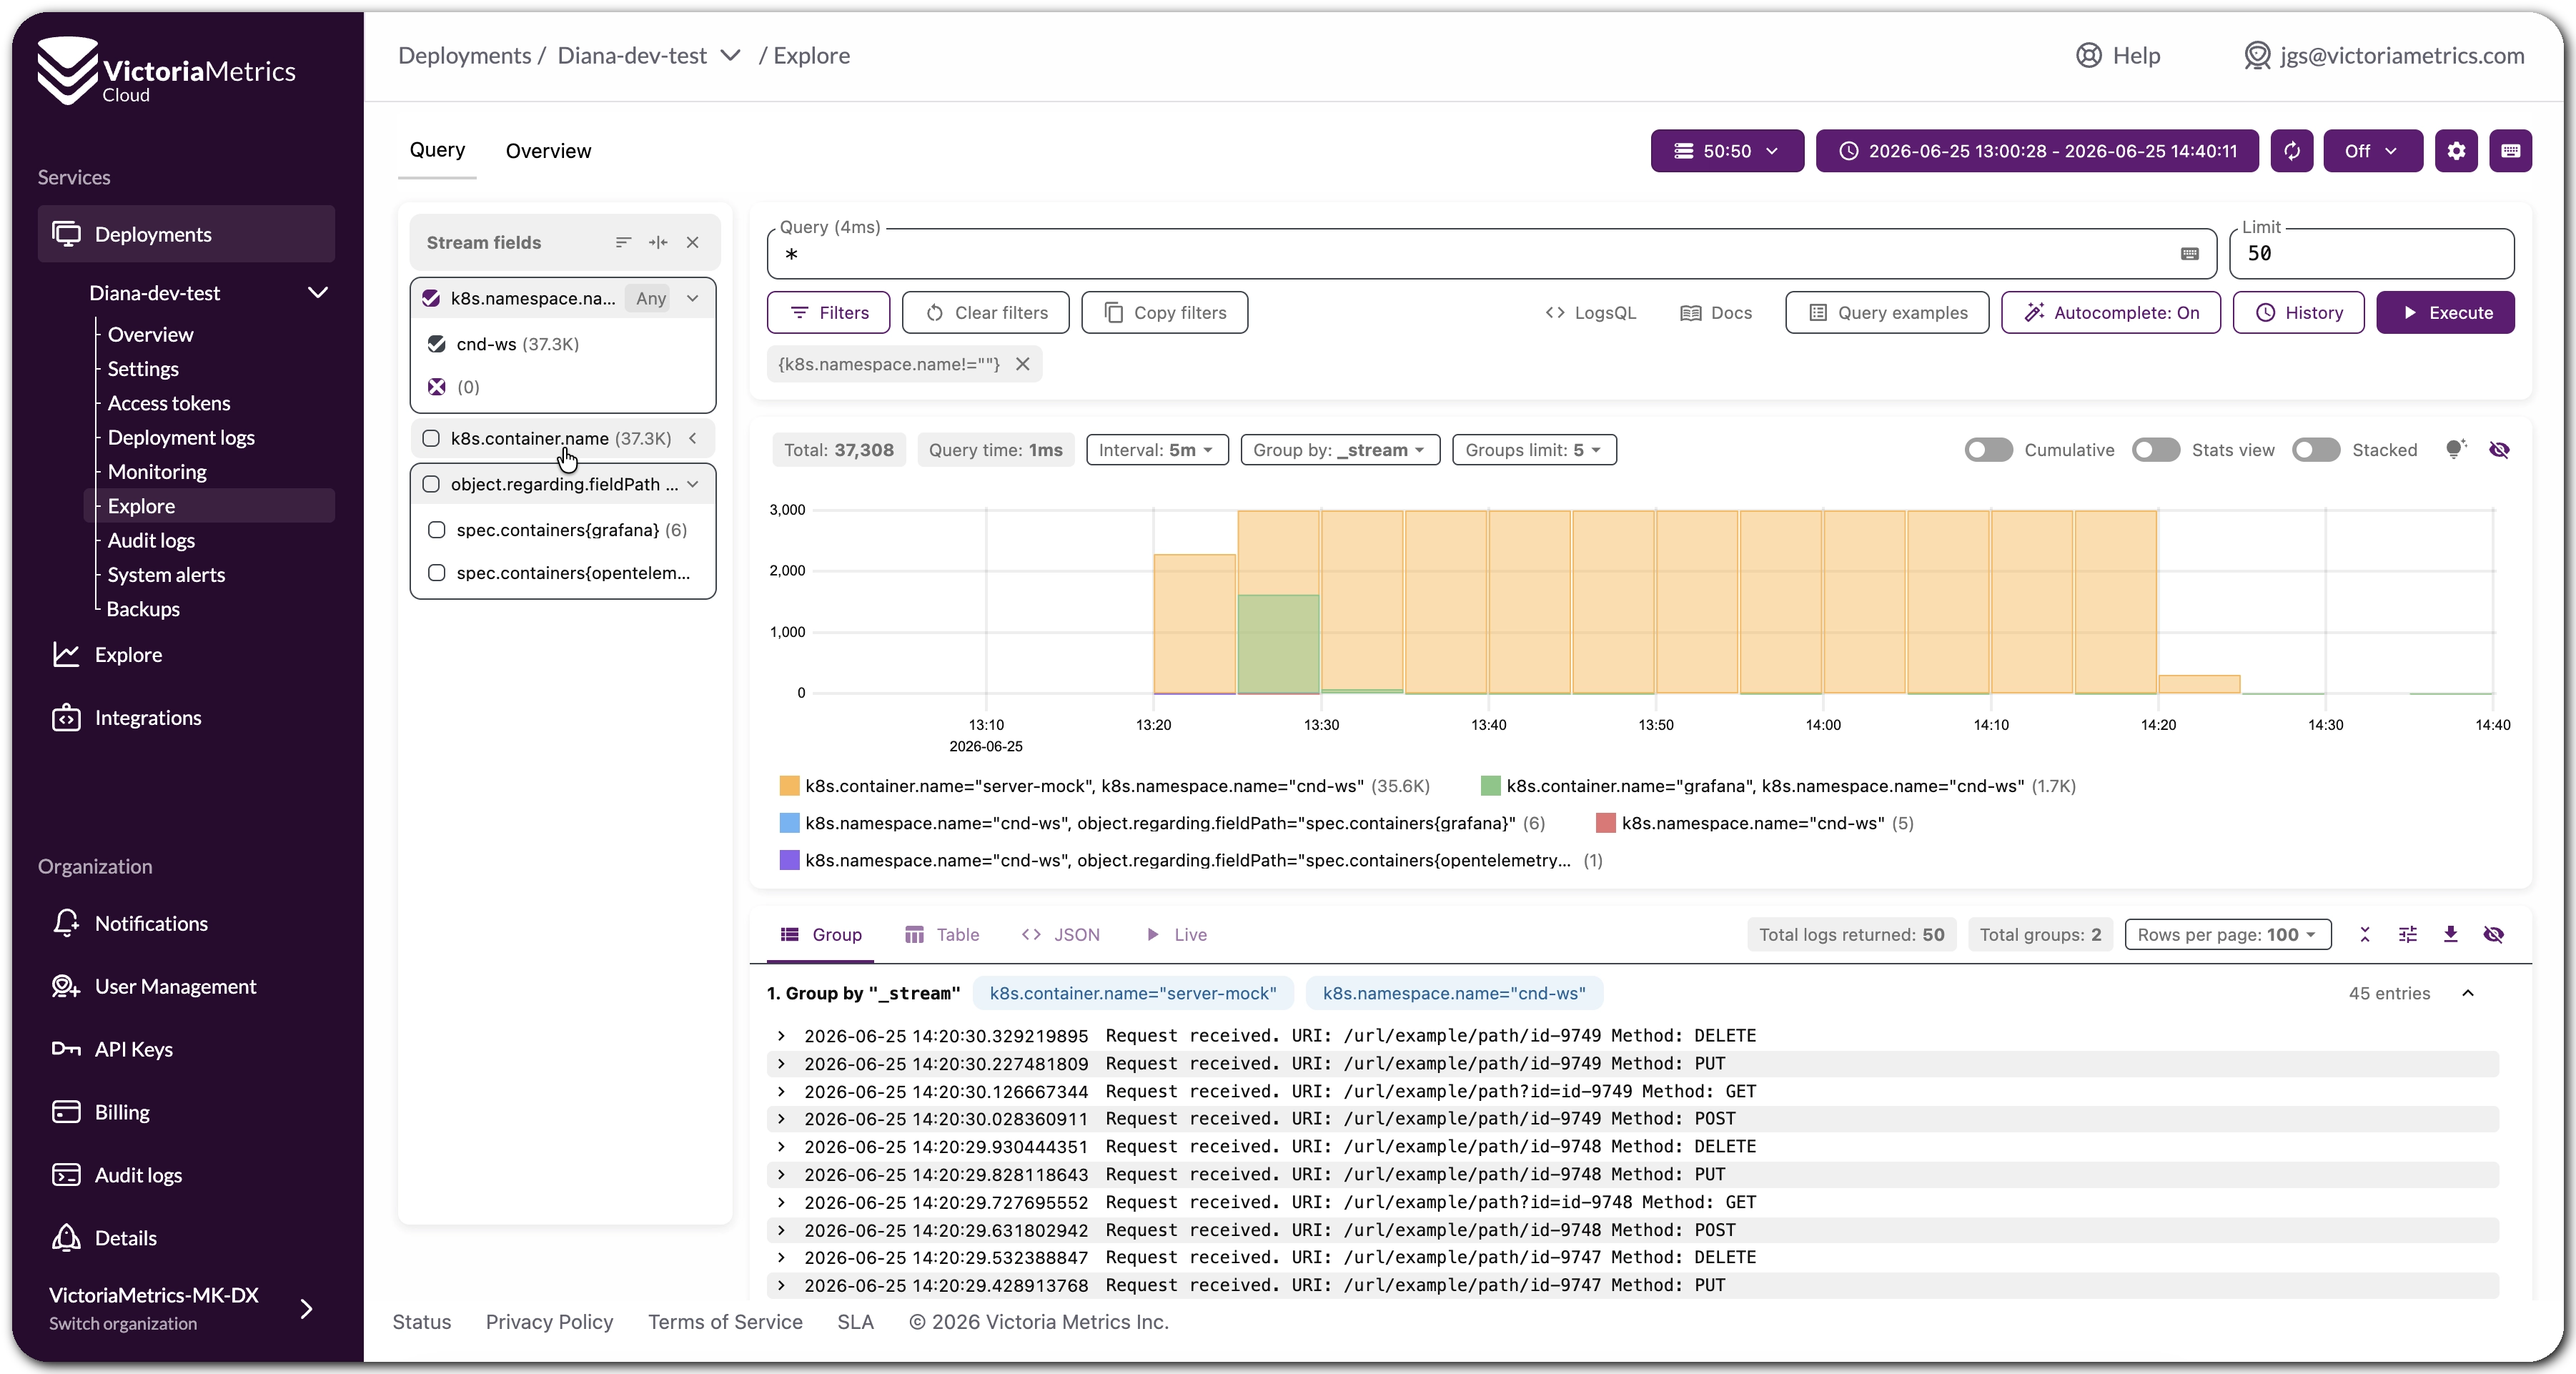
New filters sidebar: the
Exploresection for VictoriaLogs has been adapted to add this new capability from VLUI (you can see it in action in our public playground). Stream fields can now be easily used to filter data on the fly.Raw Query Tab: We also updated the VictoriaMetrics Explore UI to add a view for querying and displaying raw samples from VictoriaMetrics.
It works on my
laptopphone! Together with the change just announced above, theExploreview is also adapted to work on your mobile devices or small screens. Of course we recommend a reasonable screen size to properly visualize your data (no pun here, as promised).VLUIis now the interface forDeployment logs: we have one of the most powerful user interfaces for logs exploration, so it was a matter of time for this change. We also got feedback from users that they wanted to know all the logs from the instances, so we took the chance to both make all logs available and present them with the usability ofVLUI.
Learn more about VictoriaMetrics User Interfaces and available Playgrounds here.
Telling Metrics and Logs Apart at a Glance
#
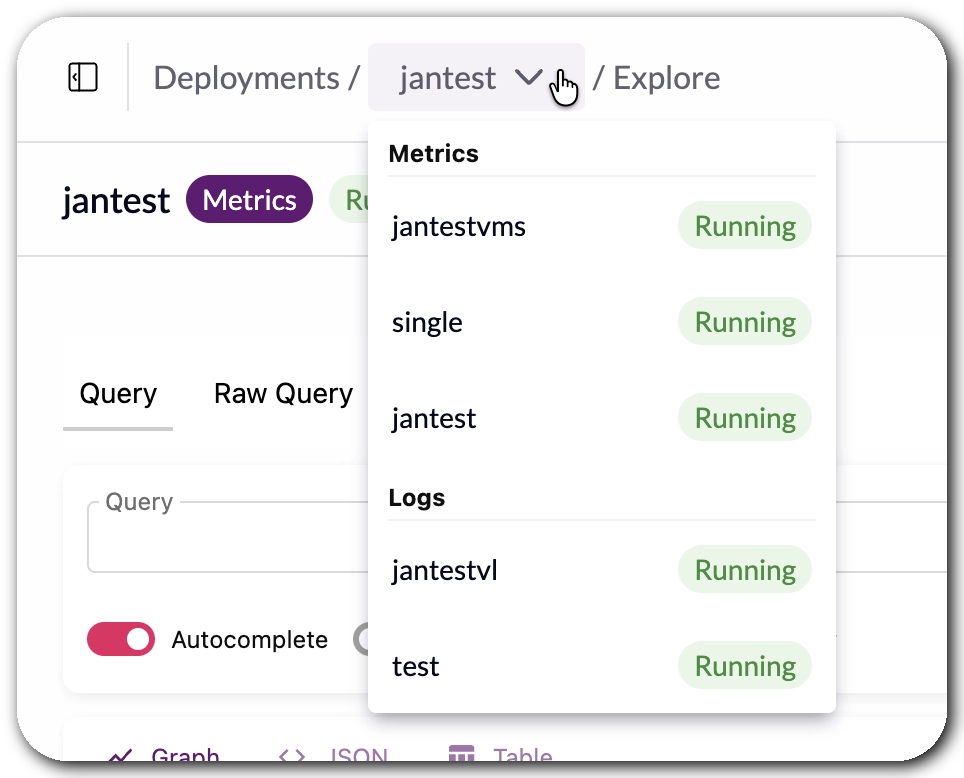
Finally, the deployment dropdown now clearly differentiates between metrics and logs deployments
when you are selecting one. A small change, but it removes ambiguity for accounts running both
VictoriaMetrics and VictoriaLogs side by side. This is useful for those who called all their
deployments… deployment!
Other Updates, improvements and bug fixes
#
We are always trying to find ways to improve based on your feedback. This time, the honorable mentions go to:
- SOC 2 tasks are done. All the work required for our SOC 2 certification has been completed and we are now waiting on the external evaluation. We will share the news as soon as we have it.
- Avoiding partial reads. We closed an edge case where certain read operations could return
incomplete results under specific timing conditions. This change improves consistency and avoids
false positives during upgrades or zone unavailability for
Clusterdeployments. - Access Tokens can now be created via Terraform. Learn more about this
Integrationhere.
Several bug fixes, as usual, with special mentioning to:
- Tenants are now maintained when navigating between the Explore section of VictoriaLogs
- Added a clarification for users that an email can be written with detailed information, and a support ticket will be created on their behalf. Learn more about contacting support here
- Updated colors in VXUI to improve consistency acroos the platform
- Improved docs and FAQs based on feedback
What’s Next
#
Compute-Based Model for Clusters and VictoriaTraces
#
We are rethinking how VictoriaMetrics Clusters (actually all deployment types) should be presented
to users, moving away from tiers based on
volume or load, like Active Time Series or ingestion rate, towards tiers based on actual resource
consumption. For Single-Node deployments we already have solid benchmarks to build this on, the
same ones behind the cost calculator we launched last quarter. Cluster is a
different story: there are simply too many valid configurations to benchmark the same way. That is
why, for the Cluster version, we offer a free 7-day Proof of Concept for any volume, where we tailor capacity
to your actual workload instead of guessing from a generic tier.
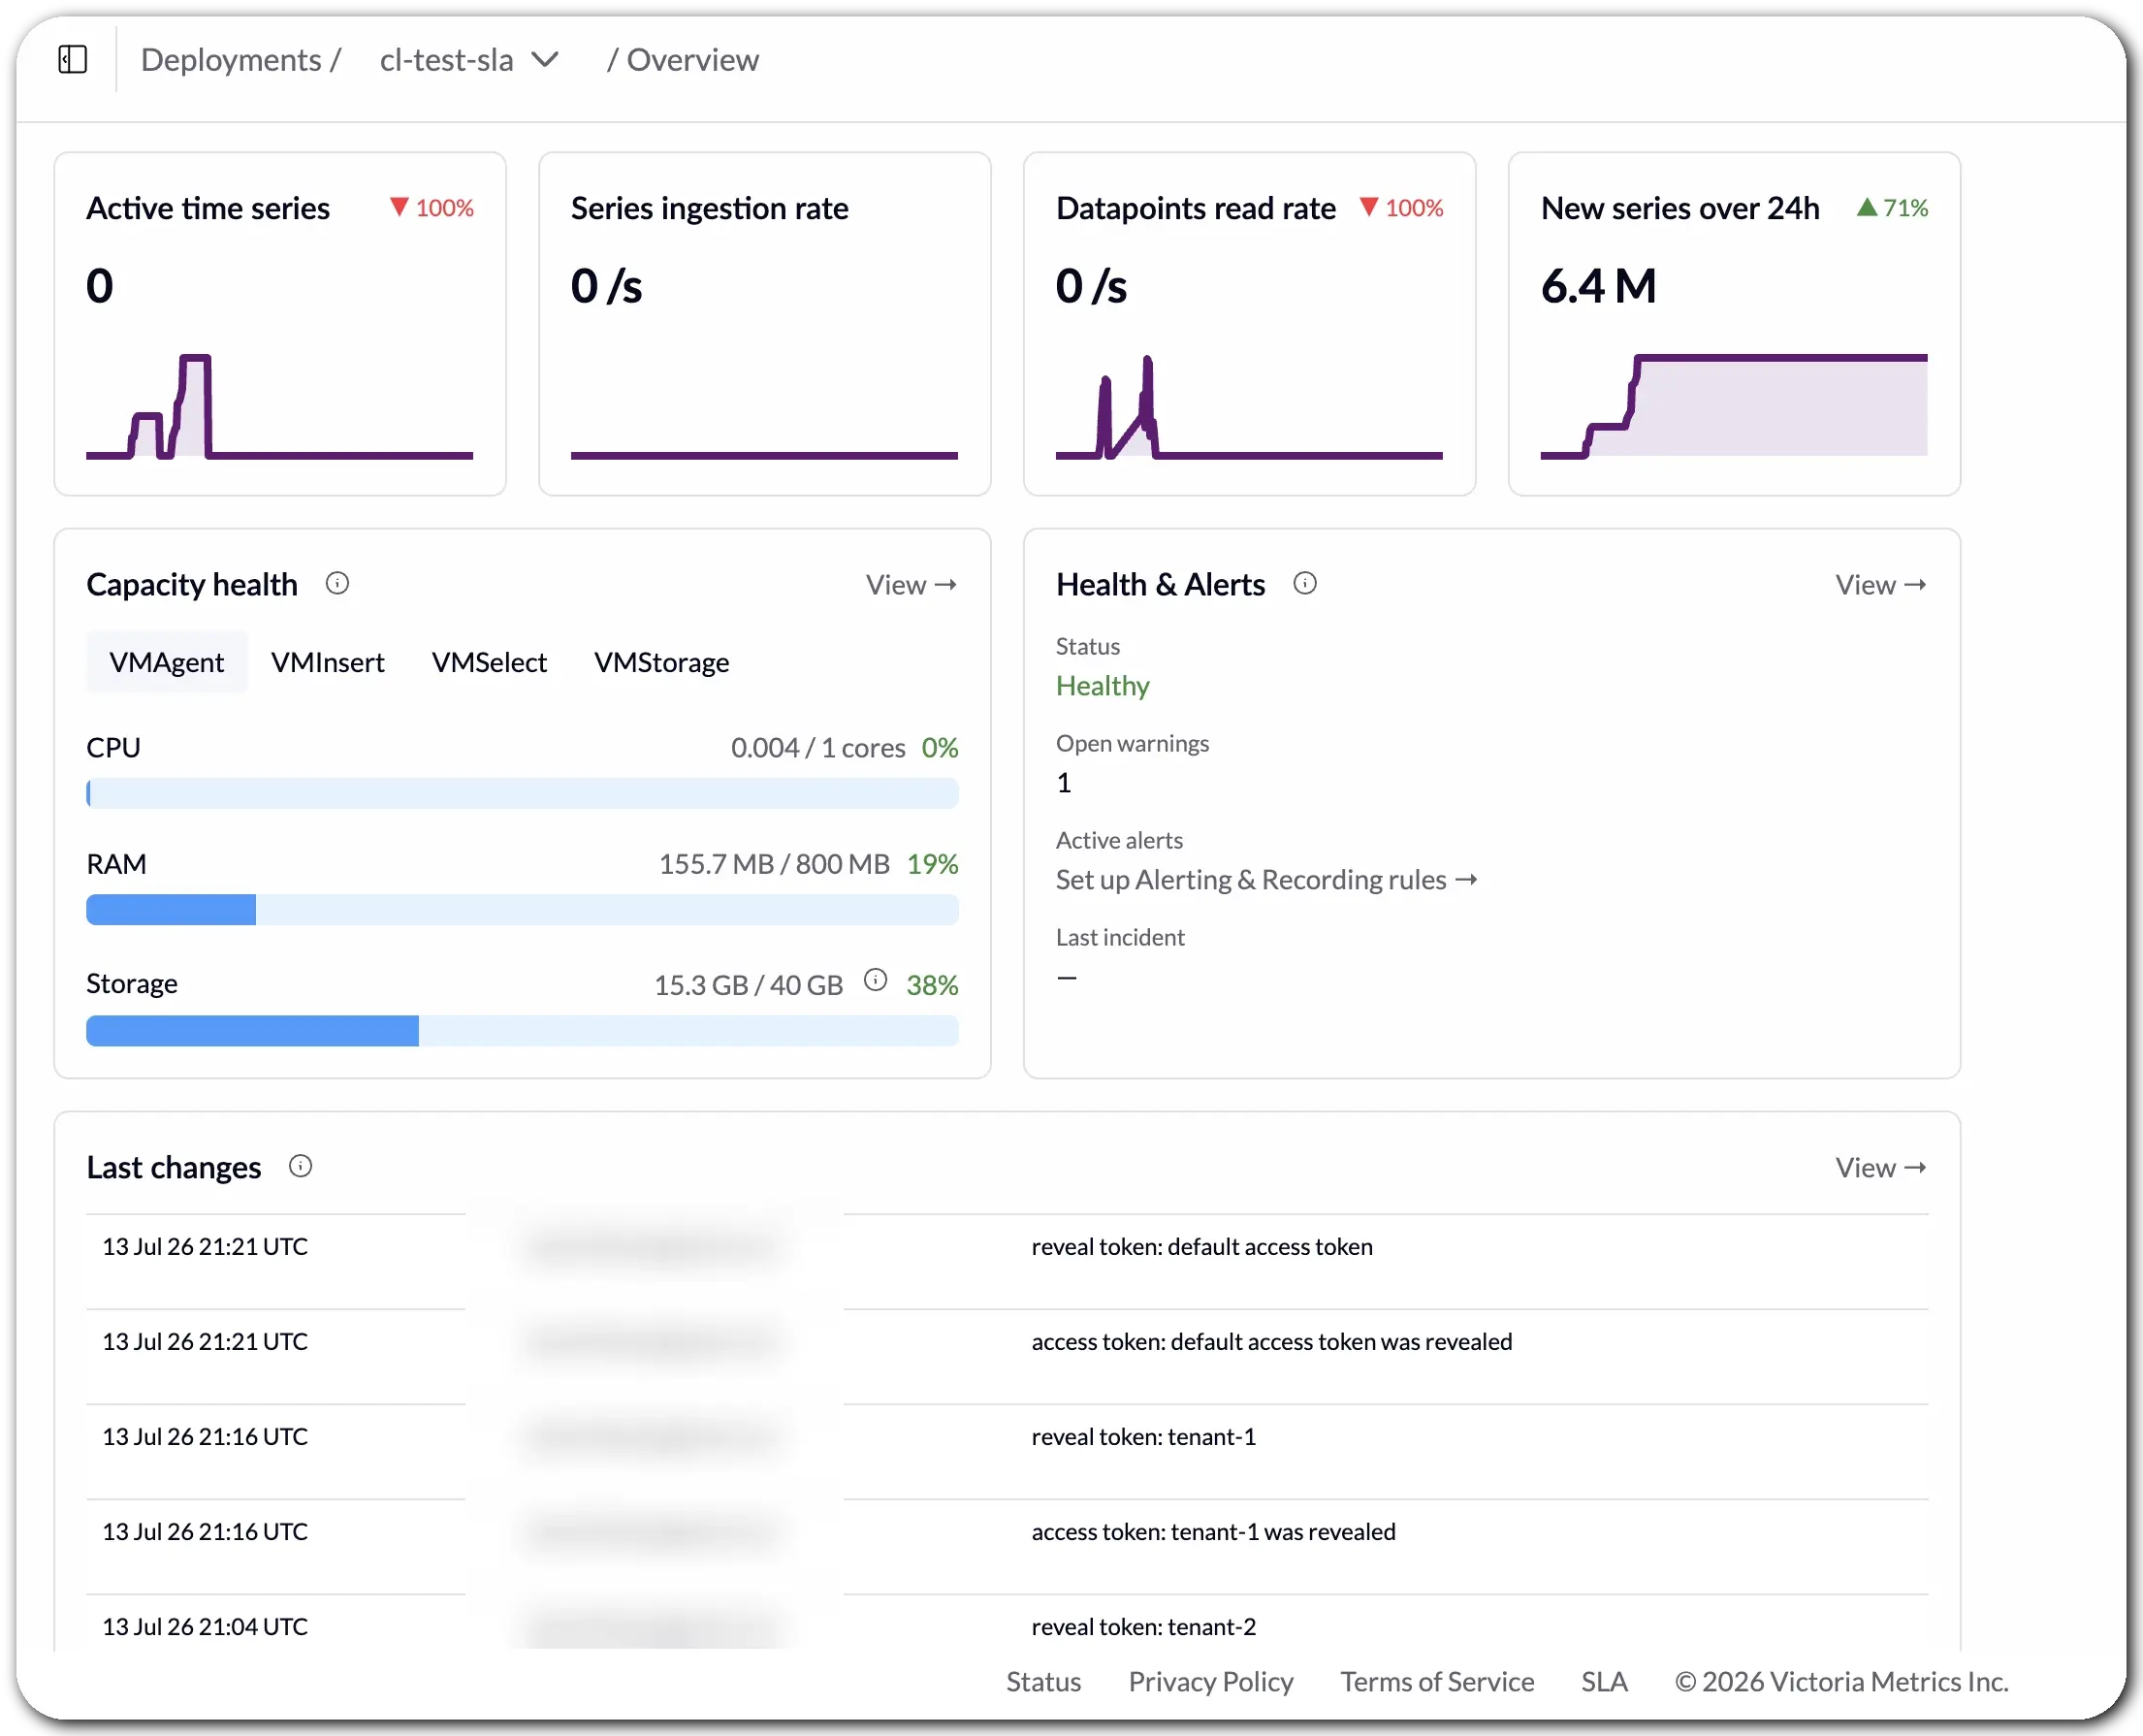
We’ve learned that users want more control and more visibility into what their deployment is
actually doing. That is why we are also reworking the Overview and Monitoring sections, so all the
relevant information is available at a glance, making it more obvious what may need attention. This change
will be rolled out in stages. The first step has been to already show CPU, RAM and Storage in the
deployment Overview page.
The next change will be to adapt the Monitoring page to show something very similar to what our
team already curated to observe Open Source deployments (see this old-but-gold
post and related assets to learn more).
We know some of you would prefer a pure SaaS, usage-only model, and we don’t offer that today based on our philosophy to avoid cost overages. To help our users choose, we have benchmarks, and 1-week free PoCs to recommend capacity planning. Apart from that, we are launching a new fleet of tiers designed for smoother transitions between them, so growth, when it happens, is gradual rather than a jump. Stay tuned!
This shift also sets the path for a much faster rollout of VictoriaTraces, and eventually
VictoriaLogs and VictoriaTraces Clusters, on the same compute-based foundation.
One More Thing
#
We are cooking something else we are not ready to talk about yet. Watch this space, and feel free to leave your guesses in the comments. If you’re interested in data visualization alternatives and are eager to provide early feedback, let us know and we will let you know when our closed beta is available.
 Watching VictoriaMetrics Cloud as Nolan intended
As always, thanks for being part of the VictoriaMetrics community. Your feedback, bug reports, and feature requests are what keep us moving in the right direction.
Ready to try everything we shipped this quarter? Sign up for VictoriaMetrics Cloud and get your first month free, no credit card required!
Leave a comment below or Contact Us if you have any questions!
comments powered by Disqus
You might also like:
What's New in VictoriaMetrics Cloud Q1 2026? Logs, MCP Server, Better Alerting, and... a Secret Project
Q1 2026 brought VictoriaLogs GA, a hosted MCP Server, a brand new cost calculator, a major expansion of alerting rule presets with a new editor, infrastructure improvements, notifications via generic webhooks and a few things we are cooking.
VictoriaLogs in VictoriaMetrics Cloud: Fast, Cost-Effective Log Management is Here
Announcing VictoriaLogs in VictoriaMetrics Cloud: fast, cost-effective log management with native OpenTelemetry support, LogsQL for powerful analysis, and integrations with Grafana and Perses for complete observability monitoring, is the best option to save costs when compared to other alternatives like ElasticSearch or Datadog.
What's New in VictoriaMetrics Cloud Q4 2025? New tiers, more deployment options, IaC and alerting rules.
In the last quarter of 2025, VictoriaMetrics Cloud brings many great features: New powerful Capacity Tiers, the expansion to the us-east-1 (N.Virginia) AWS region in the US, new Notification Groups, a Terraform provider to complete your IaC, 9 brand new Alerting Rule Integrations and much more.