- Blog /
- MCP Server Integration & Much More: What's New in VictoriaMetrics Cloud Q2 2025
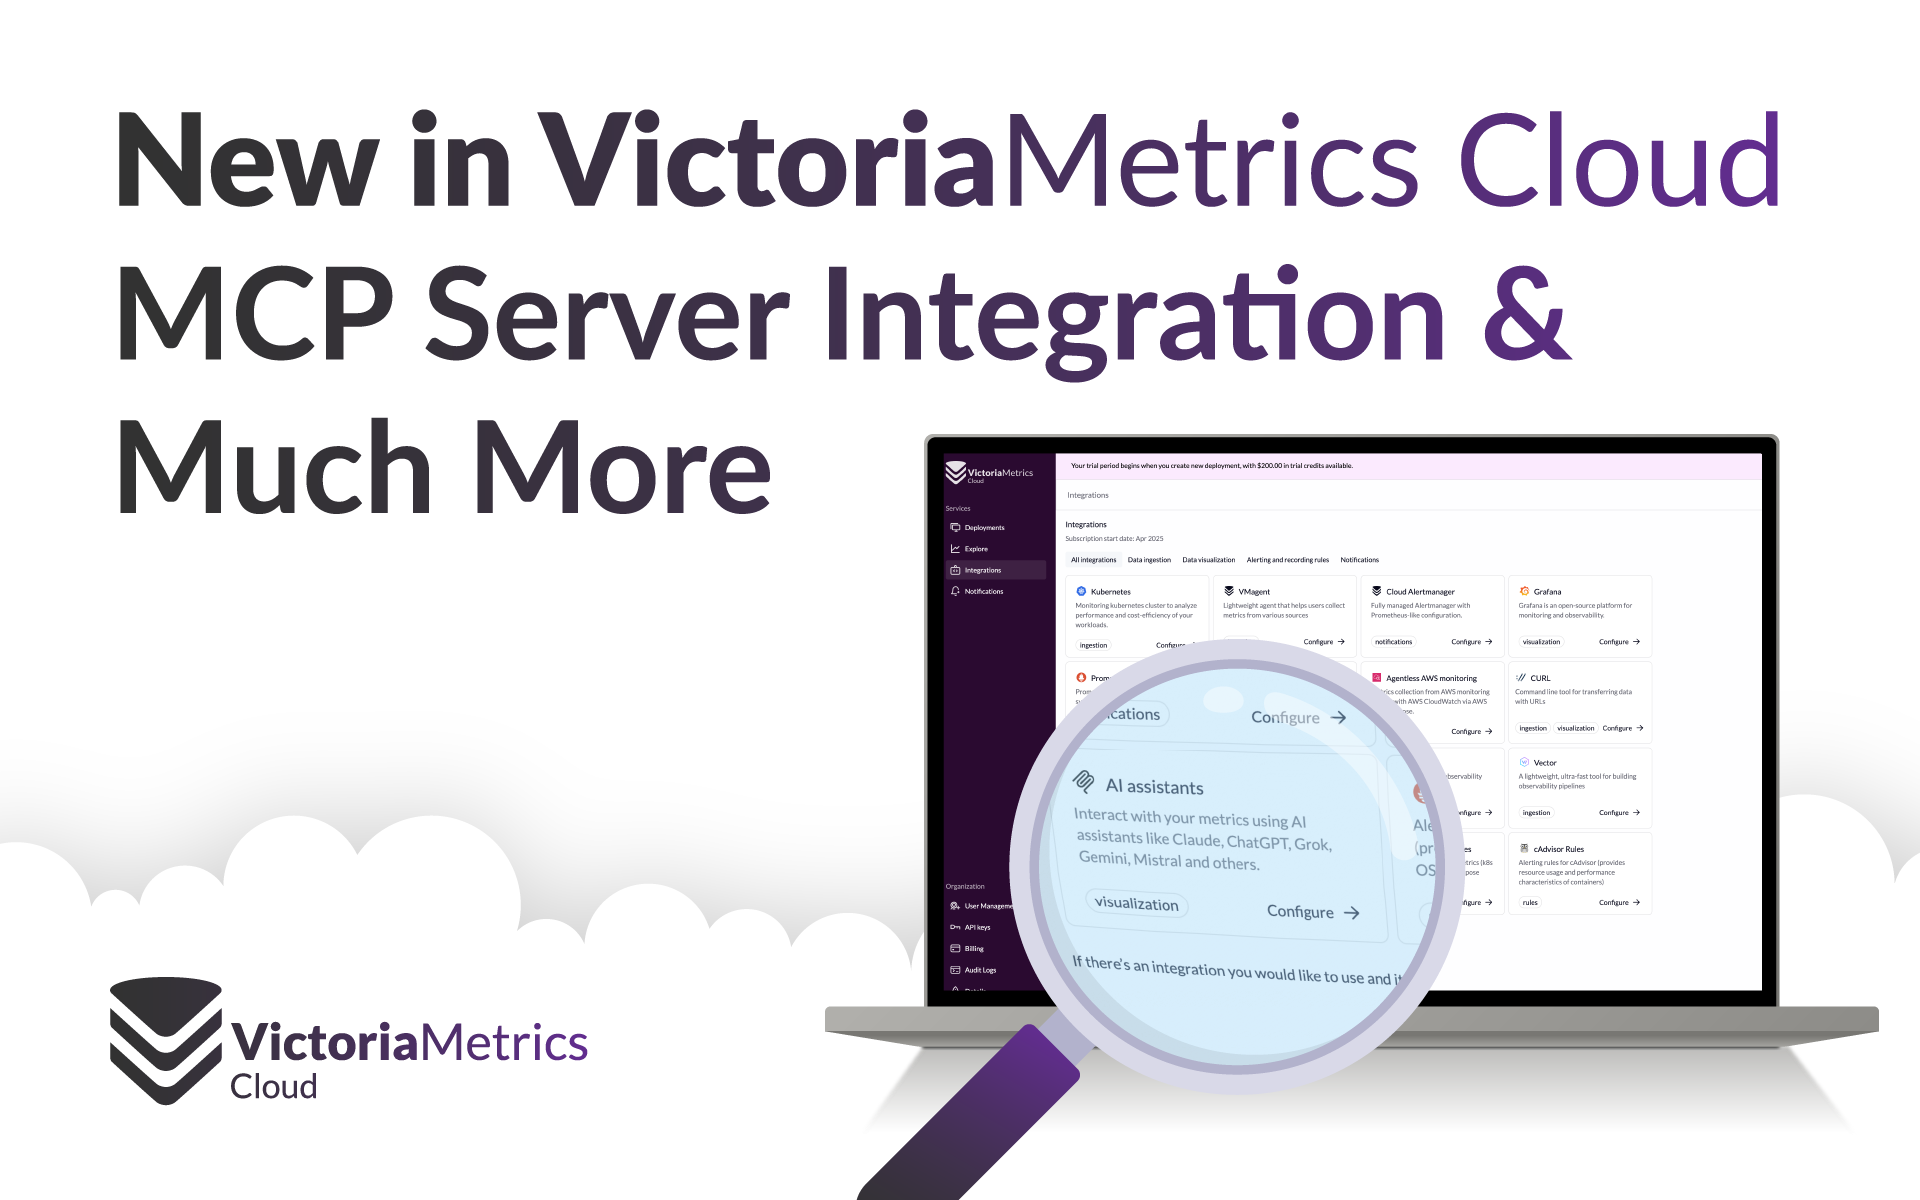
MCP Server Integration & Much More: What's New in VictoriaMetrics Cloud Q2 2025
Share:


Q2 2025 has brought another wave of improvements to VictoriaMetrics Cloud! If you tuned in to our latest Quarterly Virtual Meetup, you saw firsthand how we’re making observability even more accessible, powerful, and interactive.
This quarter’s highlights include enhanced multi-tenancy support for Access Tokens, exciting new ways to interact with VictoriaMetrics Cloud through the MCP Server integration and code-first libraries. New Alerting and Recording rules integrations and novel and unique ways to increase savings by understand what metrics you really use are also part of what this amazing teams has been dedicating time to. We’re also continuing our journey of improving our docs with a fresh approach to discovering and deploying integrations.
Don’t forget to try all of it for free today by signing up for VictoriaMetrics Cloud.
And stick around — at the end of this post, we’ll share a sneak peek into something big that’s brewing for this year. Hint: it might just change how you think about performance, scalability and interoperability for logging solutions.
Let’s take a closer look at everything that’s new.
Enhanced Multi-Tenancy Support with Access Tokens
#
One of the key requirements for enterprise observability is multi-tenancy—the ability to keep data from different users or groups strictly separated, without risking interference or visibility across boundaries. In many observability platforms, this can be a tricky and error-prone task.
At VictoriaMetrics Cloud, we’re making this simple and secure with the introduction of Tenant-Specific Access Tokens for Cluster Deployments. You can now generate dedicated tokens tied to specific tenants directly from the UI—with just a few clicks. Then, use these tokens to send or read data using the same familiar URL endpoint, now scoped to that tenant’s data only.
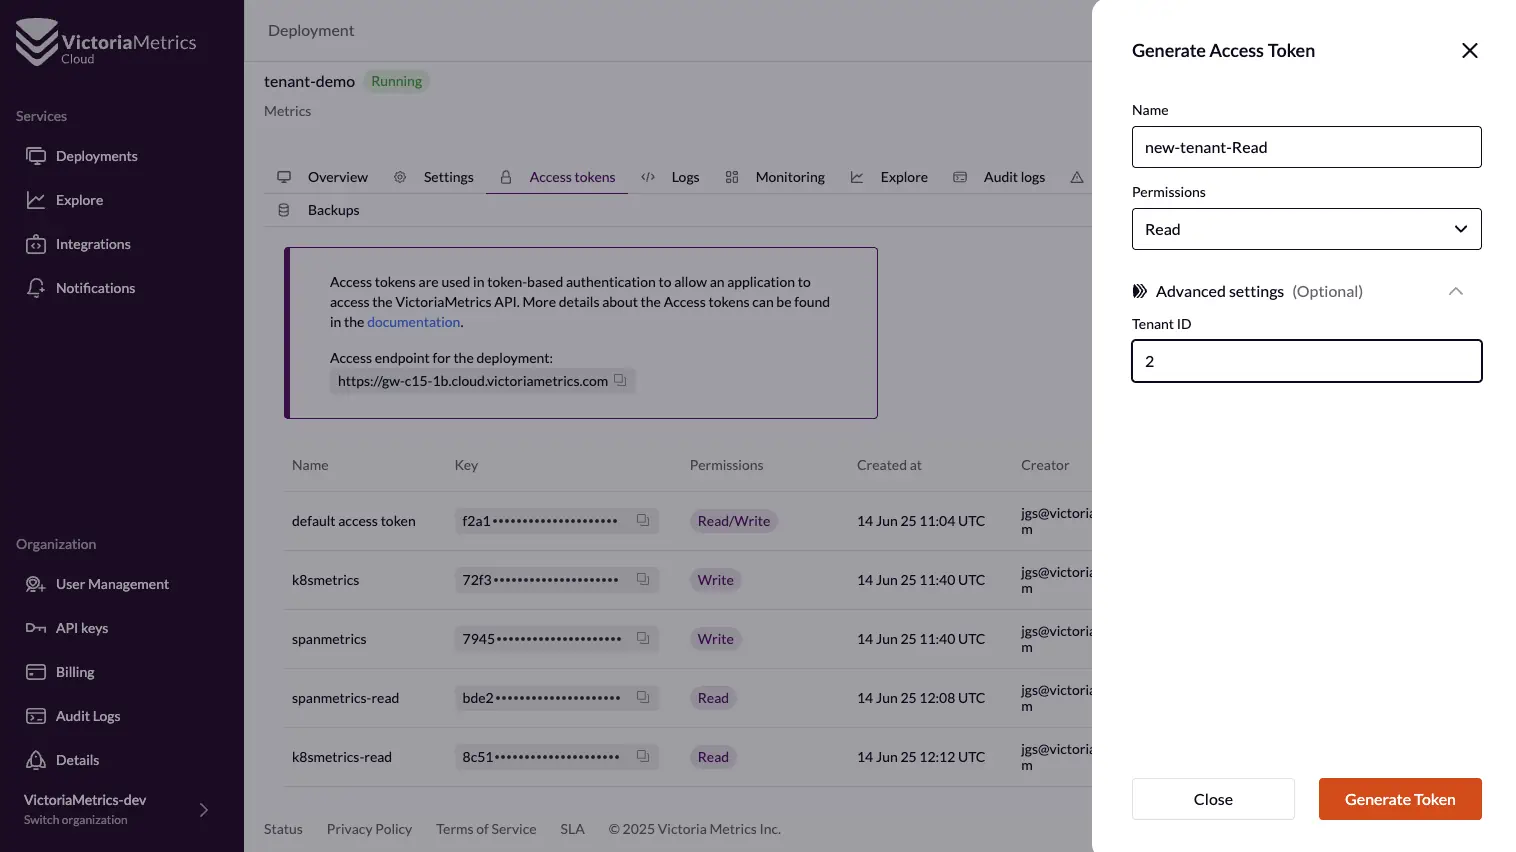 Creating tenant-specific tokens
To make management even easier for administrators, we’ve added “Last Used at” information for access tokens. This helps you audit access over time, identify stale or unused tokens, and clean up old ones safely. It’s also great for checking if any users are over-utilizing their credentials.
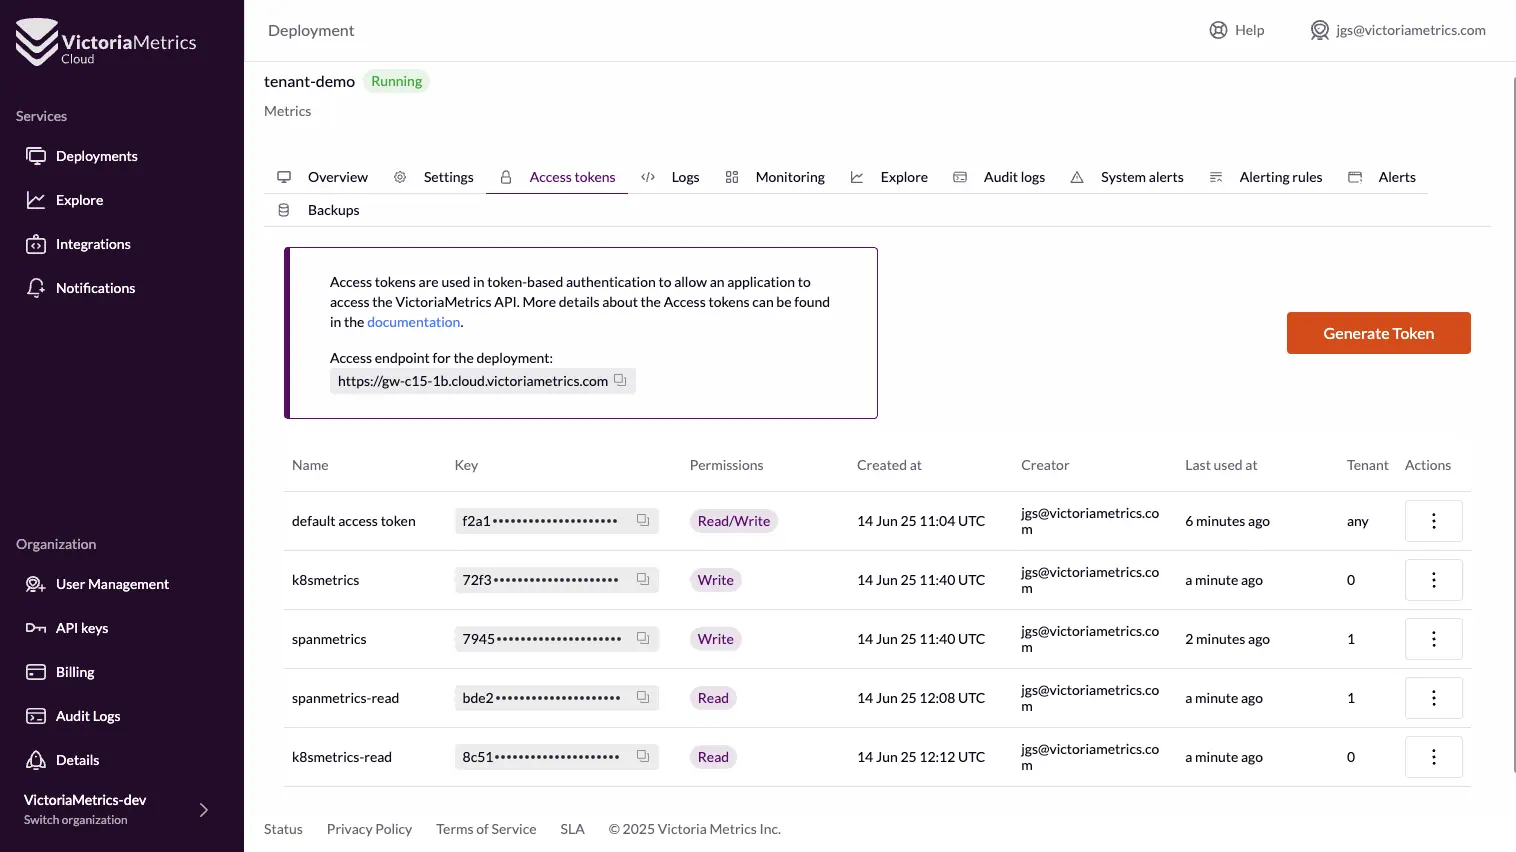 Access Token last used info
We’ve also added a new Access Token Usage Monitoring graph under the Monitoring section. This provides a real-time view into how many concurrent requests each token is handling. It’s a powerful way to understand usage patterns across tenants and spot issues fast.
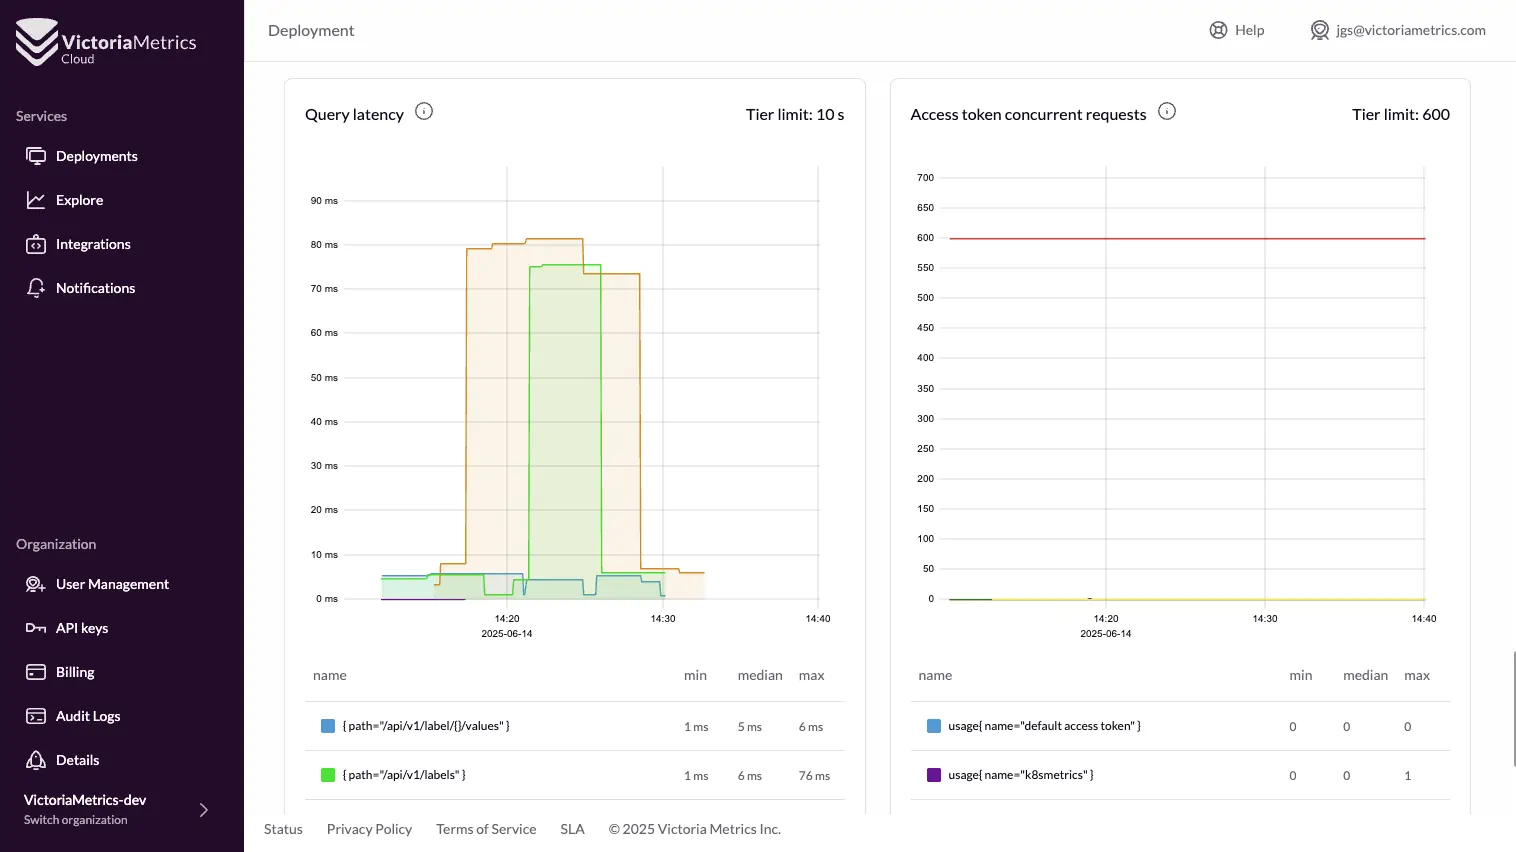 Access Token concurrent usage graph
Want to get started? Full documentation on how to create and manage Access Tokens is available here.
Talk to the Cloud! MCP Server integration
#
As Alexander Marshalov shared in his talk, the brand new VictoriaMetrics MCP Server is here—and it’s a game changer. With it, you can now interact with your metrics using natural language, making observability even more accessible without the need to create dashboards for everything.
And now, we’ve taken it one step further by integrating this capability directly into VictoriaMetrics Cloud under a new integration category: AI Assistants.
Just like with any other integration, all you need is an Access Token and your deployment URL to start asking questions about your metrics. Whether you’re using Claude Desktop, Cursor, Visual Studio Code, or another assistant that supports AI plugins—you’re just a few clicks away from conversational observability.
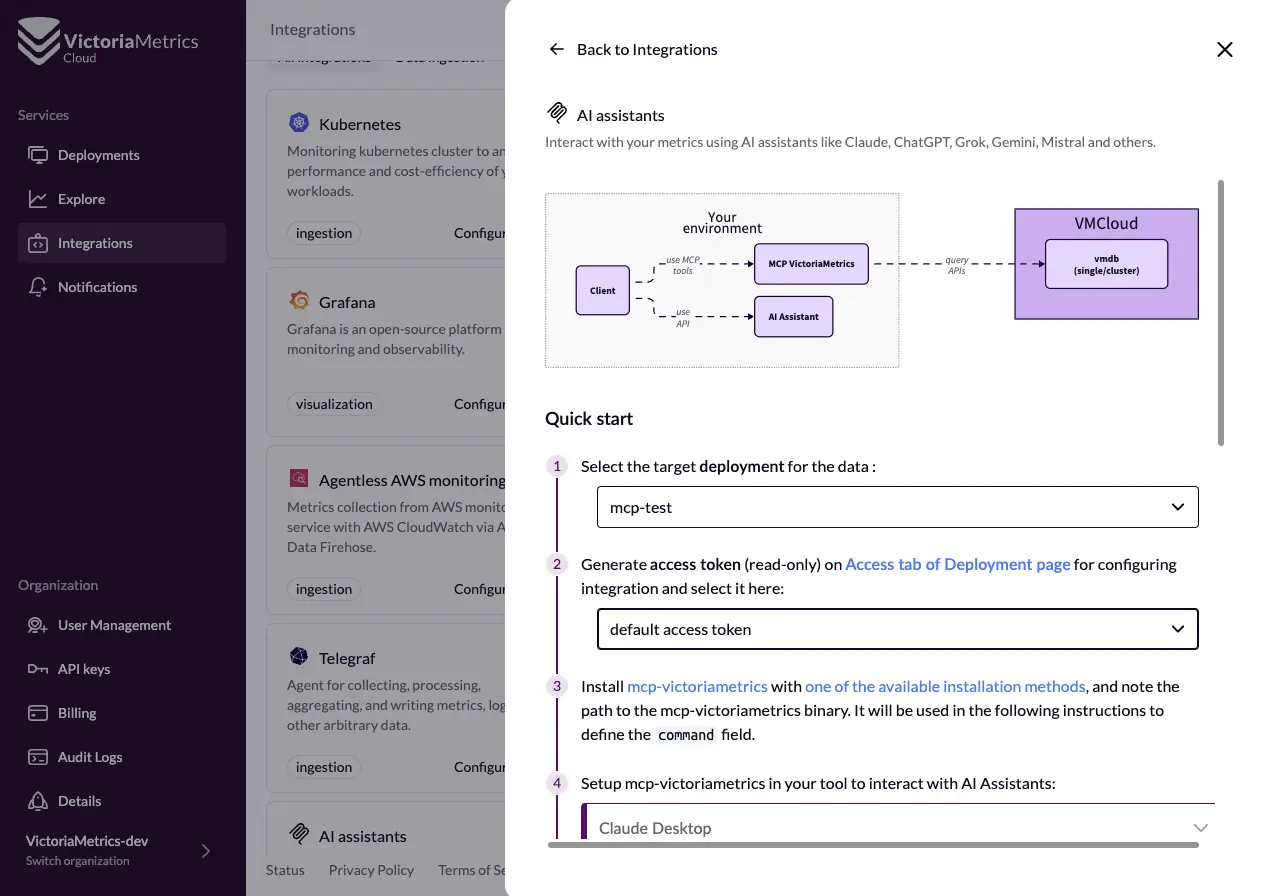 Guided integration in VictoriaMetrics Cloud UI
Want to dive in? Head over to the VictoriaMetrics Community MCP repository to install the MCP server locally or in the cloud and start talking to your metrics right away.
After that, you should be ready to go and ask about our application metrics—like success rate and latency—and get insights back in the split of a second. No complex queries, no guesswork—just answers.
The MCP Server supports nearly all read-only APIs available in VictoriaMetrics—basically everything you can do from the VMUI, (just now possible through natural language):
- Query metrics and explore data (even draw graphs if your assistant supports it)
- List and export available metrics, labels, label values, and entire time series
- Analyze, explain, and trace your queries
- Debug relabeling rules, downsampling settings, and retention configs
- Inspect alerting and recording rules and see what’s firing
- Get metric usage stats and explore cardinality
- Check your instance configuration and usage metadata
Don’t miss this opportunity to become good old Abe.

Don’t want to deploy the MCP server yourself?
You can point your own agent to https://play-mcp.victoriametrics.com/mcp. This url is for the agent, not your browser!
Code to the Cloud! New Go library
#
But not everything is about AI and asking agents. Sometimes we also need to vibecode! Or at least try.
That’s why we are making it even easier to build, automate, and integrate with VictoriaMetrics Cloud.
This time directly from your Go code.
We want to introduce victoriametrics-cloud-api-go,
a new official Go client for the VictoriaMetrics Cloud API. This library provides a new
typed interface for interacting with your deployments, making it simple to manage your monitoring
infrastructure programmatically.
Whether you’re scripting setup for CI/CD pipelines, automating deployment creation, or managing access tokens, this library is designed to help you code to the cloud with minimal effort.
What Can You Do with It?
#
This Go library offers first-class support for all key VictoriaMetrics Cloud API endpoints, including:
- Deployments: List, create, update, delete, and fetch configuration for your cluster deployments
- Access Tokens: Create, revoke, and inspect tokens (with last usage metadata)
- Cloud Info: Discover available cloud providers, regions, instance types, and VM versions
- Account Info: Fetch details about your current account and subscription
All API interactions are fully typed and handle HTTP details under the hood, so you can focus on your business logic—not parsing JSON.
Check the API documentation here!
If you are wondering how it looks like, the README already gives you many examples to quickly get started.
New Integrations Category: Alerting and Recording Rules
#
But enough with AI and code automation! Let’s also work with the UI, shall we?
In case you missed it, in our most recent blog we talked about integrations and how we value the power of interoperability and making things easy to users.
Today we are announcing the addition of a brand-new integration type to VictoriaMetrics Cloud: Alerting and Recording Rules!
This new category launches with 3 powerful integrations for commonly used exporters:
- Node Exporter
- Kube State Metrics
- cAdvisor
These integrations are powered by the excellent open-source project Awesome Prometheus Alerts. Now, instead of copying and tweaking Prometheus rule YAML files manually, you can simply pick your preferred rules and alerts from a curated list—directly from the console—with just a few clicks.
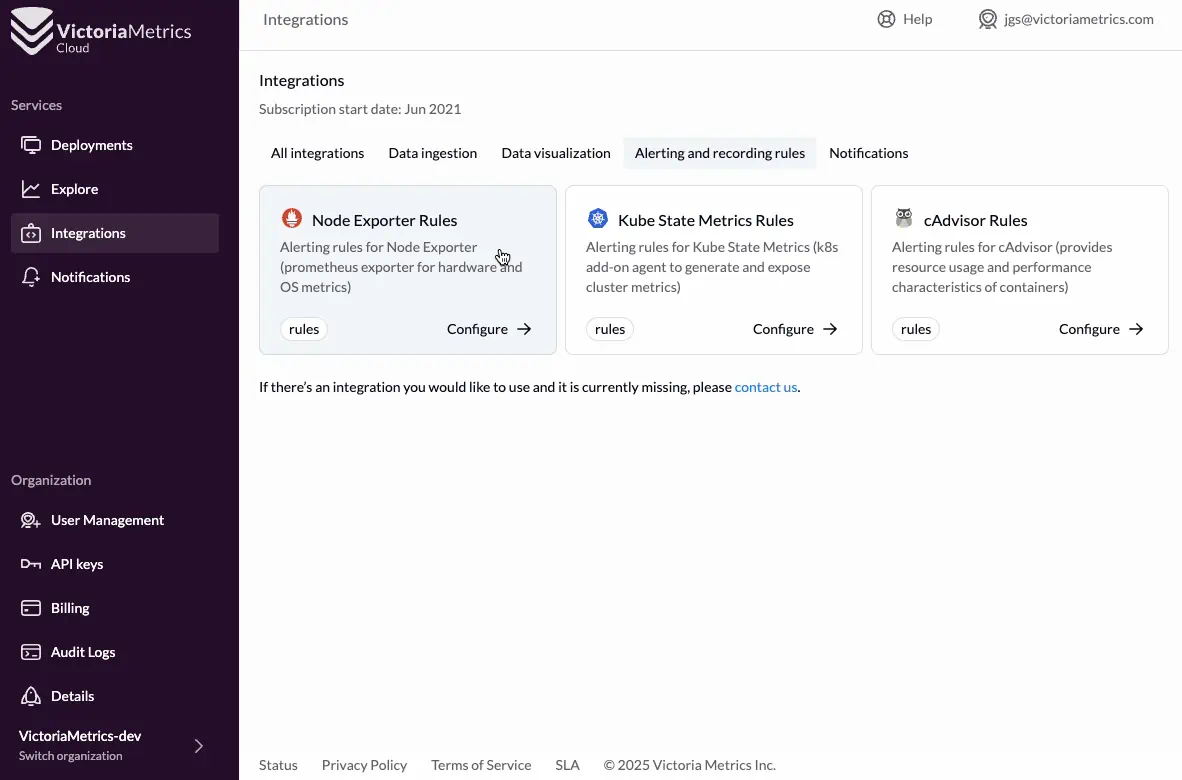 New integration: Alerting and Recording rules
One of the biggest challenges in monitoring is knowing which alerts to configure, how they look, and whether they’ll actually help when things go wrong. Alert fatigue is real—and this integration helps solve that.
With this update, you can now:
- Browse popular, battle-tested alerting rules
- Preview rule definition and thresholds visually
- Deploy them instantly to your VictoriaMetrics Cloud environment
This removes cognitive load and enables users to start with alerts that matter—no YAML legwork required.
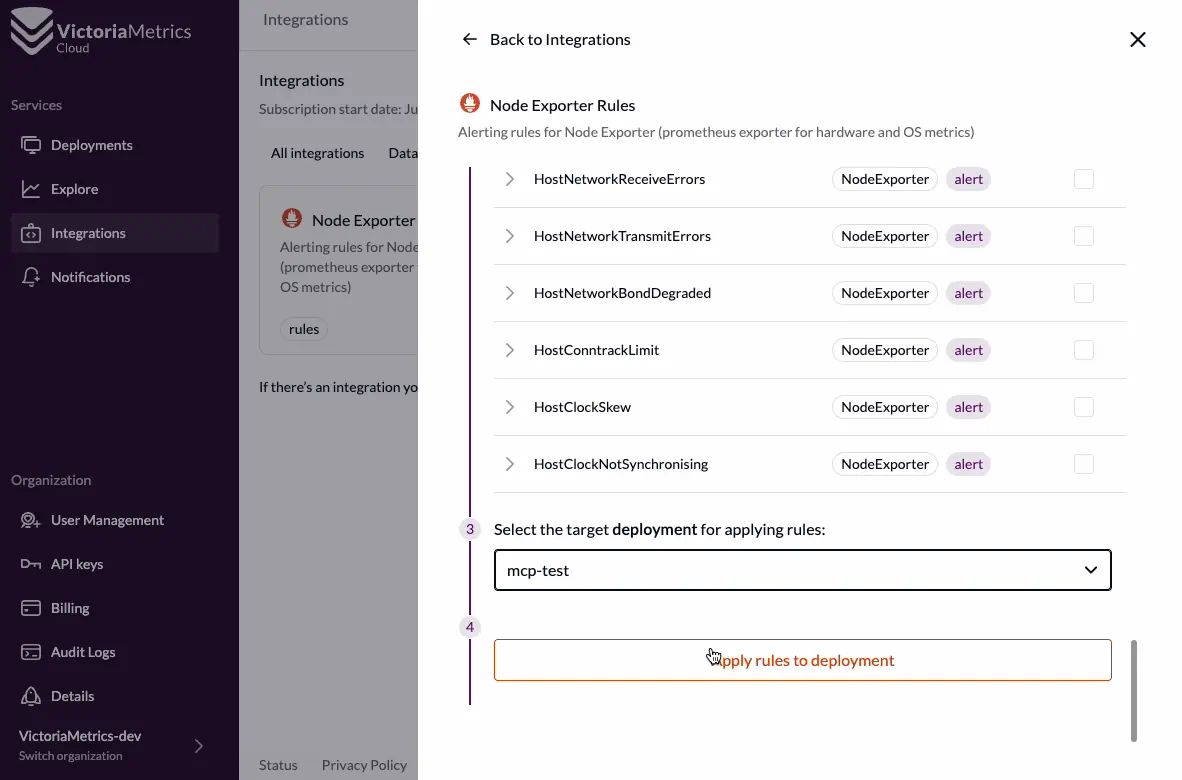 Choose alerts from the catalog
Track your metrics usage: Understand what you really need
#
We’ve added a powerful new feature inside the Cardinality Explorer in the Explore section: Track ingested metrics usage. Powered by VMUI, this tool provides visibility into how often your metrics are actually being queried.
This is based on the unique metric name usage tracker functionality built into VictoriaMetrics—and now it’s enabled by default for all Cloud users.
You’ll now see two key fields per metric name:
- Requests Count – the total number of queries involving this metric
- Last Request – the timestamp of the most recent usage
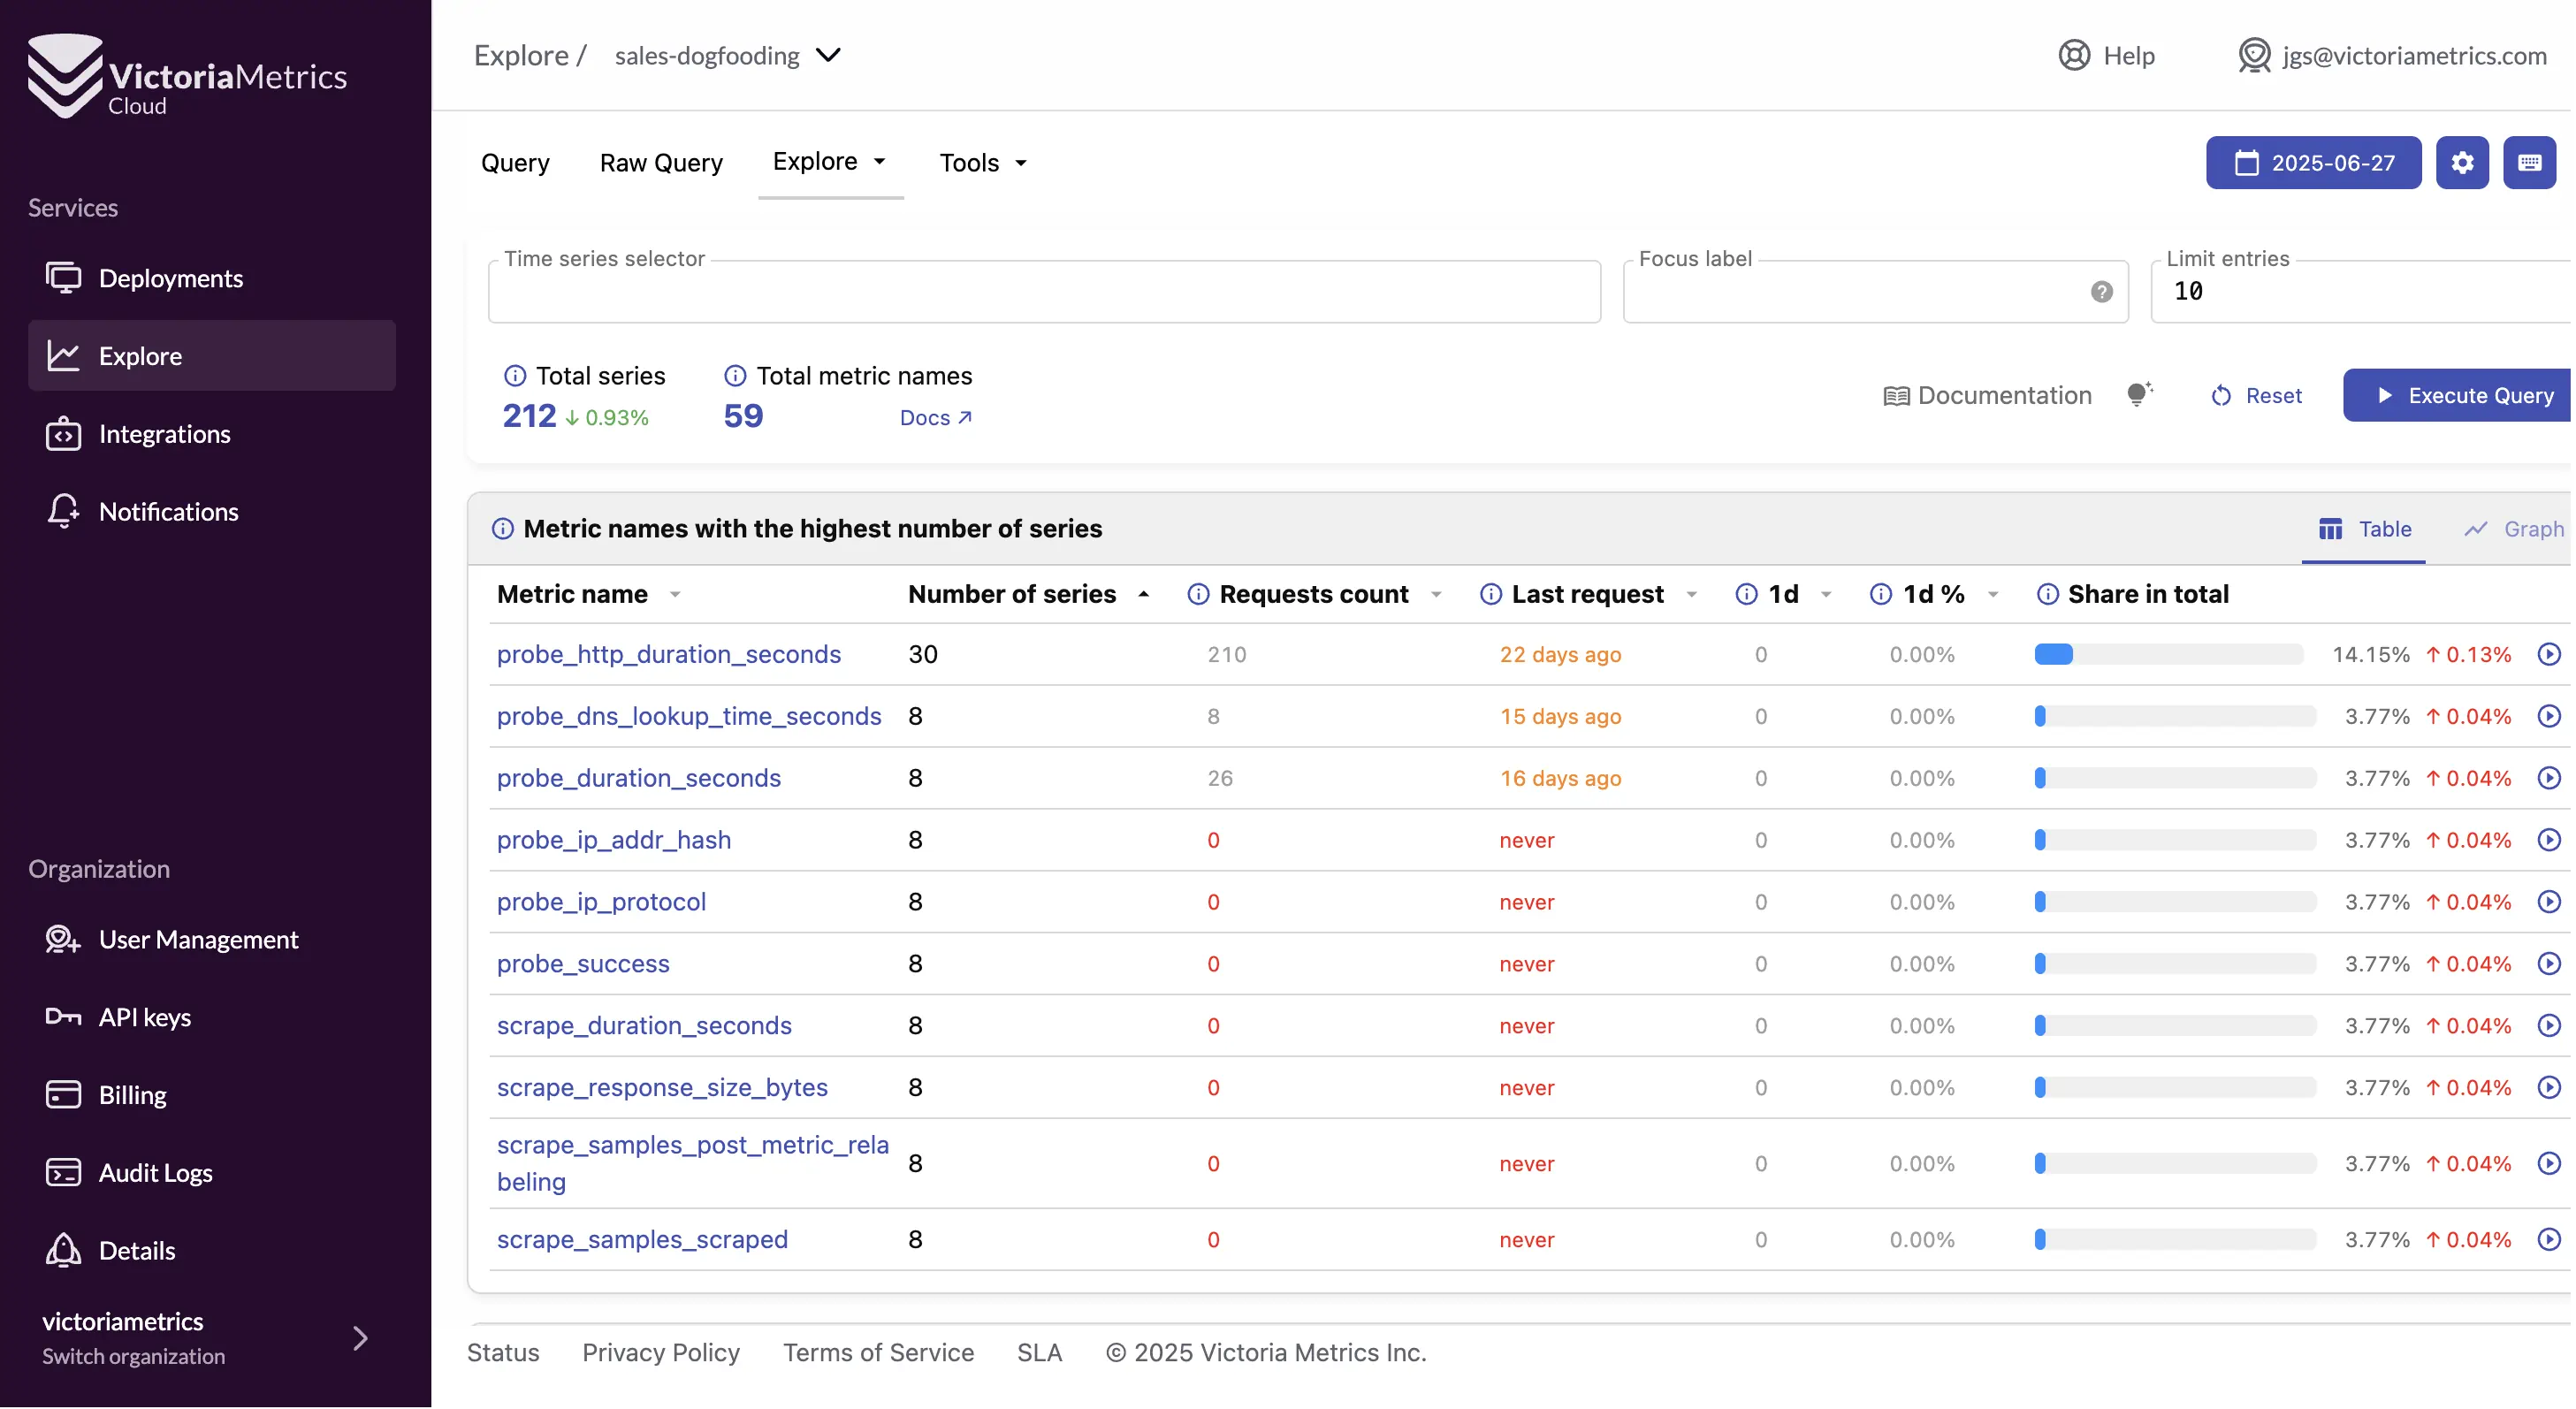 Metric usage stats in the Explore tab
This kind of insight is incredibly valuable. In many observability platforms, unused metrics quietly accumulate—wasting resources and inflating costs. With VictoriaMetrics, you can now identify underused or unused metrics and take action confidently.
Stay tuned—we’re working on a dedicated blog post that will walk through real-world examples of how to use this feature to optimize your setup and cut costs.
By knowing what’s used (and what’s not), you’ll be able to clean up stale data, tune dashboards, and reduce storage overhead.
Important Update: TLS Versions Support Change
#
As part of our ongoing efforts to improve security across VictoriaMetrics Cloud, we have now enabled TLS 1.3 on all our load balancers.
At the same time, support for older TLS versions—TLS 1.0 and 1.1—will be disabled in 3 months. Removing support for these versions helps us ensure a stronger default security posture for all users.
We strongly recommend reviewing your clients, libraries, or exporters to make sure they support TLS 1.2 or 1.3. Most modern tooling already does, so for many of you, this will be a seamless upgrade—but now’s the time to double-check!
TLS 1.0 and 1.1 support will be removed in Q3 2025.
Please upgrade as needed to continue secure access to VictoriaMetrics Cloud.
This change improves both performance and encryption quality, making your metrics even safer in transit.
Docs enhancements
#
As we just mentioned, this quarter we’ve also been putting a lot of effort in improving our documentation. You can read more about the new integrations documentation approach in our latest blog.
Apart from that, feel free to take a look to the newest sections for:
- Exploring data, powered by VMUI and MetricsQL
- Tiers and deployments types answering the second most relevant question in history after the meaning of life: Single or Cluster?
- and, of course, Integrations
What’s Next?
#
There’s a lot happening behind the scenes—and some of it is already making its way into the product!
VictoriaLogs in VictoriaMetrics Cloud
#
Our VictoriaLogs integration is progressing fast, and we’re already rolling out support directly within the Cloud console. If you haven’t tried it yet, check out the playground here.
What’s already available in our staging environments:
- UI support for creating and managing VictoriaLogs deployments
- APIs to automate logs deployment lifecycle
- VLUI integration and logs
- Access Tokens to easily send and read data
As you can see, we are getting closer day by day! But we need your help. We’re shaping this based on real user needs—so if you want to help us cover more use cases, please take a minute to fill out our short survey:
Your feedback makes a big difference!
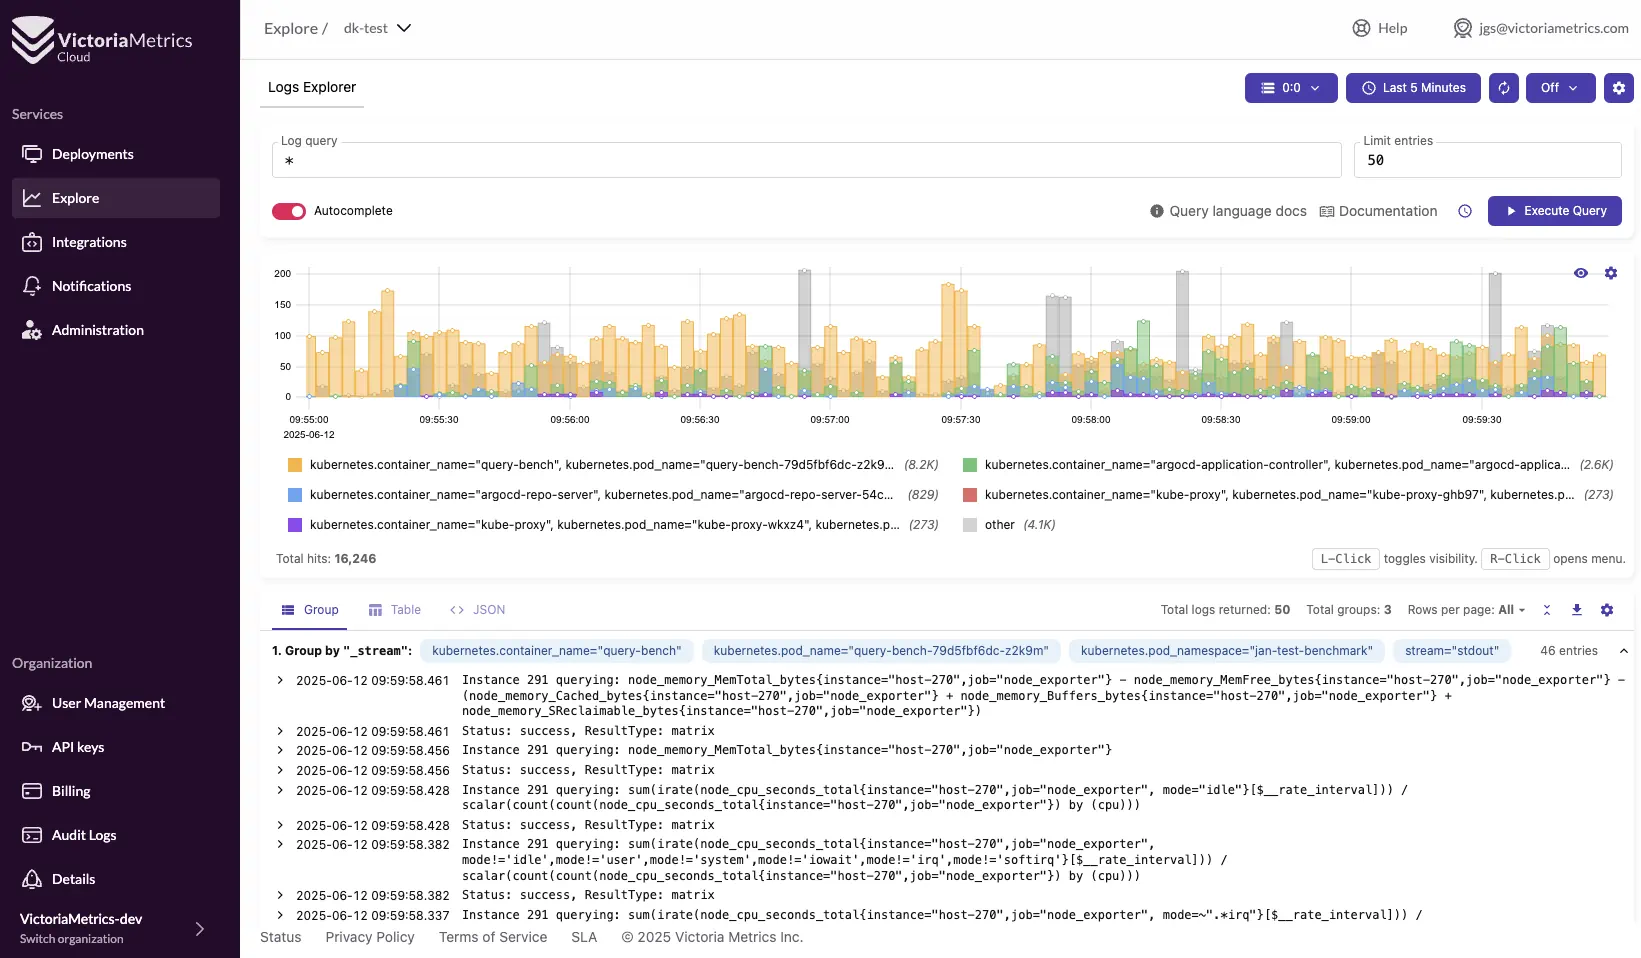 VictoriaLogs in VictoriaMetrics Cloud staging
New Region: Singapore
#
We’re expanding our global presence! A brand-new region in Singapore will be available soon. Stay tuned—it’s going Generally Available in the next few weeks, making VictoriaMetrics Cloud even closer to users in Asia.
…on the Horizon
#
We’re not stopping at metrics and logs. With VictoriaLogs well underway, we’re now building the foundations for distributed tracing support as well. Check out:
This is a huge step toward offering a complete observability suite, natively integrated into VictoriaMetrics Cloud. We can’t wait to show you what’s coming next!
Thanks for reading and for being part of the VictoriaMetrics community. As always, your input helps shape the future of our products.
Want to experience the latest improvements for yourself? Sign up for VictoriaMetrics Cloud and try it today!
Leave a comment below or Contact Us if you have any questions!
comments powered by Disqus