- Blog /
- What's New in VictoriaMetrics Cloud Q1 2026? Logs, MCP Server, Better Alerting, and... a Secret Project
What's New in VictoriaMetrics Cloud Q1 2026? Logs, MCP Server, Better Alerting, and... a Secret Project
Share:


Summary: Q1 2026 brought several major VictoriaMetrics Cloud updates, including the general availability of VictoriaLogs in VictoriaMetrics Cloud, hosted MCP server support, a new observability cost calculator, expanded alerting rule presets, and more flexible webhook notifications. In this recap, we cover how these cloud updates make it easier to manage logs, query metrics with AI assistants, estimate observability costs, configure alerting workflows, and connect alerts to tools like Grafana. We also share infrastructure improvements such as PrivateLink availability in all regions, distributed cluster topology, incremental backups, stronger security controls, and a look ahead at SOC 2 progress, VictoriaTraces in Cloud, easier VPC integration, and future pricing improvements.
Q1 2026 has been one of our most eventful quarters yet for VictoriaMetrics Cloud. We shipped something we have been building towards for a long time, crossed a few infrastructure milestones, and started clearing the path for what is coming next to the most performant observability stack.
The big thing is that VictoriaLogs is now Generally Available in VictoriaMetrics Cloud: fast, cost-effective, fully managed log management, built with the same philosophy as VictoriaMetrics. Beyond that, we made it significantly easier to talk to your metrics through a hosted MCP Server, expanded alerting with a new rules editor and a much longer catalog of presets, notifications via generic webhooks and launched a new product page with a cost calculator that honestly surprised us with what it showed. We also have some infrastructure notes for the engineers in the room, and a secret project we are not ready to name yet.
If you missed our Quarterly Live Update, you can watch the full recording here:
Let’s get into it!
VictoriaLogs in VictoriaMetrics Cloud: Generally Available
#
The big news of this quarter is one we’ve been building for a while: VictoriaLogs is now Generally Available in VictoriaMetrics Cloud.
If you haven’t seen the full announcement post yet, feel free to read more here. But to summarize: VictoriaLogs brings the same philosophy that made VictoriaMetrics popular but, this time, to log management. Performance, cost efficiency, and ease of use. In VictoriaMetrics Cloud, that means you can deploy a fully managed VictoriaLogs instance in seconds, with automated backups, upgrades, and all the operational bits taken care of.
Once your deployment is running, the Explore section gives you everything you need to dig into your logs: visualize log distribution over time, group by streams, and use LogsQL to filter, transform, and aggregate intuitively. The UI helps you along the way with autocomplete and query prettification, while your query history is saved automatically.
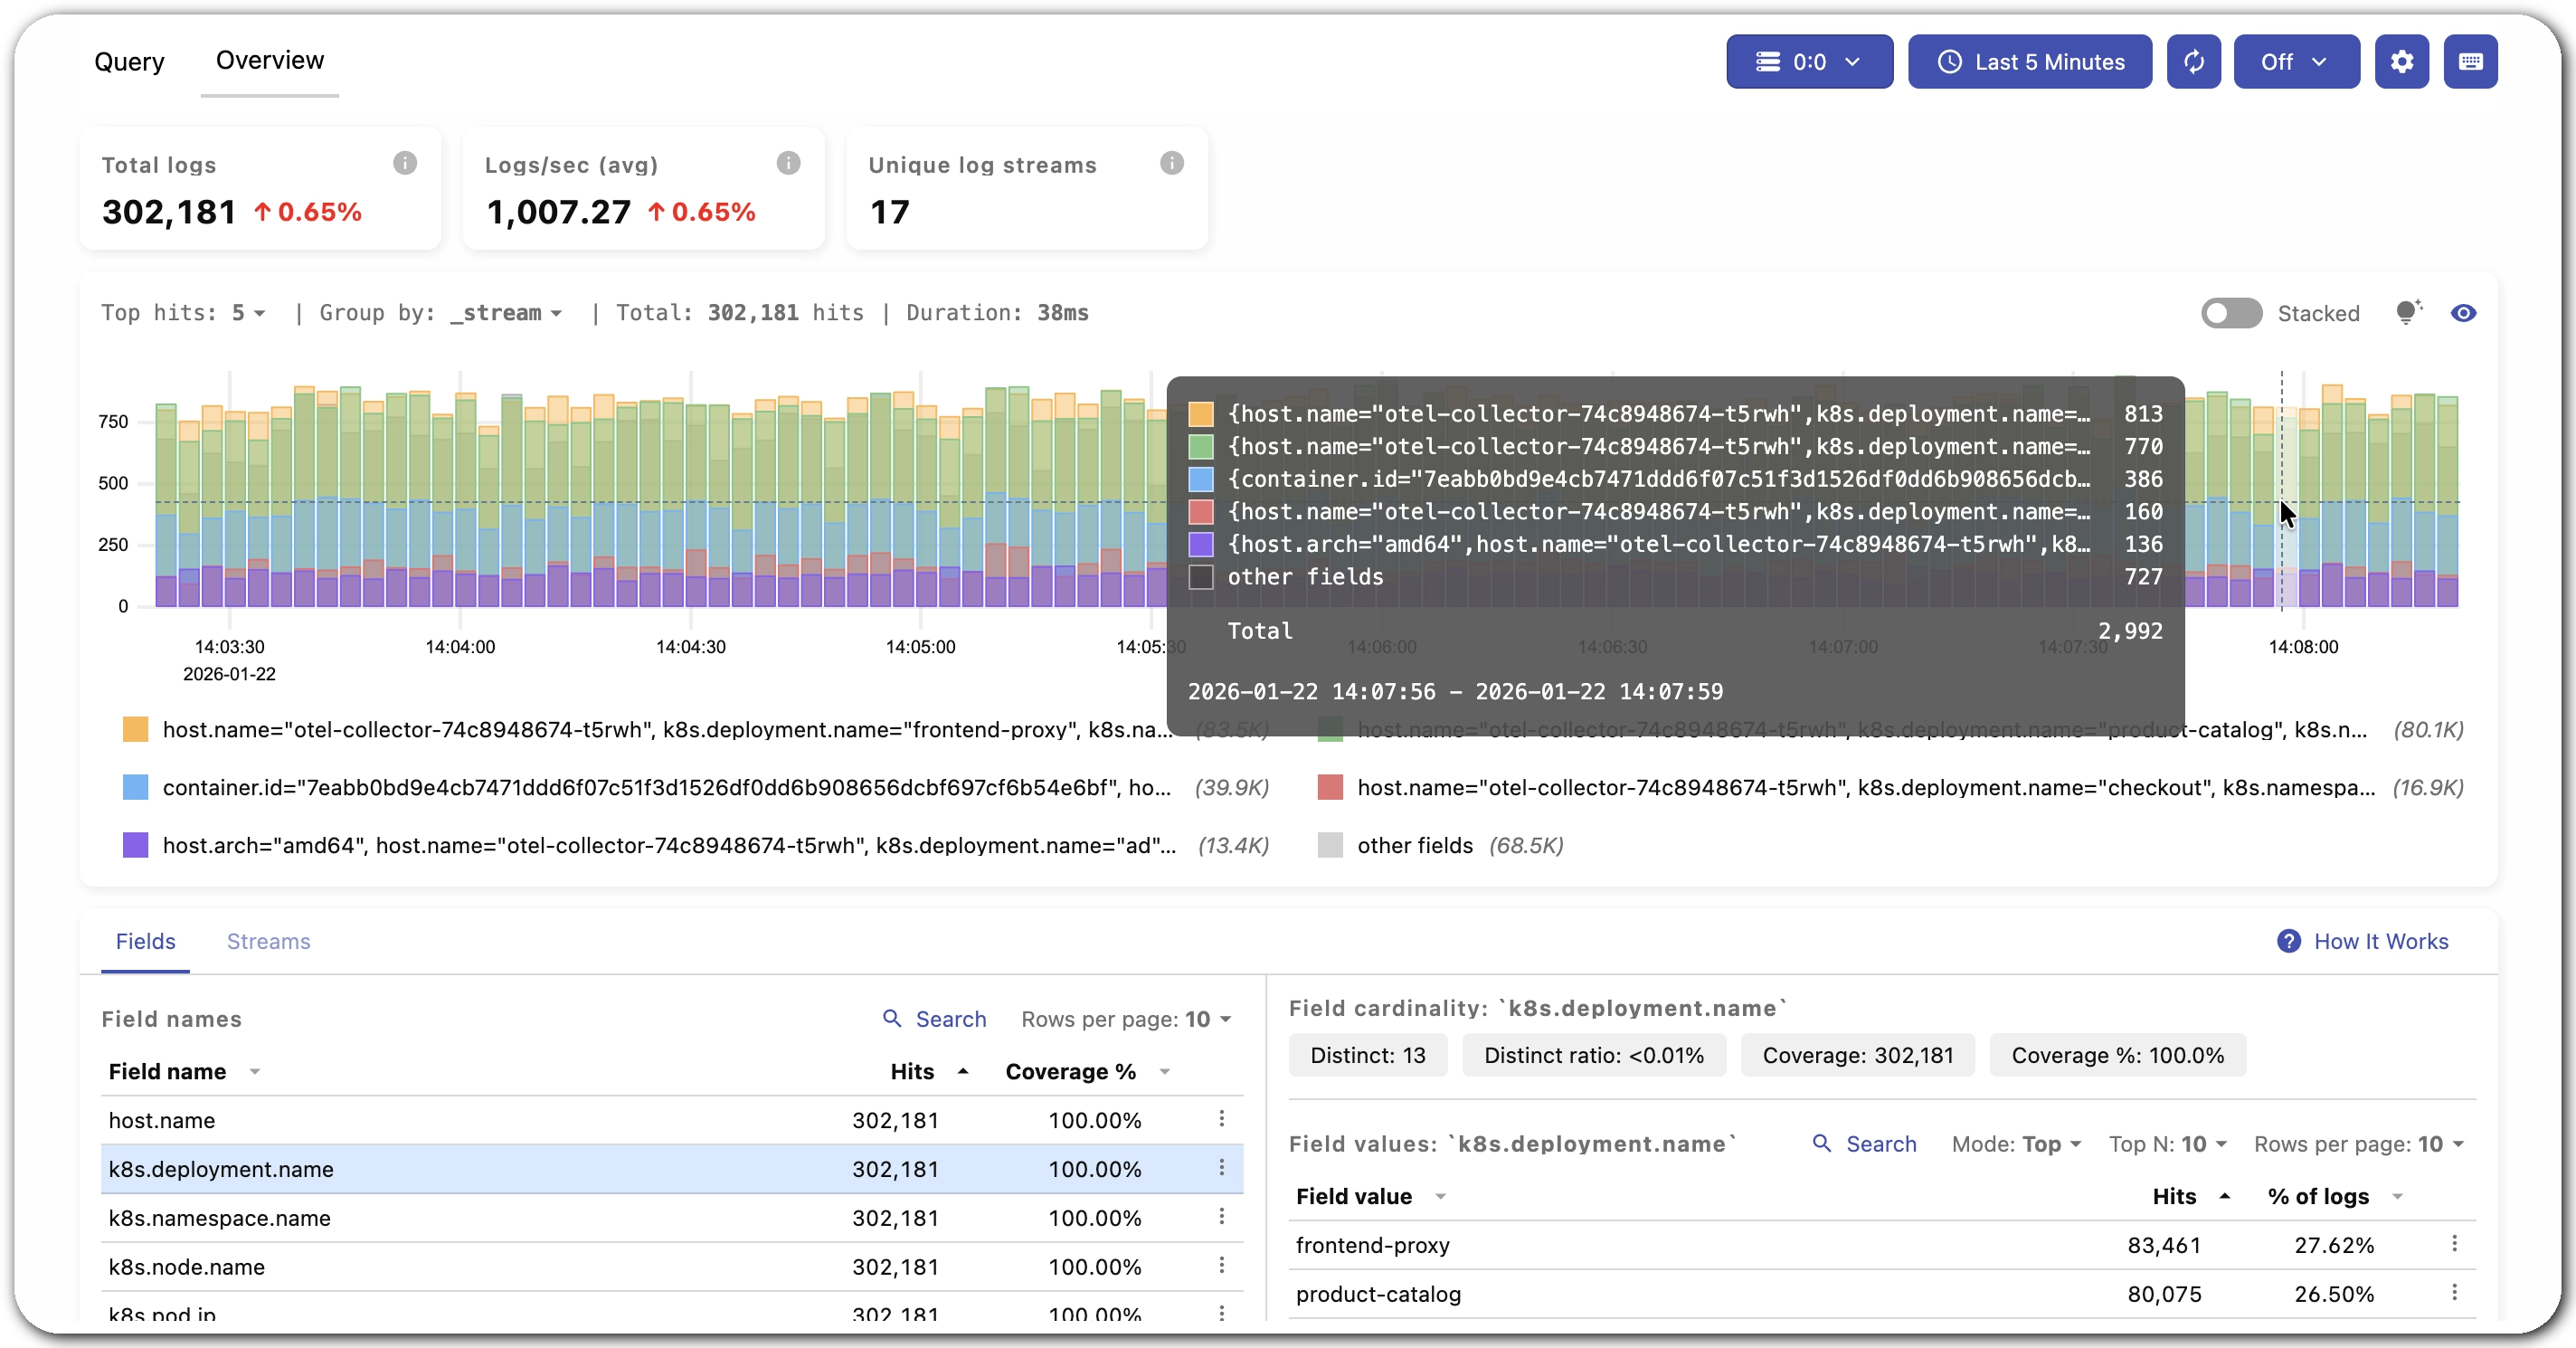 VictoriaLogs Explore view in VictoriaMetrics Cloud
You can sign up for VictoriaMetrics Cloud and try it yourself with a one-month free trial, no credit card required.
Now, let’s talk about a few additions we did in the last weeks since the announcement went out.
Delete Logs
#
One of the practical features we added is the ability to delete logs. This is useful in several real-world situations: removing accidentally ingested sensitive data or cleaning up noisy or malformed log entries. You can find the full details on how this works in the VictoriaLogs documentation.
Of course, always keep in mind that deletion operations may take a significant amount of time, specially when VictoriaLogs contains a very high number of logs. That’s why it isn’t recommended to delete logs on a frequent basis. This is more about those exceptional cases like removal of accidentally written security-sensitive data.
Integrations for VictoriaLogs
#
Integrations, like we described in our integrations post, provide users a quick and easy way to understand how to connect different technologies together.
What are integrations?
The idea is simple: instead of reading through docs to figure out how to put your tools together, you get a step-by-step guide right inside the console.
This now covers VictoriaLogs too. Whether you want to ship logs via OpenTelemetry or visualize them in Grafana or Perses, the integration wizard walks you through it in a few clicks.
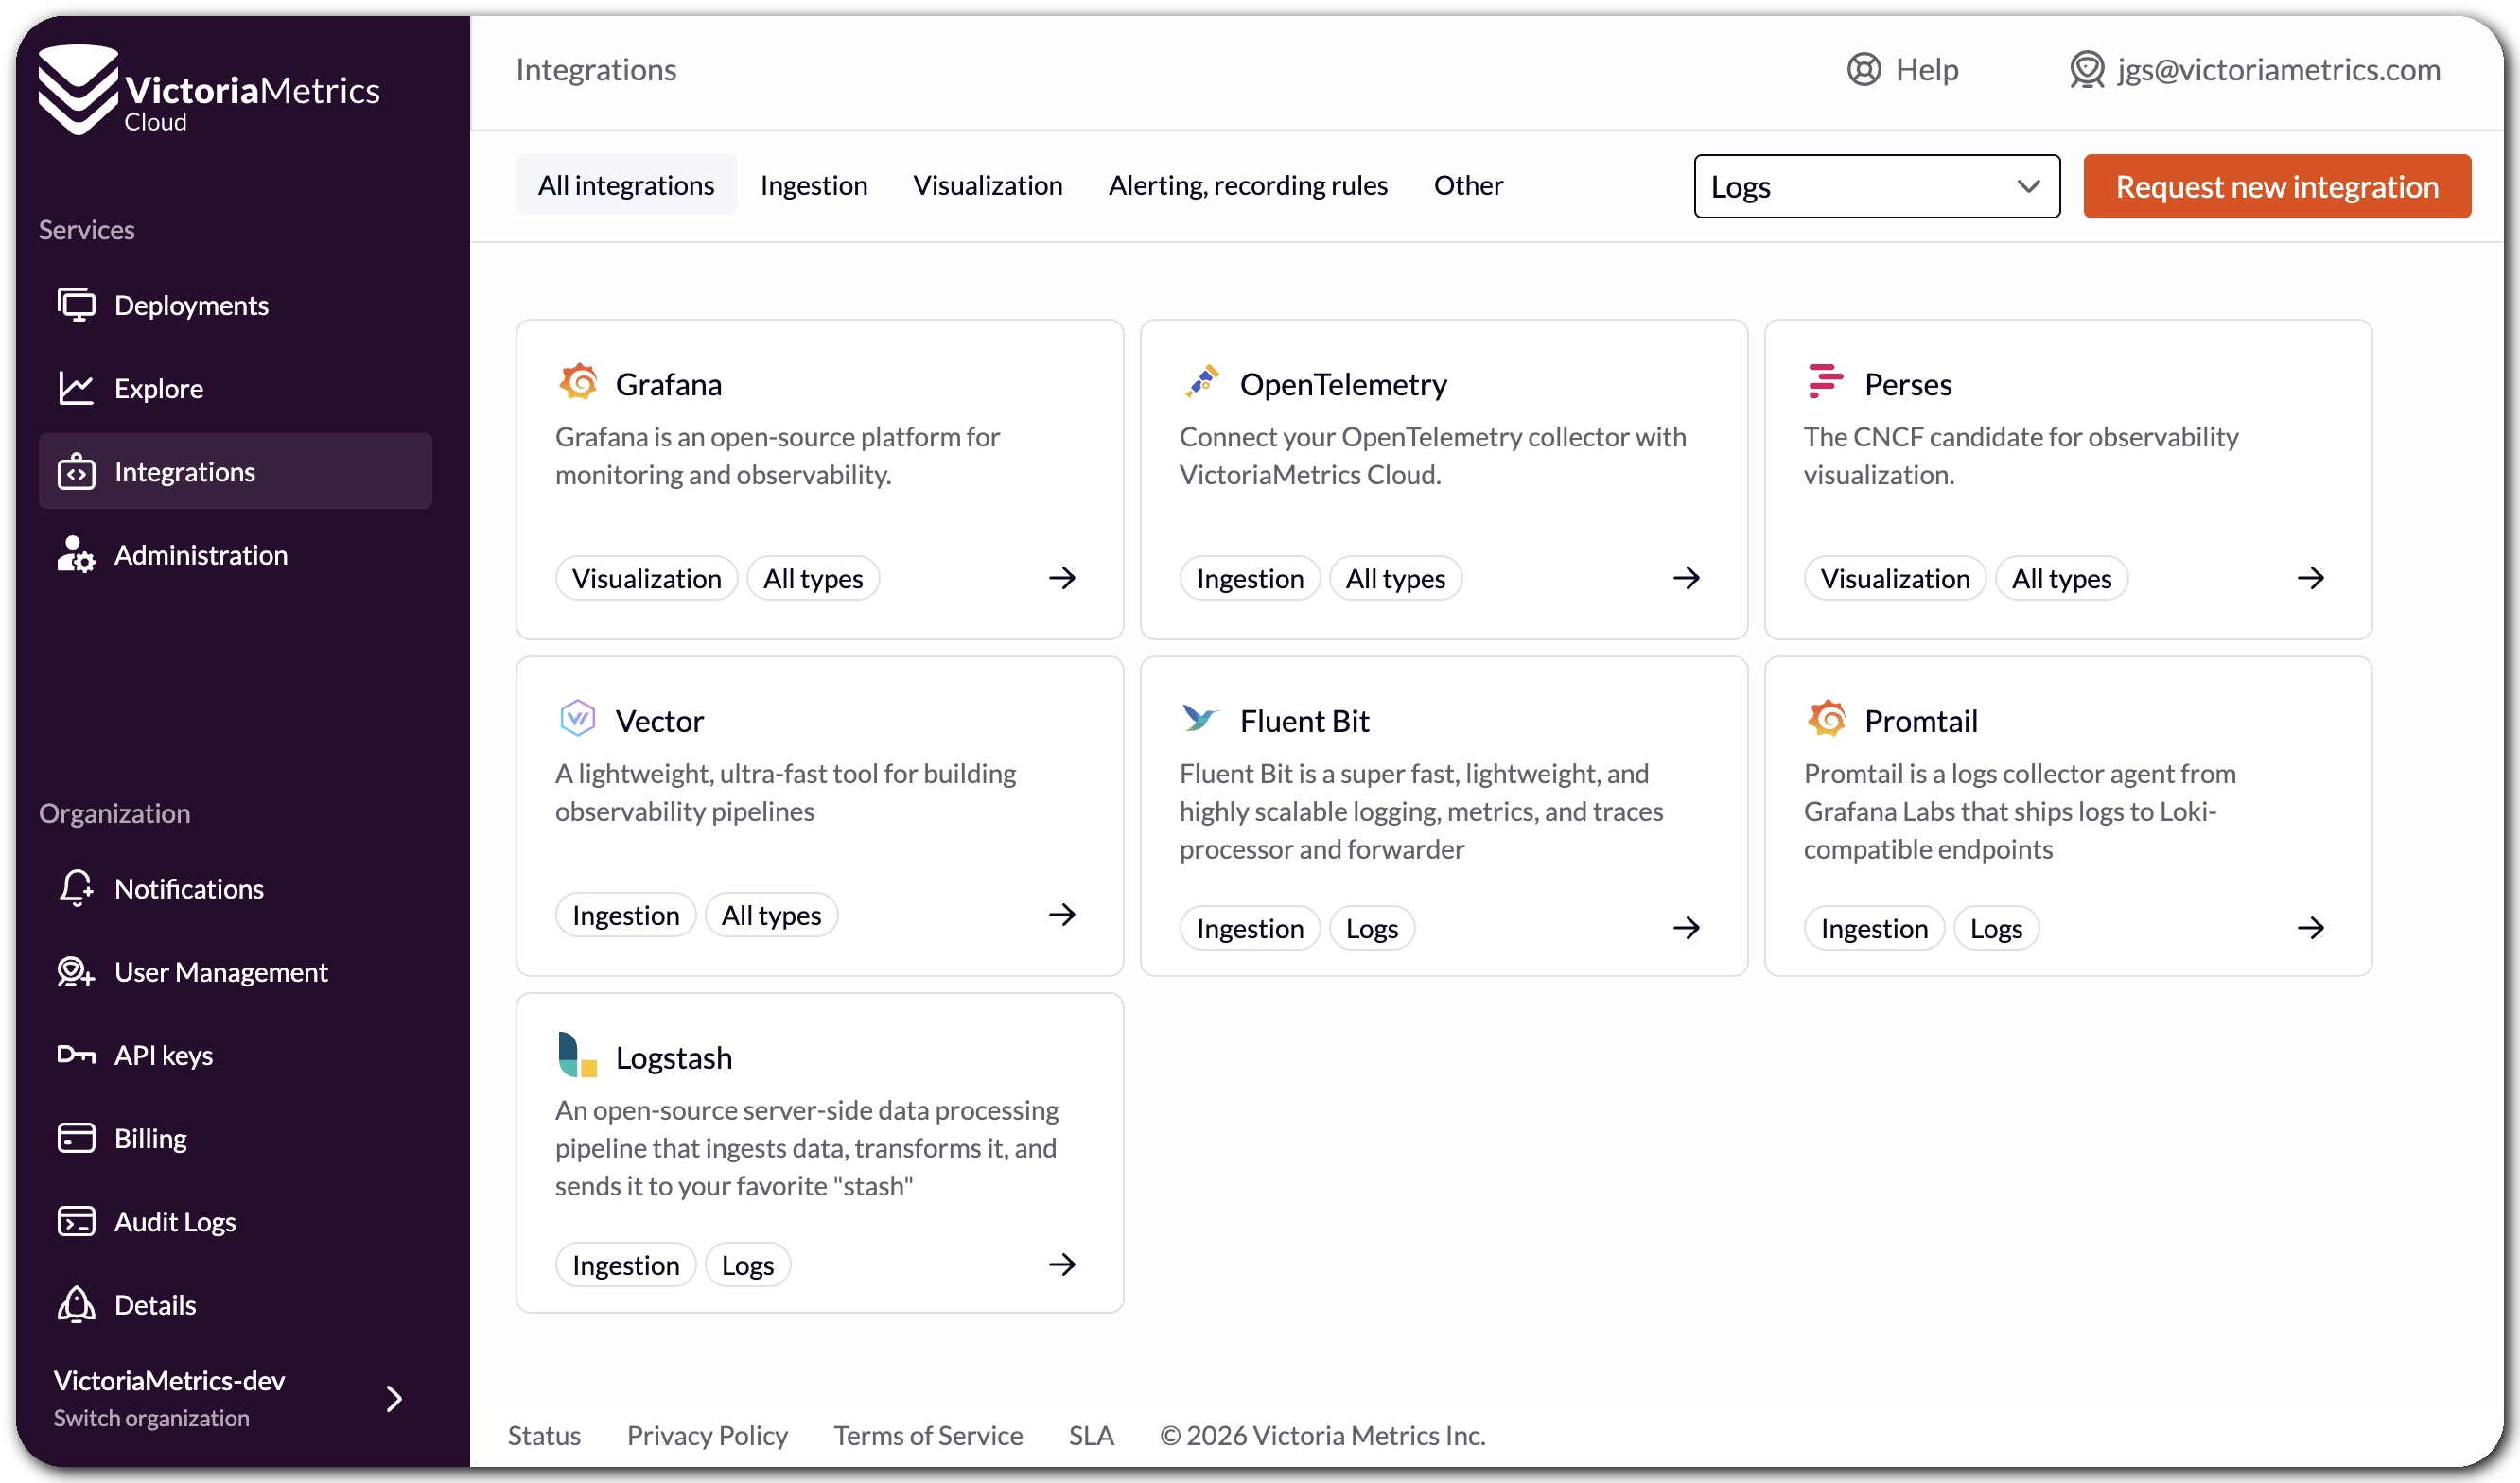 VictoriaLogs integrations in VictoriaMetrics Cloud
Apart from the mentioned OpenTelemetry, Grafana and Perses integrations, VictoriaMetrics Cloud now also includes easy-to-follow guides for sending data via:
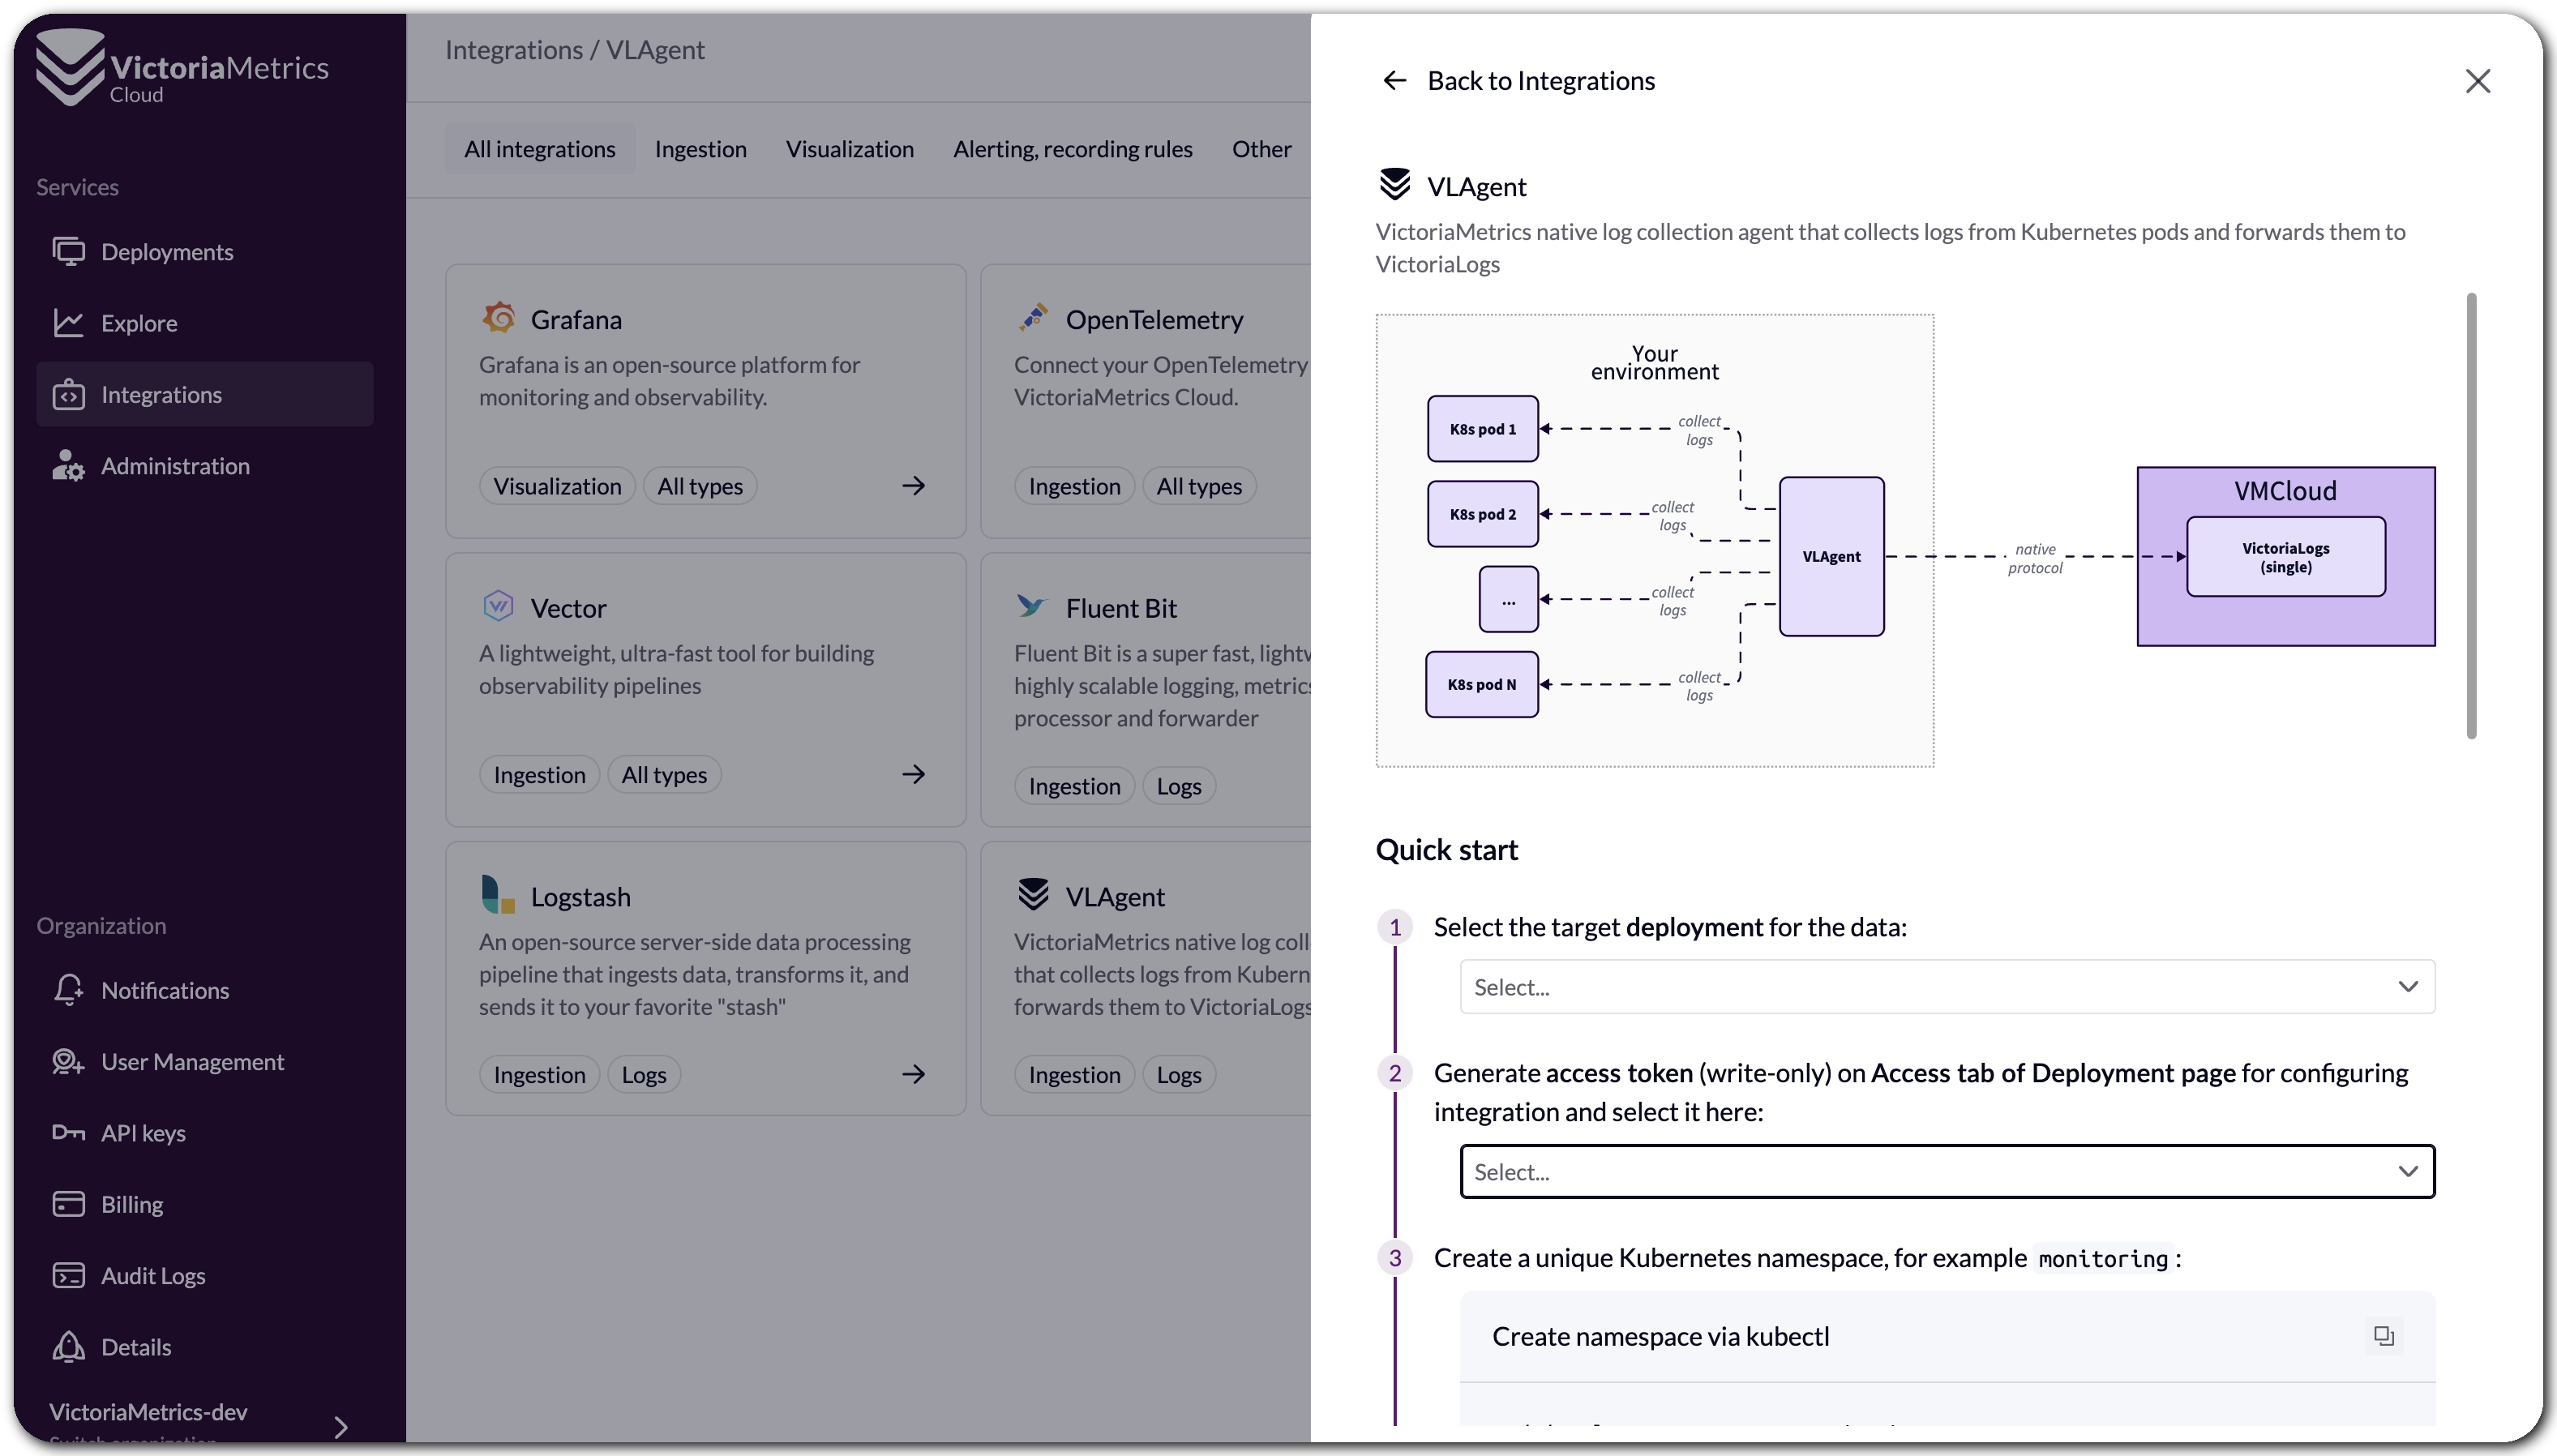 vlagent integration in VictoriaMetrics Cloud
VictoriaLogs deployment support many ways of sending data.
Don’t hesitate to let us know if you need help with these or other agents and formats!
Documentation
#
Maybe not that flashy, but always important: we also made sure that VictoriaLogs is properly documented. All the way from the quick start guide to the deployments section, our docs have you covered to get started with logs, with a clear path to follow for all your cases.
No Setup Required: MCP Server reaches the Cloud
#
Speaking about moving great solutions to VictoriaMetrics Cloud so users don’t need to run them by
themselves… Let’s join what everyone is talking about these days: MCP!
Back in Q2 2025, we introduced the MCP Server integration, which lets you interact with your metrics using natural language through any AI assistant that supports MCP plugins, like Claude Desktop, Cursor, or Visual Studio Code. The feedback was great, but the setup still required you to run the MCP server yourself.
That changes now: we have deployed a hosted MCP Server for VictoriaMetrics Cloud, meaning you no longer need to spin up anything locally or in your own infrastructure. Just grab your Access Token, follow the guide in the console under AI Assistants, and you are talking to your metrics in minutes.
For example, if you’re using Cursor, after adding something like this in your ~/.cursor/mcp.json
file under Settings -> Cursor Settings -> MCP -> Add new global MCP server:
{
  "mcpServers": {
    "victoriametrics": {
      "url": "https://mcp-vm.victoriametrics.cloud/mcp",
      "headers": {
        "X-VM-Cloud-Access": "<YOUR_TOKEN>"
      }
    }
  }
}
you won’t need to fight your way through dashboarding to understand how your services are behaving. In my case, I did this with Claude:
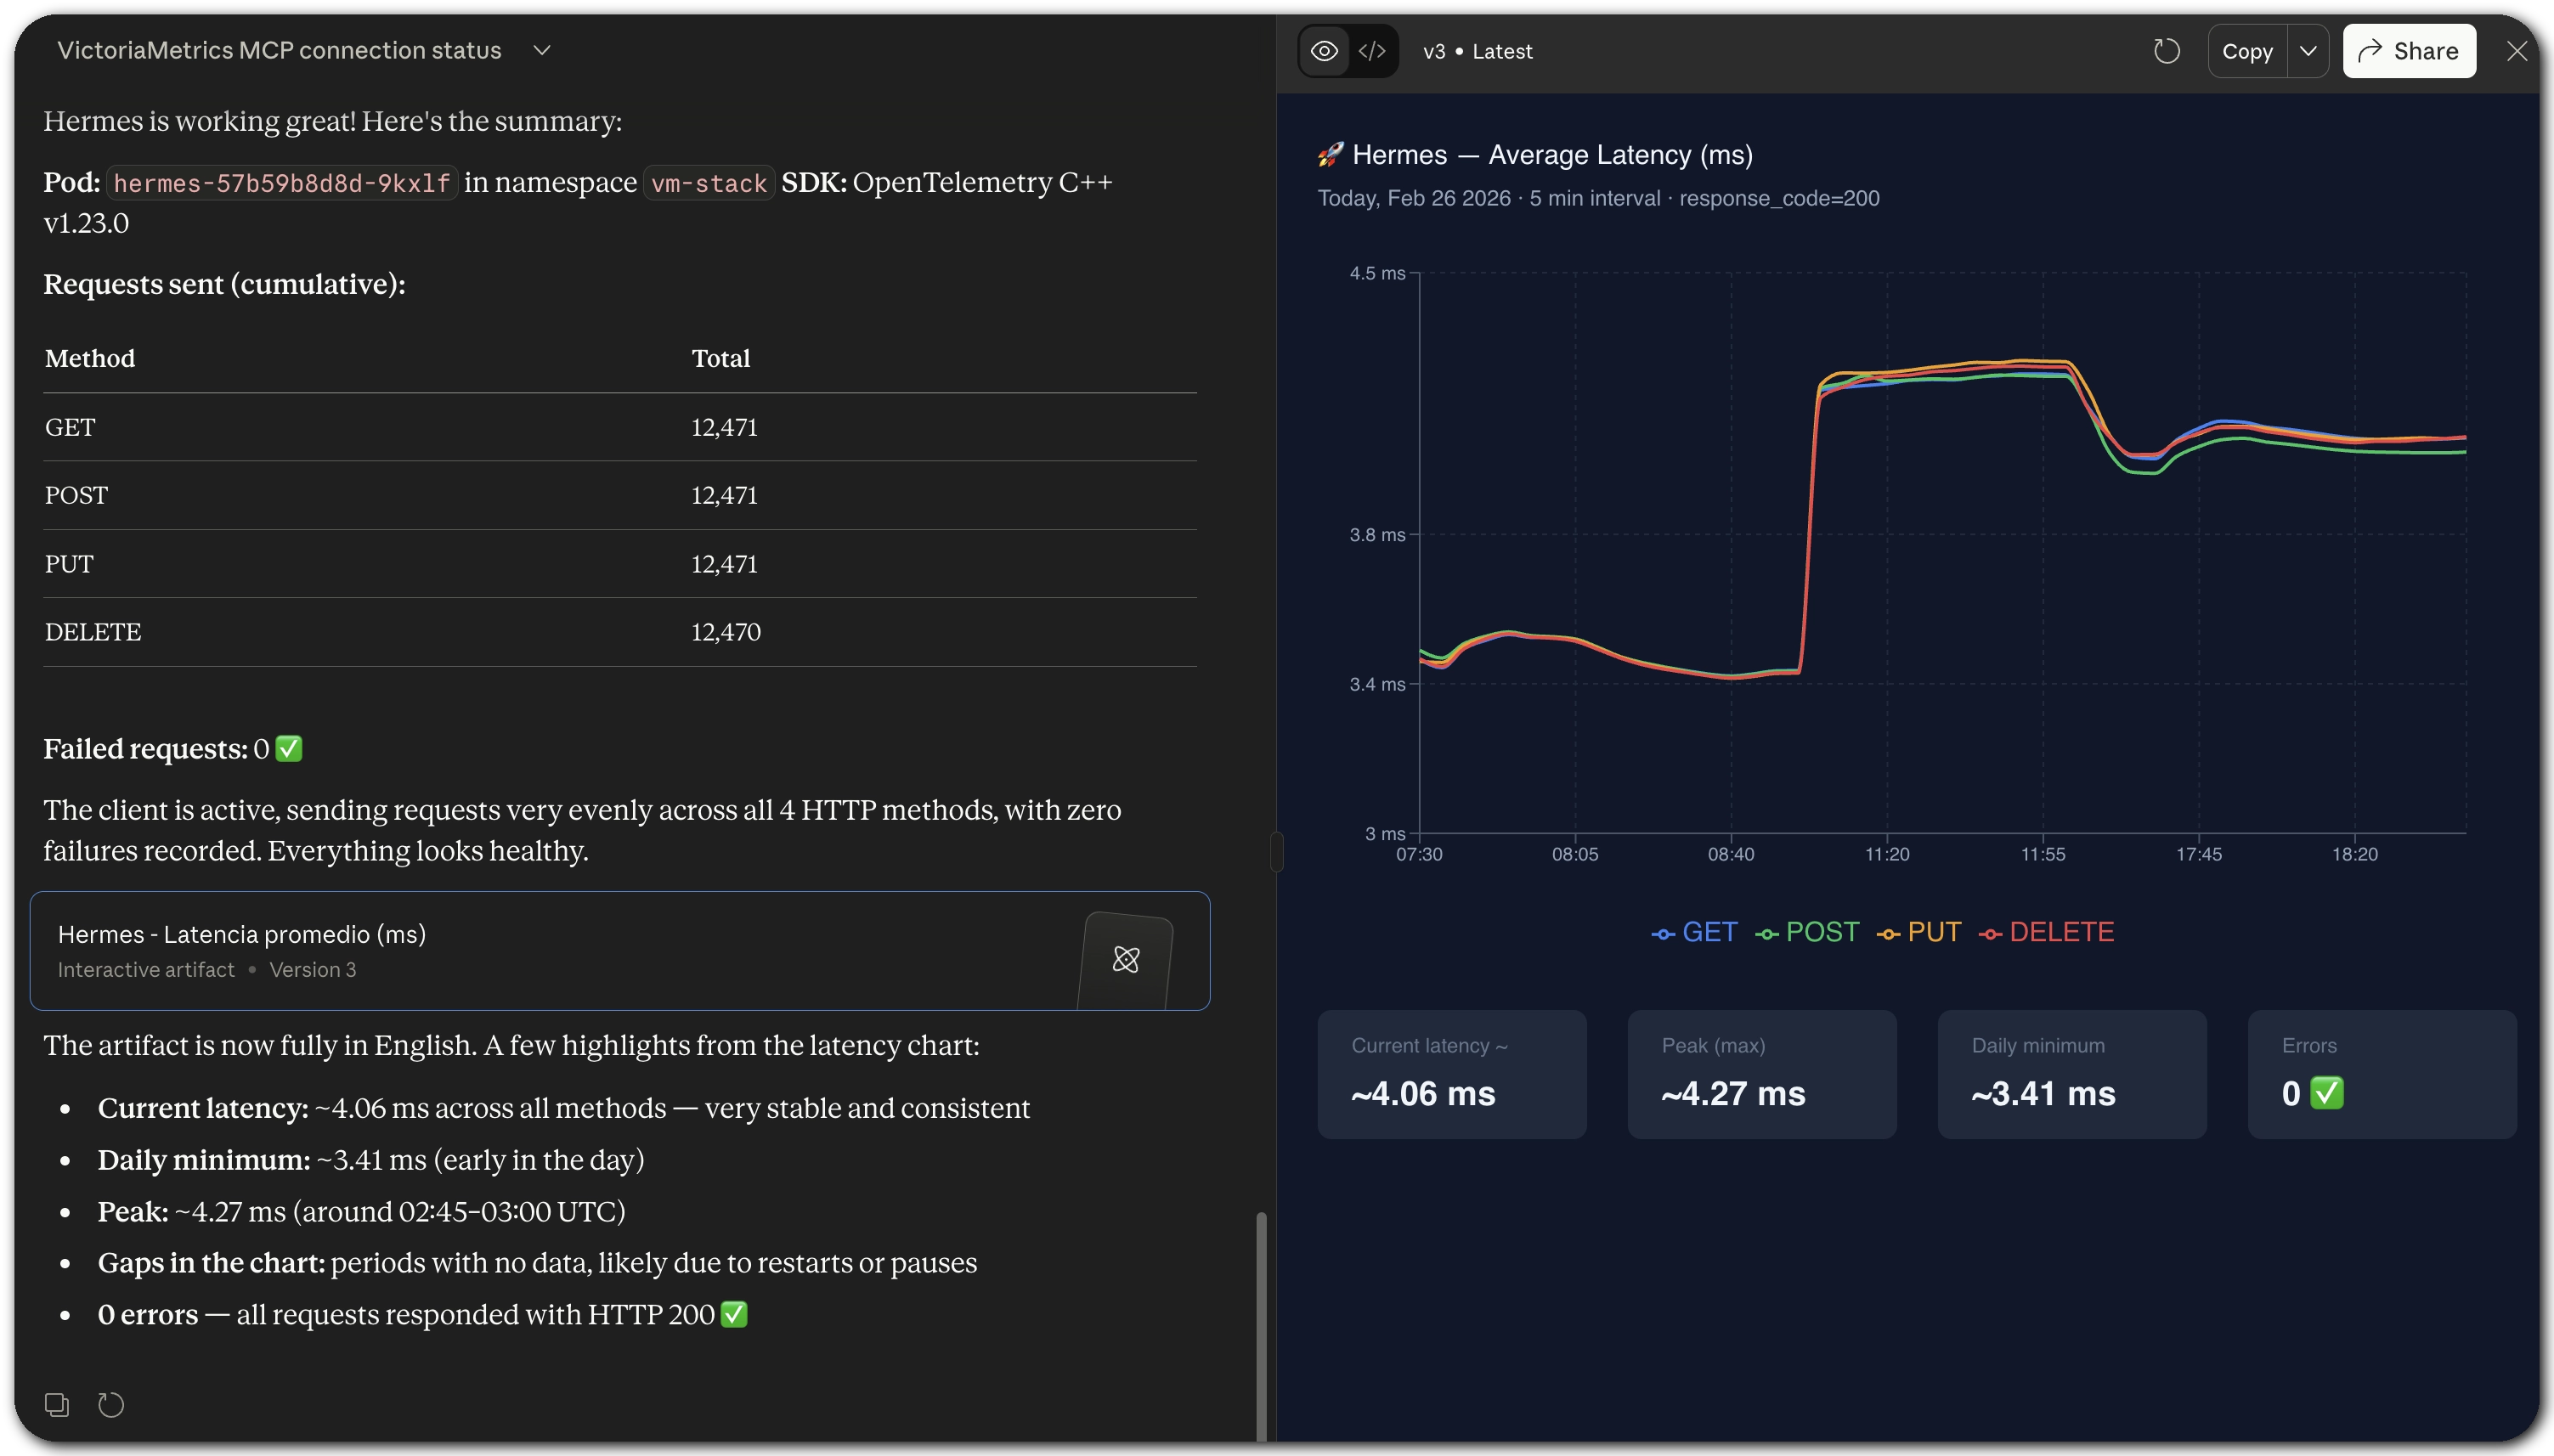 MCP Server interaction example in VictoriaMetrics Cloud
The server is open now to communicate with your token-eater AI assistant and handles querying
metrics, exploring labels and time series, inspecting alerting rules, analyzing cardinality, and
much more. Everything you could do from VMUI,
now available through natural language. You can find the full list of supported capabilities in the
mcp-victoriametrics repository.
We are also working on bringing the same hosted experience to VictoriaLogs, so you will soon be able to ask questions about your logs the same way. Stay tuned!
New Product Portal: Come for Performance, Stay to Save
#
We have launched a new VictoriaMetrics Cloud product page, and it provides essential information to help new users make informed decisions to get started with VictoriaMetrics Cloud. FAQs, integrations, deployment options, and a proper breakdown of what makes VictoriaMetrics Cloud different. We noticed that a lot of people come to VictoriaMetrics for the performance, which is what we live for. But once we started comparing, we realized cost-effectiveness is breathtaking. The new page tries to tell that full story.
So we added a new Cost Calculator.
 VictoriaMetrics Cloud Cost Calculator
How We Built It (and Why It Was Harder Than It Looks)
#
The calculator is built on top of the benchmarks we published last quarter as part of the new Capacity Tiers, with the full numbers available in the tier documentation. Those benchmarks gave us a solid, reproducible foundation to compare against.
Getting comparable numbers from other vendors was a different story. Pricing pages are VERY hard to write, leading to some incompleteness. Apart from that, reading costs vary enormously depending on query patterns, and some vendors simply do not publish enough detail to make a fair comparison.
That is why the calculator compares the benchmarks we did with the same parameters for other solutions.
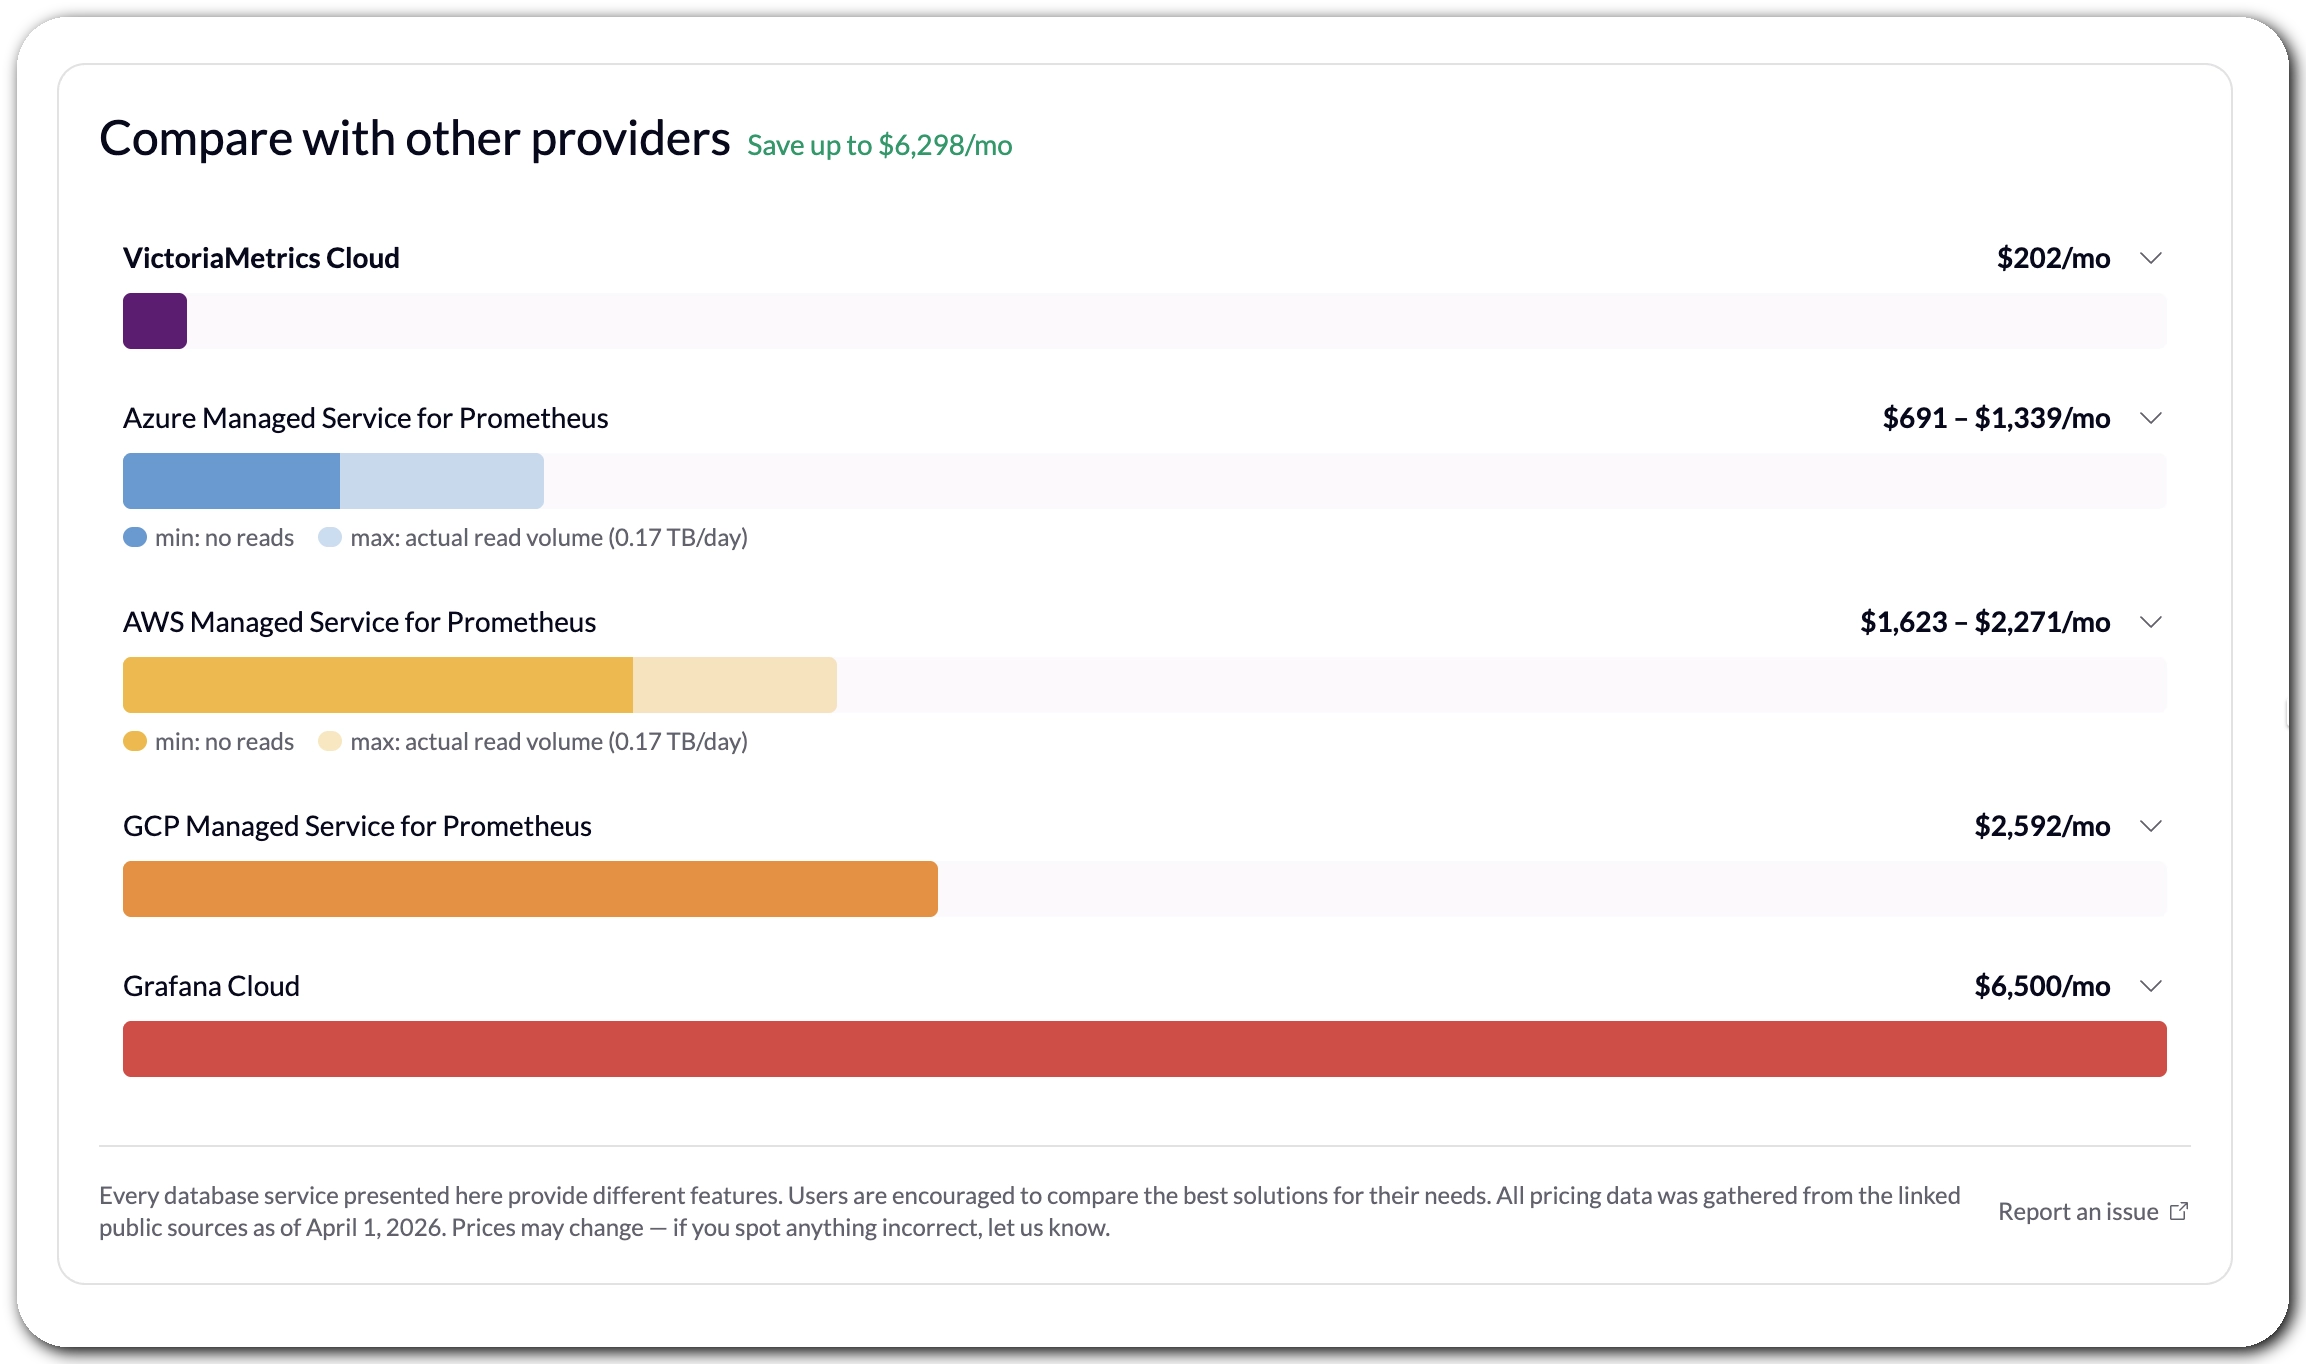 VictoriaMetrics Cloud Cost Comparison
One thing worth noting upfront: every observability platform covered in the comparison offers a different set of features, SLAs, and trade-offs. This calculator is not meant to be the final word on which tool is right for your use case. It is meant to help you understand the order of magnitude difference in cost, so you can go into evaluations with better context.
What the Numbers Show
#
The results, honestly, surprised even us. For VictoriaMetrics Single-Node deployments, the savings start at up to $6,000 per month on the smallest tier, and grow significantly from there at higher scales. This is also why we consistently recommend Single-Node as the starting point for most users: it is simpler to operate and, as it turns out, remarkably cost-efficient.
VictoriaMetrics Cluster is a different story. It may be the right choice at scale, but it is also more expensive, and we do not yet have the same depth of benchmarks for it. We did not want to include numbers we could not stand behind, so Cluster comparisons are not part of the calculator yet. That may come.
In the meantime, if you want to see the actual numbers for your workload, the calculator is live on the product page. And if you want to go deeper, sign up for a free trial and see for yourself, no credit card required.
More Transparency for Limits and Usage for Access Tokens
#
If you’ve used VictoriaMetrics Cloud for a while, you’ve likely worked with both Access Tokens and API Keys, and maybe wondered what exactly the difference is. Here’s the short version:
Access Tokensare used for token-based authentication to allow an application to access the VictoriaMetrics API, scoped to a specific deployment, with read, write, or read/write permissions.API Keys, on the other hand, are used to authenticate against the VictoriaMetrics Cloud API itself, for managing your account and deployments programmatically.
You can read more about Access Tokens in the documentation.
The existing functionality already provided a solid foundation: creating tokens with granular permissions, guided integration examples, and metadata like the token owner and when it was last used. This last bit is especially handy for auditing stale tokens or spotting over-utilized credentials.
This quarter, we’ve added a status overview at the top of the Access Tokens section, so you can
now see at a glance how many tokens you have, how many are in use, and how many slots remain within
your plan’s limits.
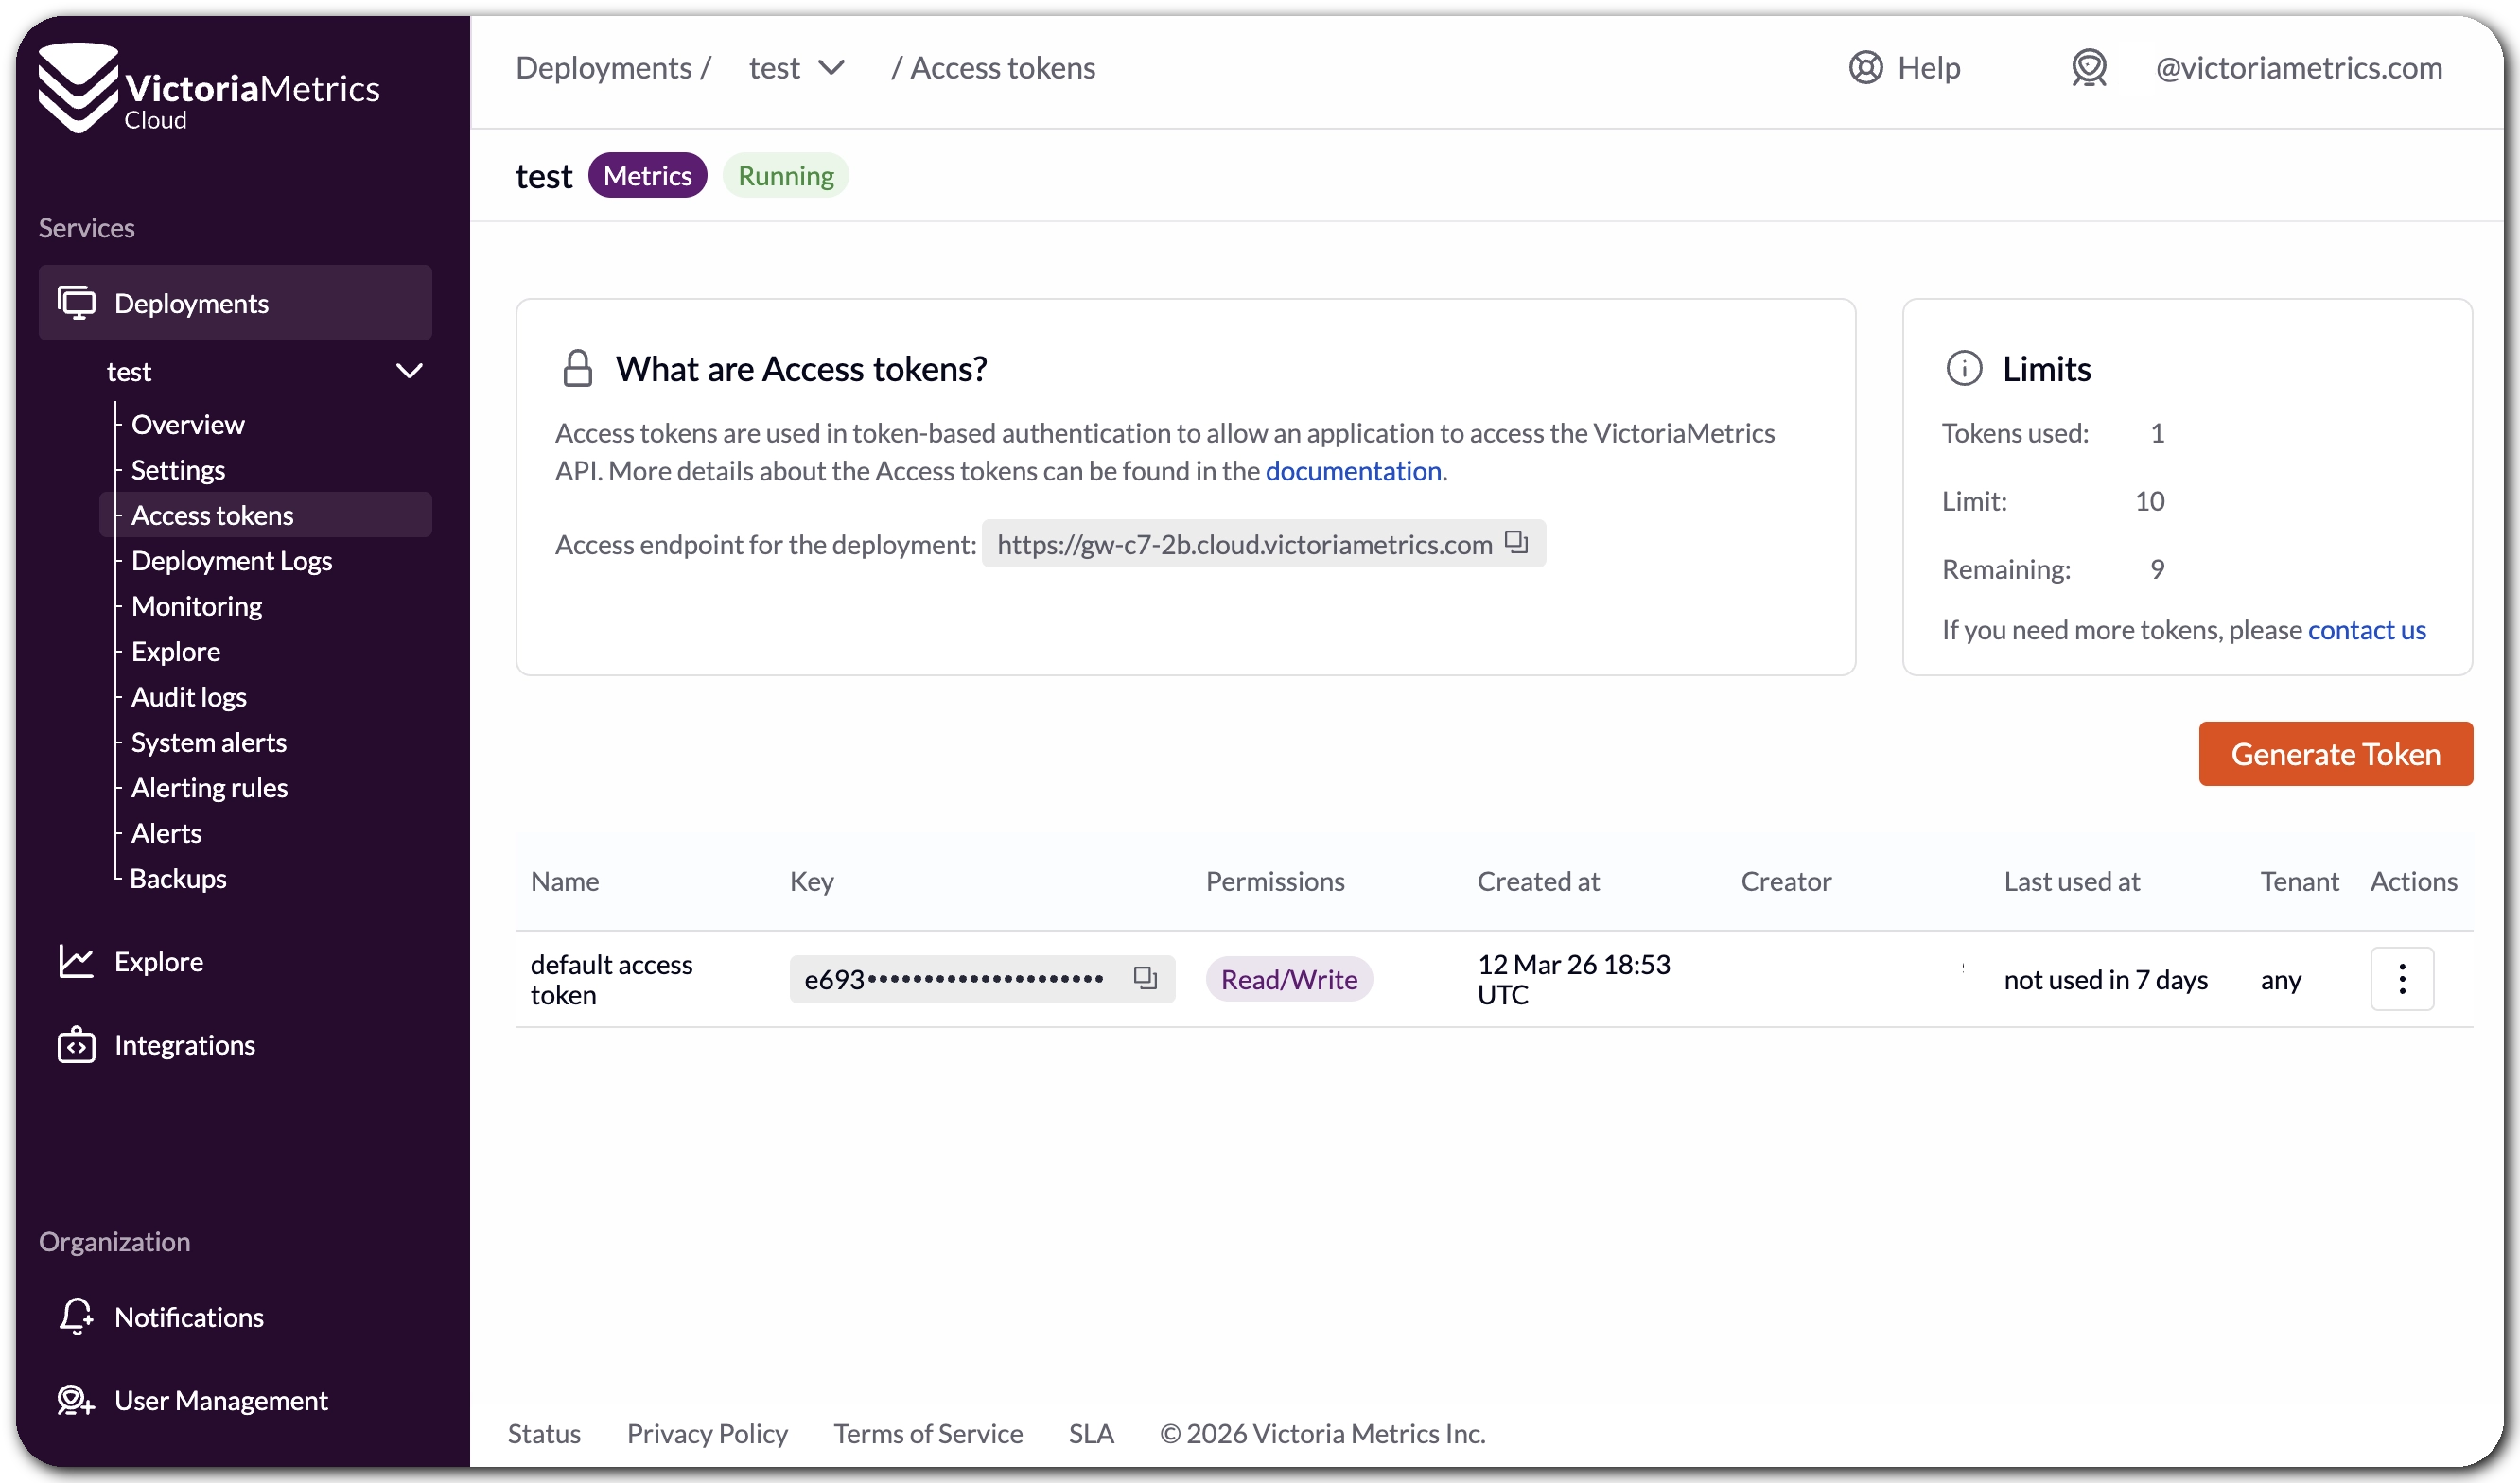 Access Token limits and usage overview
If you’re approaching your token limit and need more, there’s a direct link to contact us right from that view, so you’re never left alone for next steps.
We believe this small addition removes a surprisingly common source of confusion when managing tokens across teams and deployments.
Alert! New Rules Editor and New Presets
#
We have been investing heavily in how alerting works in VictoriaMetrics Cloud, and there is something bigger in the works that we are not quite ready to announce yet. But while that cooks, we shipped several meaningful improvements this quarter that are worth talking about.
Presets Now Live in Your Deployment
#
Previously, alerting and recording rule presets were available through the Integrations section, which meant a bit of back-and-forth when setting things up for a specific deployment. They are now accessible directly from the Alerting Rules menu inside each deployment, so you can browse, pick, and apply presets right where you need them, without losing context.
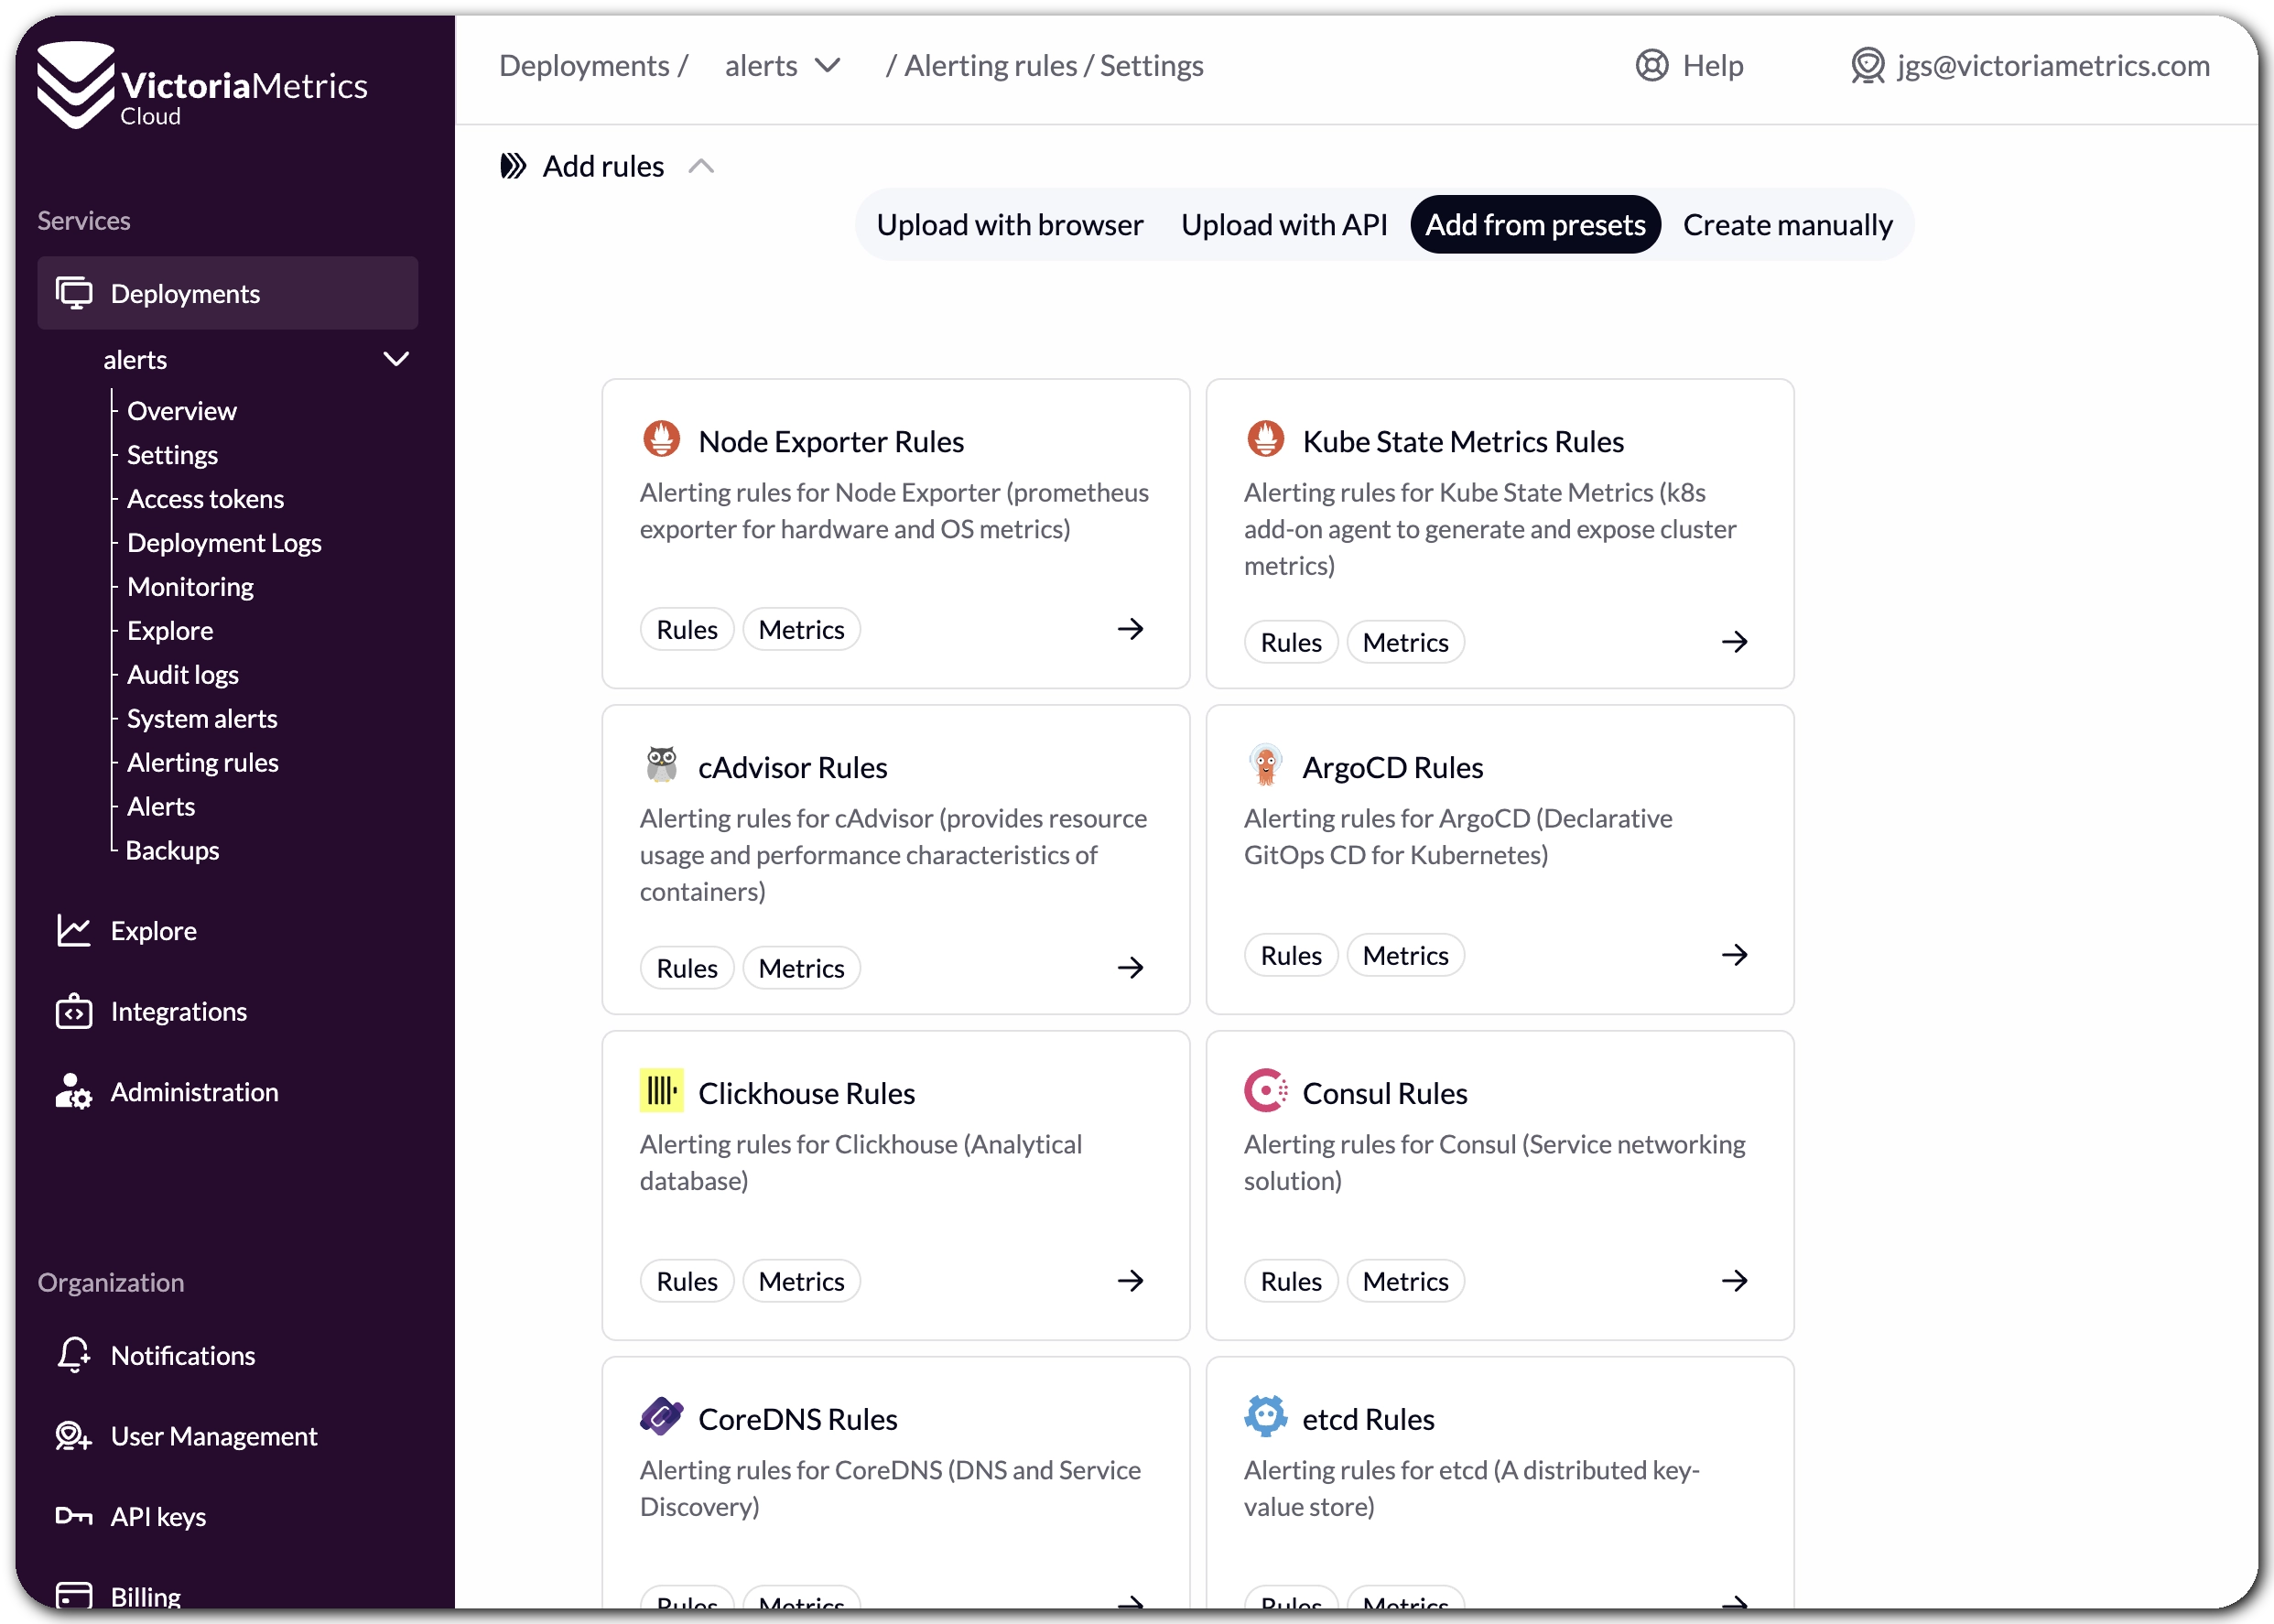 Alerting rule presets inside the deployment section
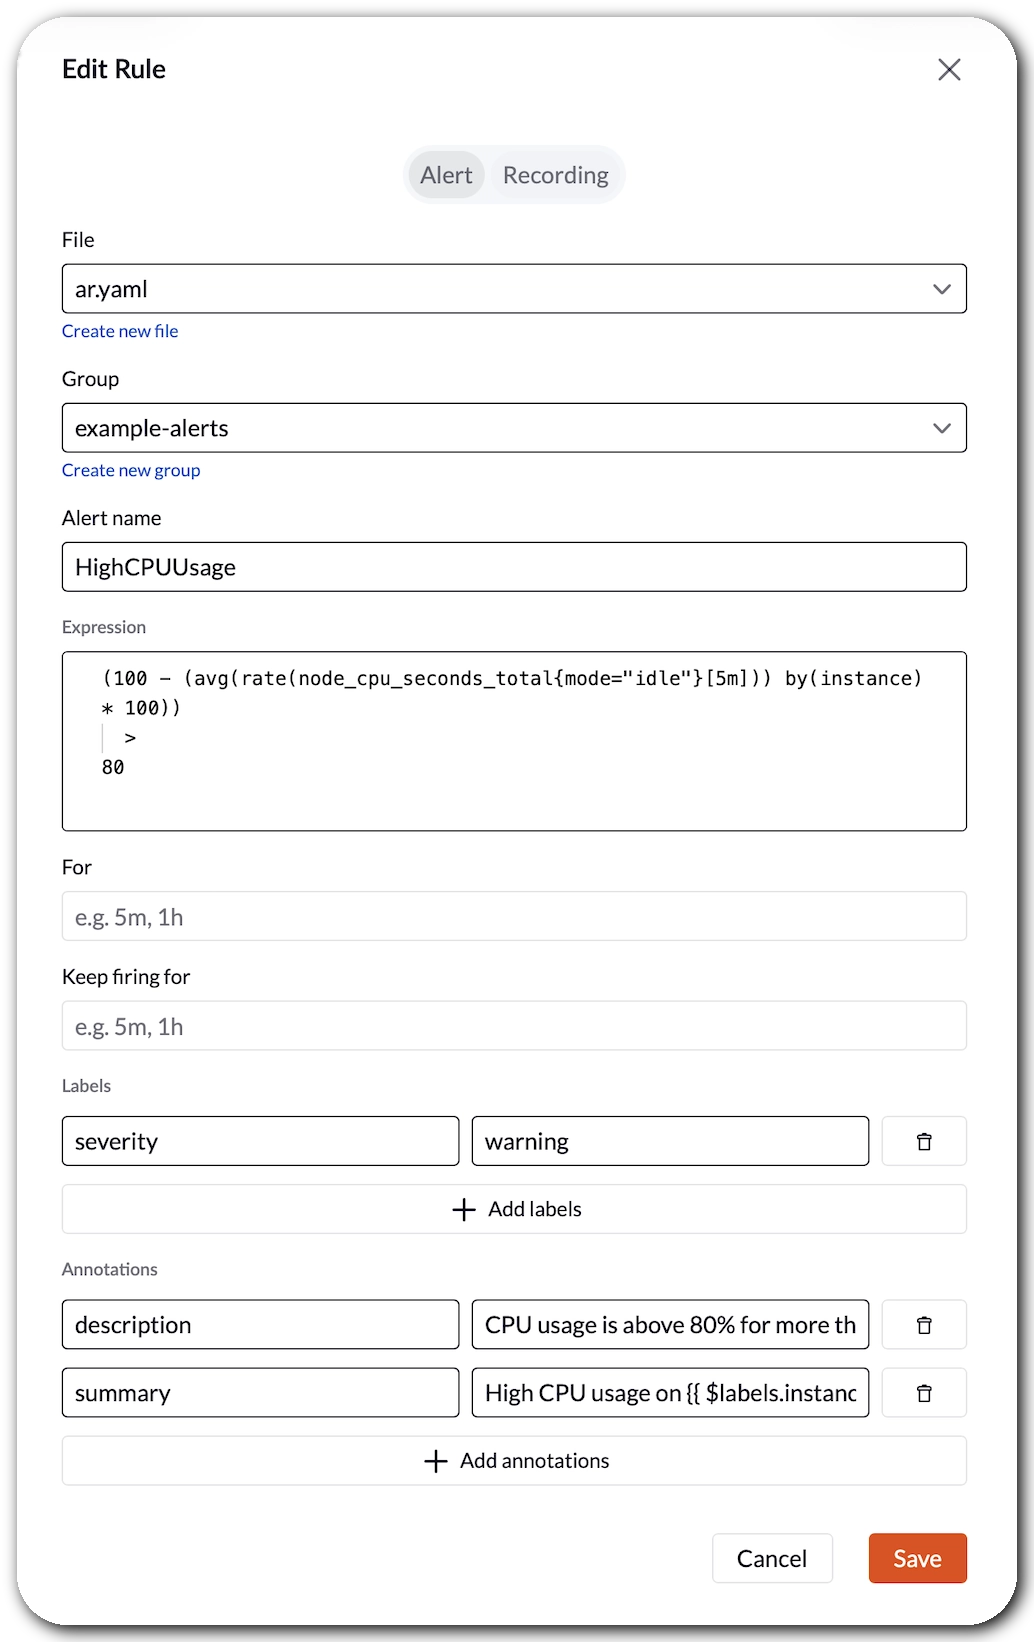
Create, Edit and Delete Rules via UI
#
You can now create, update, and delete alerting and recording rules manually through a new wizard in the UI. If you have ever tried to hand-write Prometheus rule YAML, you know it can get painful. This wizard does not solve every edge case yet, but it is a meaningful first step towards making rule management accessible without requiring you to leave the console or touch a config file. We know there is more work to do here, and we genuinely want your feedback on what to improve next.
Universal alert integration via webhooks
#
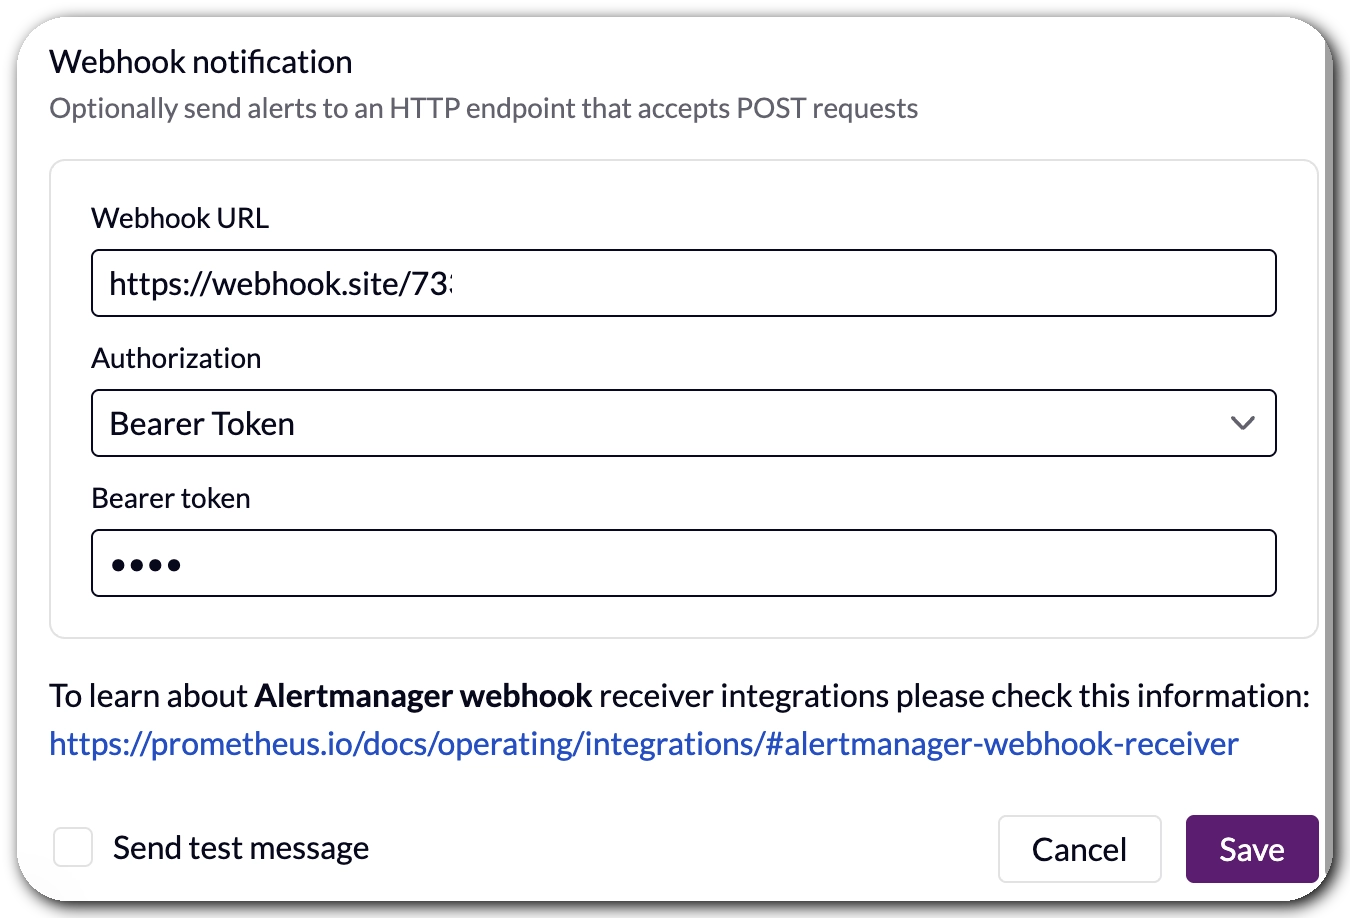
We have also expanded notification options for System alerts beyond email and Slack with support for generic
webhooks. If your alerting pipeline ends in anything that accepts an HTTP POST request, you can
now plug it in directly by adding the webhook URL. Simple and flexible. Learn more about
notifications in the documentation.
This makes it easy to route System alerts to Grafana,
for example.
A Much Longer List of Presets
#
We have also expanded the preset catalog significantly. On top of the Node Exporter, Kube State Metrics, and cAdvisor presets we launched in Q2 2025, the full list now includes rules for:
Prometheus, Thanos, Cilium, HAProxy, Traefik, Mimir, Envoy, Loki, Tempo, Cortex, Vault, MinIO, Jaeger, Linkerd, cert-manager, Alloy, Promtail, Nomad, Caddy, Spinnaker, JVM apps, Go apps, and Python apps.
All of the above are powered by Awesome Prometheus Alerts, an excellent open-source project by samber that has become a go-to reference for production alerting rules in the Prometheus ecosystem. The community behind it has done the hard work of curating, testing, and maintaining these rules across dozens of technologies. We are proud to build on top of their effort and bring it directly into the VictoriaMetrics Cloud console with just a few clicks.
Engineering and Infrastructure Notes
#
Not everything worth sharing is a new UI feature. Here’s a summary of the infrastructure and engineering work that happened this quarter, for those who like to know what’s running under the hood.
After all… VictoriaMetrics is Made by Engineers for Engineers TM
PrivateLink Now Available in All Regions
#
AWS PrivateLink is now available in our Frankfurt region, completing the rollout across all VictoriaMetrics Cloud regions. If you are not familiar with it, PrivateLink lets you connect to VictoriaMetrics Cloud over a private AWS network connection, without traffic ever traversing the public internet. This is a common requirement for security-conscious teams and regulated environments.
As a reminder: if you need a region we don’t cover yet, let us know. We are also planning to improve the setup process next quarter, making it more automatic to configure via VPC endpoints.
We Tested Graviton (and Decided Against It, for Now…)
#
We ran a thorough evaluation of migrating to AWS Graviton instances, with cost reduction as the main motivation. The results were interesting: Graviton delivered the performance gains we expected, but the instance pricing offset those gains almost entirely, making the switch hard to justify at this point. We will keep an eye on this as the landscape evolves, since our goal is always to pass savings on to our users wherever possible.
Cluster Migration to the Distributed Topology
#
All VictoriaMetrics clusters have now been migrated to the distributed version, which runs a blue-green topology. In practice, this means deployments are significantly more resilient to rolling updates and infrastructure changes: one side stays live while the other is updated, with no downtime. This was a meaningful operational improvement that makes our clusters more robust day to day.
Incremental Backups
#
We have changed how backups work across all deployments, moving from full to incremental backups. Instead of snapshotting everything on every cycle, we now only store what has changed since the last backup. This reduces the data we move and store on every run. We are monitoring the cost impact over the coming months and, if the numbers look as good as we expect, it will feed directly into future pricing improvements.
Other Updates
#
- Alert emails now lead with status. Firing or resolved, you will know before you even open the email. No more heart attacks from a subject line that buries the important info.
- Stronger password requirements. We have tightened our password policy as part of our ongoing security hardening efforts. Nothing dramatic to do on your end, but worth knowing.
- Proof of Concepts are working really well. A huge thank you to everyone who has gone through a guided Cluster PoC with us this quarter. The feedback has been fantastic, and it is proving to be one of the best ways to onboard teams properly and make sure the setup actually fits your workload. If you haven’t requested yours yet, you can do so at victoriametrics.com/products/cloud/.
- Documentation improvements. We have expanded the billing docs and added clearer instructions for upgrading and downgrading instances, two areas where we know people have had questions.
- Various bug fixes across the console.
What’s Next?
#
On the security and compliance front, we have been pushing hard towards SOC 2 certification and we are getting very close. Final stretch. We are also continuing to simplify how you connect VictoriaMetrics Cloud to your private infrastructure, with easier VPC integration as a follow-up to the PrivateLink work this quarter.
The observability stack is also getting bigger. We are starting work on VictoriaTraces in VictoriaMetrics Cloud, bringing distributed tracing as the final pillar alongside metrics and logs. We are also working on a secret project that, in hindsight, we obviously could not miss. Leave your guesses in the comments!
On the platform side, we are rethinking how Cluster deployments are sized and priced, moving towards a compute-based model where you use resources however fits your workload rather than being bound to limits on active time series or ingestion rate. This comes together with better visibility into compute consumption in the console, so scaling decisions become obvious. We are also improving billing with transparent credits tracking, so you can see your balance, consumption, and order more directly from the console.
As always, thanks for being part of the VictoriaMetrics community. Your feedback, bug reports, and feature requests are what keep us moving in the right direction.
Ready to try everything we shipped this quarter? Sign up for VictoriaMetrics Cloud and get your first month free, no credit card required!
Frequently Asked Questions
#
What are the biggest VictoriaMetrics Cloud updates from Q1 2026? The biggest VictoriaMetrics Cloud updates from Q1 2026 include the general availability of VictoriaLogs in VictoriaMetrics Cloud, a hosted MCP Server for querying metrics with AI assistants, a new observability cost calculator, improved alerting rule presets, a new alerting rule editor, generic webhook notifications, expanded access token visibility, and several infrastructure improvements.
What is VictoriaLogs in VictoriaMetrics Cloud? VictoriaLogs in VictoriaMetrics Cloud is a fully managed log management option built around the same performance, cost-efficiency, and ease-of-use principles as VictoriaMetrics. In Q1 2026, VictoriaLogs became generally available in VictoriaMetrics Cloud, with support for log exploration, LogsQL, integrations, documentation, and managed deployment features such as backups and upgrades.
How does the MCP Server improve observability in VictoriaMetrics Cloud? The hosted MCP Server improves observability in VictoriaMetrics Cloud by letting users interact with their metrics through AI assistants that support MCP, without running the server locally. Teams can use natural language to query metrics, explore labels and time series, inspect alerting rules, analyze cardinality, and understand system behavior more quickly.
What does the observability cost calculator show? The observability cost calculator helps teams estimate and compare the cost of running VictoriaMetrics Cloud against other observability options using benchmark-based assumptions. It is designed to give teams a clearer sense of the order-of-magnitude cost differences, especially when evaluating cost-effective managed observability at different scales.
What changed with alerting rule presets and the alerting rule editor? VictoriaMetrics Cloud expanded alerting rule presets and moved them directly into each deployment’s Alerting Rules menu, making it easier to apply production-ready rules in context. The new alerting rule editor also lets users create, edit, and delete alerting and recording rules from the UI, reducing the need to manually write Prometheus rule YAML for common workflows.
Leave a comment below or Contact Us if you have any questions!
comments powered by Disqus