- Blog /
- VictoriaMetrics Cloud: What's New in Q1 2025?
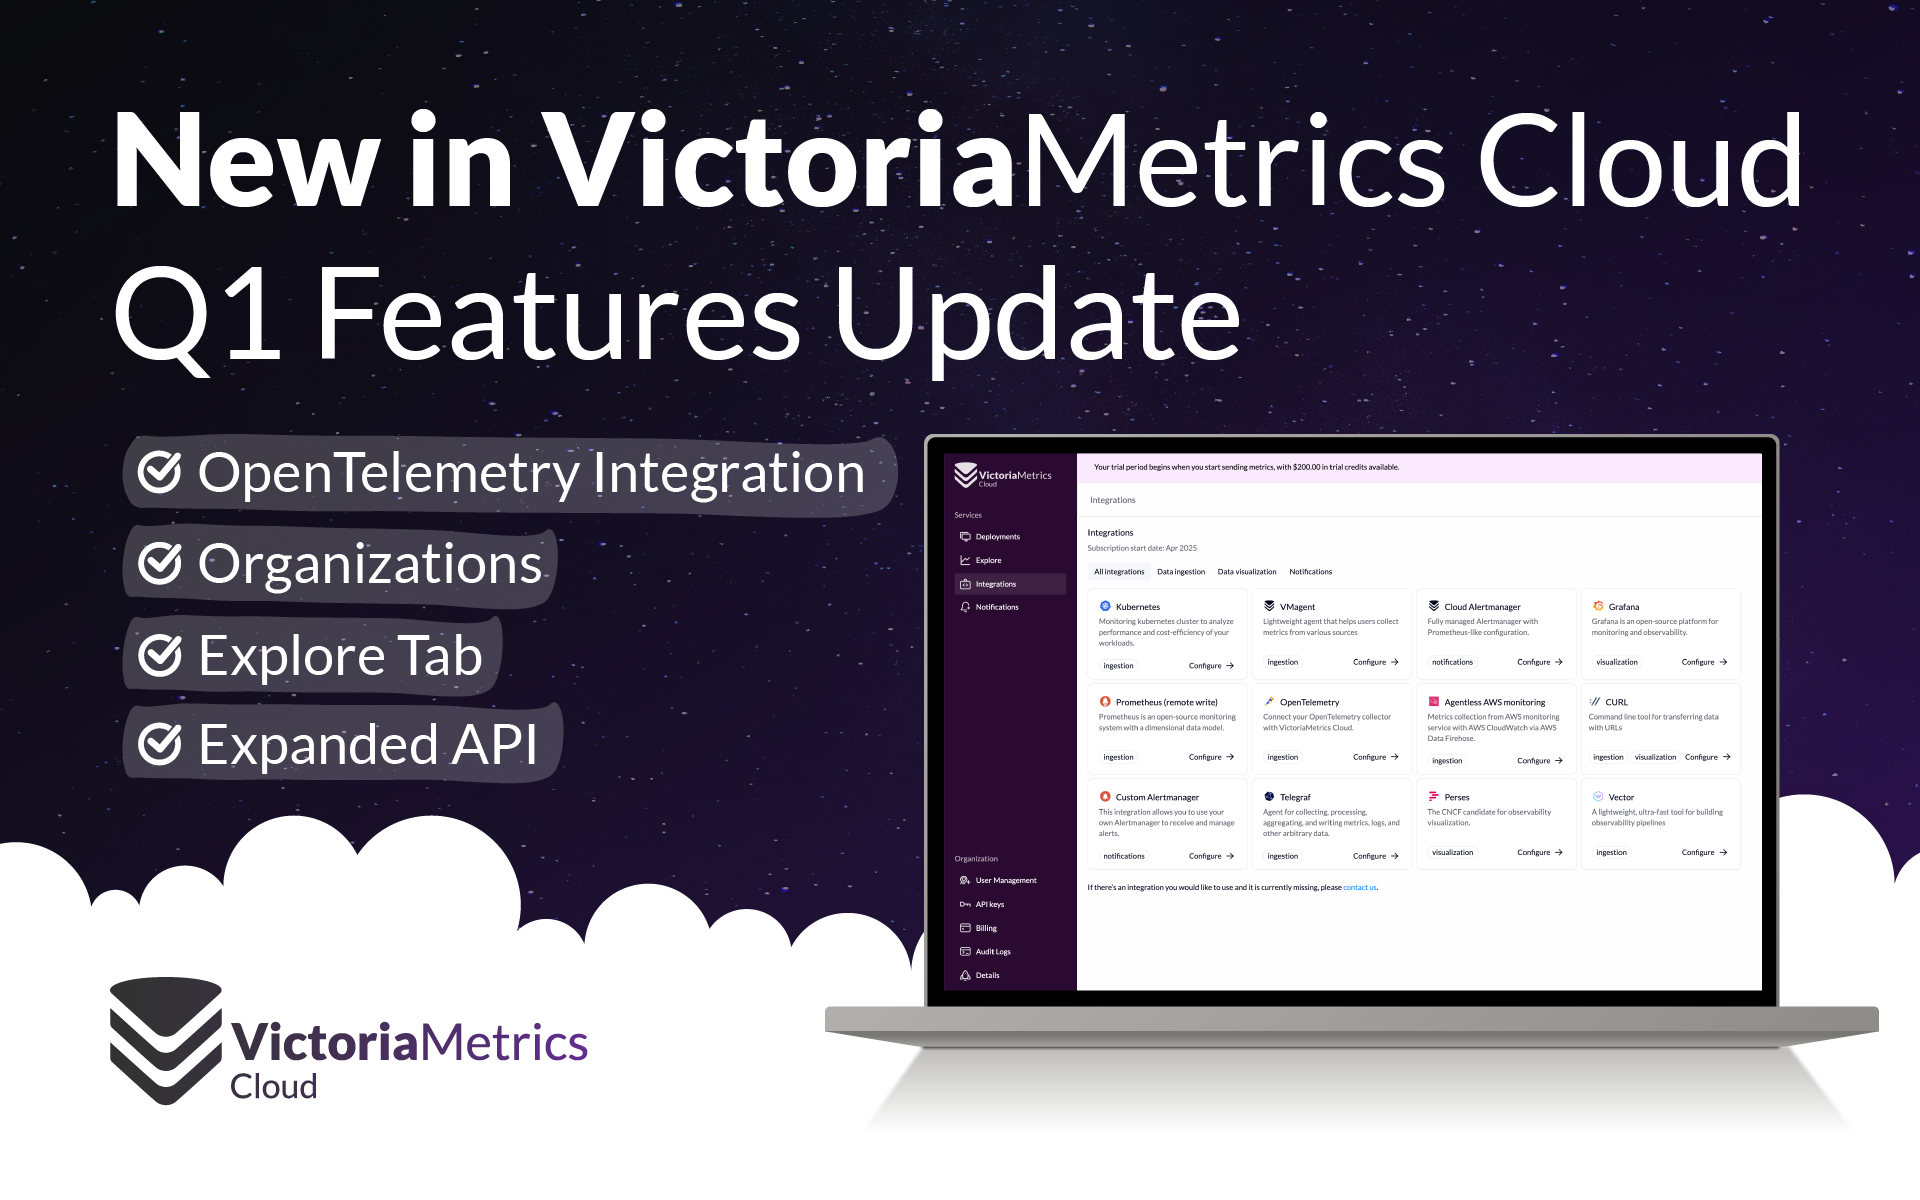
VictoriaMetrics Cloud: What's New in Q1 2025?
Share:


Time flies, and just like that, we are already in April! The first quarter of 2025 has been packed with exciting updates for VictoriaMetrics Cloud. If you joined our latest Quarterly Virtual Meetup, you might have already seen some of these announcements alongside other great improvements across all things VictoriaMetrics.
In this post, we’ll take a closer look at what’s new in VictoriaMetrics Cloud: a revamped Organizations feature for better collaboration, seamless OpenTelemetry integration, a powerful new Explore tab, and additional API endpoints to enhance automation and control, together with many improvements based on your invaluable feedback. Let’s dive in!
Don’t forget to try it for free today by signing up for VictoriaMetrics Cloud.
Organizations: Collaborate Effectively
#
One of the most requested features has arrived! Users can now create and manage Organizations within VictoriaMetrics Cloud. This means you can now invite collaborators, assign specific roles and permissions, and organize deployments under a structured access model. This makes it easier for teams to collaborate, control access, and scale their observability collaboration.
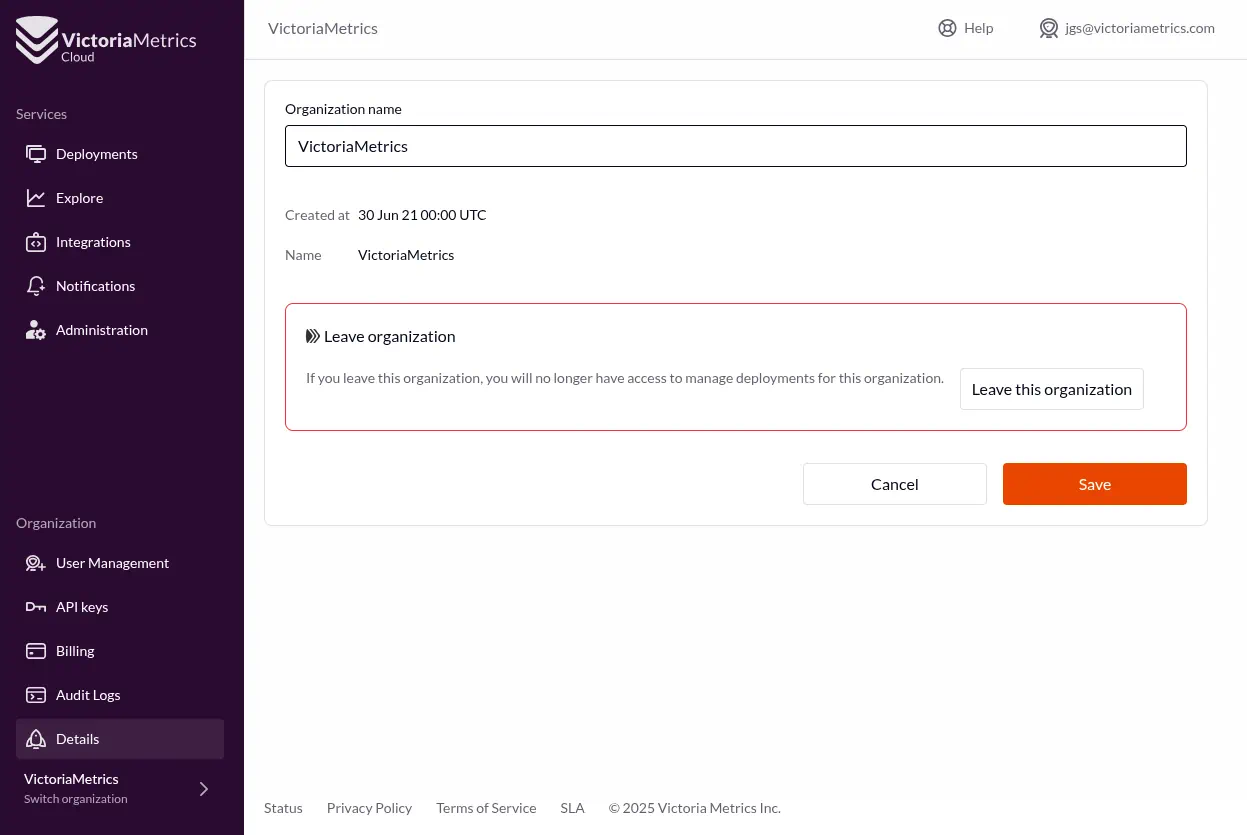 New Organizations layout
To improve usability, we have also redesigned the interface to clearly separate organization-related settings from deployment management. This new layout makes navigating your monitoring environment more intuitive.
OpenTelemetry Integration: Easier Than Ever
#
VictoriaMetrics has long supported OpenTelemetry, and now we’ve made it even easier to integrate! As usual for all VictoriaMetrics Cloud use cases, you just need to pick an endpoint and a Bearer Token (for authorization), and you’ll be all set to start sending your OpenTelemetry metrics.
But those of us who grew up copy-pasting from stack-overflow (instead of ChatGPT), really love to
get easy snippets to start with and later (maybe at some point in life) read the docs. That’s why
if you navigate to the integrations page in
VictoriaMetrics Cloud, we’ll guide you through the process. Just pick your deployment and Access Token,
and we’ll do all the leg work for you.
 Basic OpenTelemetry Helm Chart integration
Here’s an example of an OpenTelemetry collector basic configuration in deployment mode, installed via Helm Chart, that scrapes Kubernetes metrics (making use of the almighty Cluster Metrics Preset) and sends them to a VictoriaMetrics Cloud instance. In this snippet, both Bearer Token and endpoints are just examples (for obvious reasons).
Tip!
VictoriaMetrics Cloud also offers seamless integration examples and guidance via the OpenTelemetry Operator.
Push Metrics from OpenTelemetry Collector (Helm Chart)
#
mode: deployment
presets:
  # Enables K8s cluster receiver
  clusterMetrics:
    enabled: true

config:
  extensions:
    # We are using the token directly, but a filename may
    # also be provided.
    # Used to authenticate with VictoriaMetrics Cloud,
    # and needs to be included in the otlp exporter
    bearertokenauth:
      scheme: "Bearer"
      token: v3ry-c0mpl1c4t3D-4nd-s3cure-t0k3n
    # ...other extensions go here.

  receivers:
    otlp:
      protocols:
        grpc:
          endpoint: 0.0.0.0:4317
        http:
          endpoint: 0.0.0.0:4318
    # ...other receivers go here.

  exporters:
    debug: {}
    # Here we define the VictoriaMetrics Cloud endpoint
    # with auth included.
    otlphttp/cloud:
      compression: gzip
      encoding: proto
      endpoint: https://example.com/opentelemetry
      auth:
        authenticator: bearertokenauth
    # ...other exporters go here

  service:
    extensions: [bearertokenauth, health_check]
    pipelines:
      # Basic pipeline to collect metrics and send
      # them to VictoriaMetrics Cloud.
      metrics:
        receivers: [otlp]
        processors: []
        exporters: [otlphttp/cloud]
      # ...more pipelines go here.

image:
  repository: "otel/opentelemetry-collector-contrib"
Expanded VictoriaMetrics Cloud API
#
For those looking into automating their workflows, we’ve introduced several new API endpoints, enabling you to manage your cloud resources programmatically. You can find the full documentation in Swagger format or check out the detailed guide here.
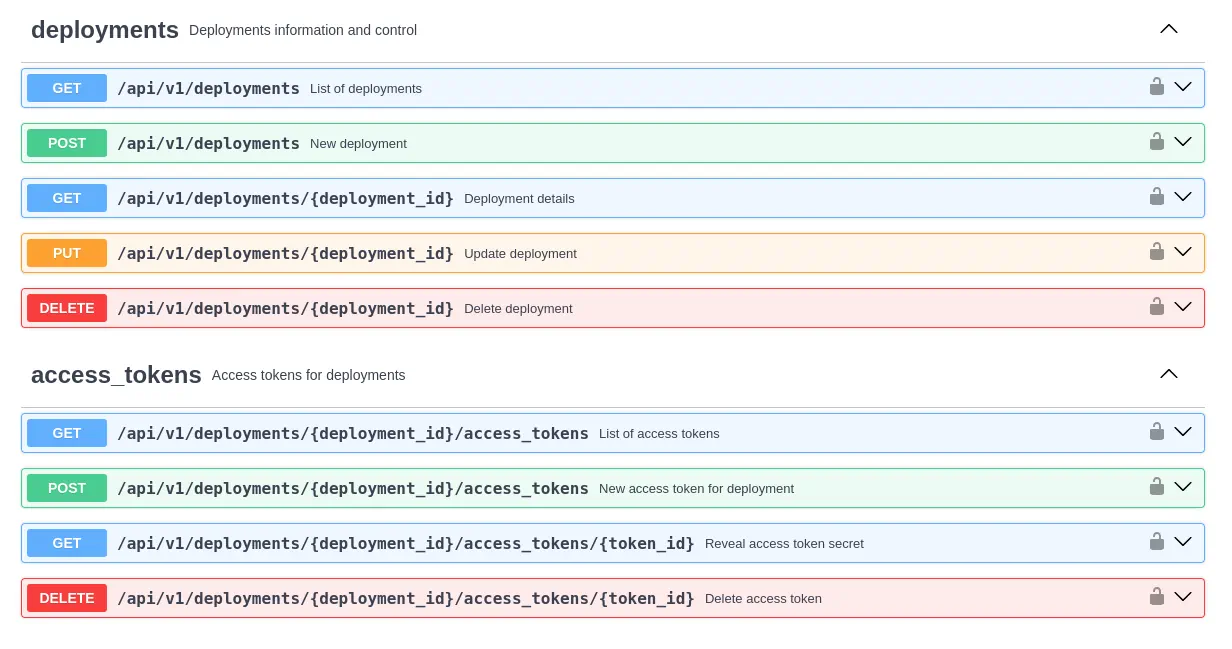 New APIs available in VictoriaMetrics Cloud
The new endpoints include access to general infrastructure data such as supported cloud providers, regions, and instance types. You can also perform deployment actions (list, create, update, or delete deployments) as well as manage your access tokens with full control, including revealing secrets and revoking tokens as needed.
Explore Tab: Visualize and Analyze Your Metrics
#
We’re introducing a new Explore tab powered by the VictoriaMetrics UI! This feature helps users inspect data, build queries, and gain insights with ease. In this way, we fully separate the deployment management activities from observing your own data.
Did you know…?
VictoriaMetrics UI is available to play with example data at https://play.victoriametrics.com/
If you are curious about what you can do in the Explore table, here you can find a breakdown of the functionalities included:
Query Your Own Metrics
#
The Query section allows you to visualize your metrics in a variety of formats: graphs, tables, or JSON.
You can run multiple queries at once, prettify them for readability, use autocomplete to accelerate your workflow,
and trace queries to understand execution behavior more deeply.
Explore Valuable Insights
#
In the Insights section, you’ll find tools to explore your Prometheus metrics by job and instance.
You can also inspect the cardinality of your time series data to help optimize resource usage and cost.
Plus, you’ll discover your most frequently used and heaviest queries.
Coming soon!
We are working on bringing the Unused Metrics functionality to VictoriaMetrics Cloud, which will identify which metrics are never queried, so you can reduce your storage footprint and costs. Stay tuned!
Analyze, Debug, and Learn
#
For advanced users, the Tools section provides built-in tools for analyzing query performance. The query analyzer breaks down execution details, while our WITH templating feature in MetricsQL simplifies building complex queries. You’ll also find step-by-step examples for debugging metric relabeling making even the scariest parts of observability more approachable (and even fun!).
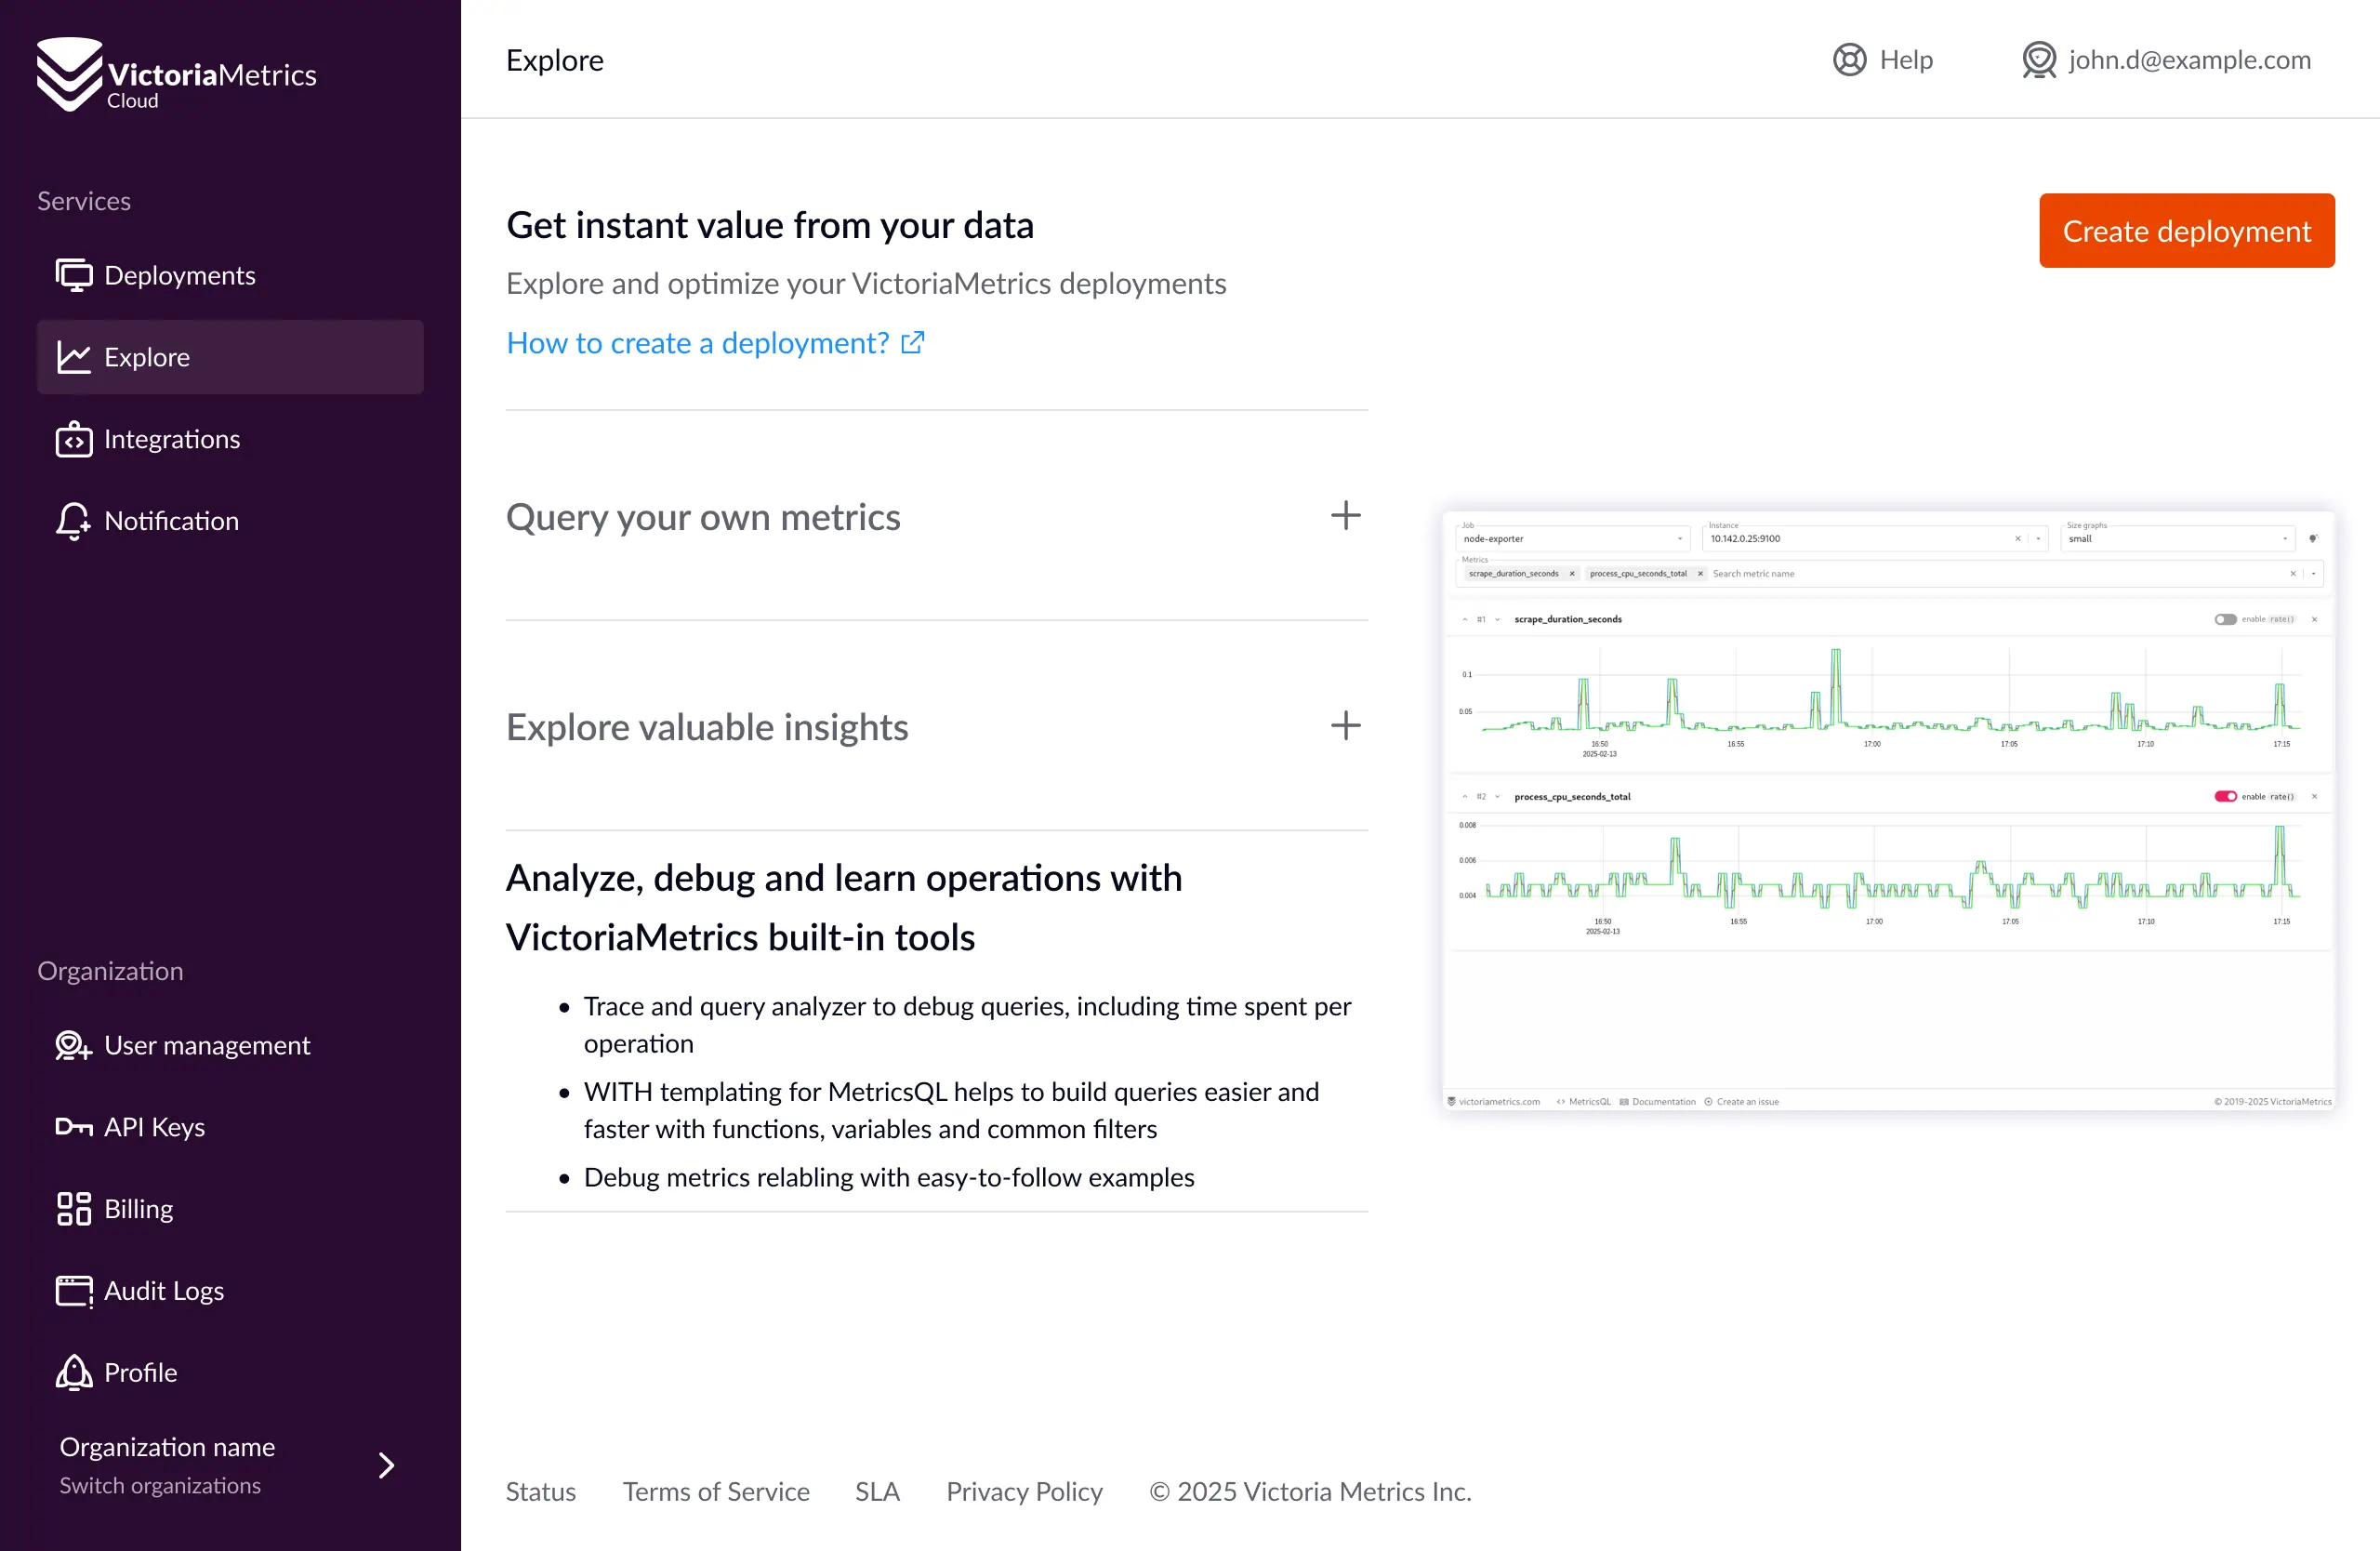 Explore metrics in VictoriaMetrics Cloud
Other Improvements
#
Improved Experience for Terminated Deployments
#
We’ve enhanced the handling of terminated deployments while always informing users in case they experience any issue with their third-party billing accounts. Rest assured, we take backups before deleting any installation and allow you to re-deploy easily once billing issues are resolved.
IPv6 Support
#
Users can now send or access VictoriaMetrics data via IPv6, including the UI.
Documentation Enhancements
#
We continue enhancing our documentation! While we’re working on a full revamp, check out these updates:
What’s Next?
#
We’re continuously enhancing VictoriaMetrics Cloud, and here’s a sneak peek at what’s coming soon:
- VictoriaLogs is coming to VictoriaMetrics Cloud: The new and fast log management solution that everybody is talking about. Don’t forget to give it a try with example data at https://play-vmlogs.victoriametrics.com/ ! Read how it outperforms other solutions or how it compares to other log databases such as Loki or ElasticSearch.
- PrivateLink Automation: Currently available on demand as an add-on feature (see FAQ), soon to be fully integrated into the UI.
- More insights on unused metrics: Helping users optimize storage and reduce costs.
- Multi Tenancy and access control Before the end of the year, we’re also enhancing tenant-based filtering and access control. This will come with improvements in both the UI and API, allowing different tenants to securely read or write specific subsets of data, which expands multi-tenant observability use cases and access boundaries.
Thanks for reading and for being part of the VictoriaMetrics community. As always, your input helps shape the future of our products.
Want to experience the latest improvements for yourself? Sign up for VictoriaMetrics Cloud and try it today!
Leave a comment below or Contact Us if you have any questions!
comments powered by Disqus