Observability Lessons NVIDIA and CoreWeave
NVIDIA now ships VictoriaMetrics as the default metrics backed in their self-managed Cloud Functions, and CoreWeave uses VictoriaMetrics for infrastructure monitoring and AI capabilities.
NVIDIA now ships VictoriaMetrics as the default metrics backed in their self-managed Cloud Functions, and CoreWeave uses VictoriaMetrics for infrastructure monitoring and AI capabilities.
No matching authors found.
No matching categories found.
From the article
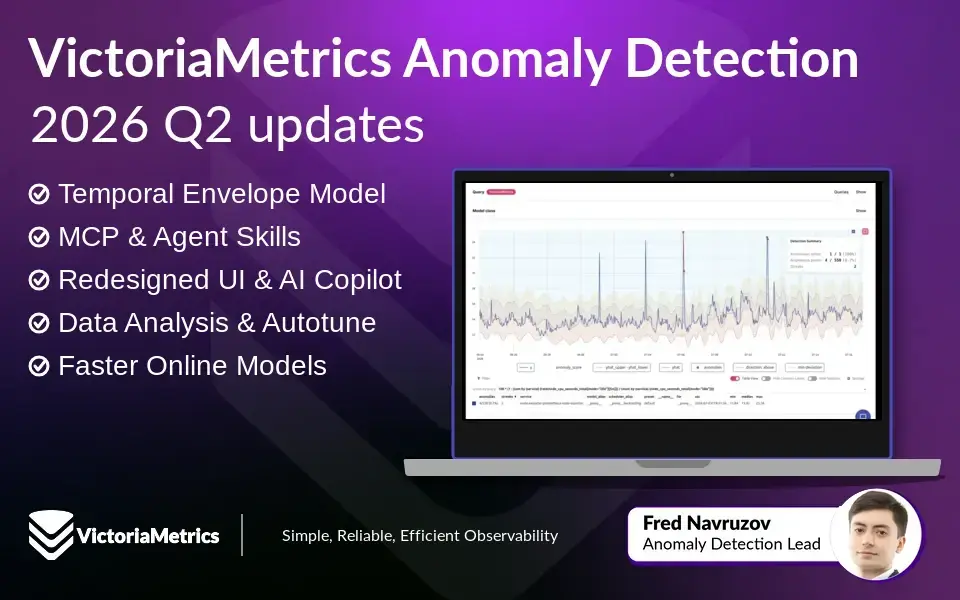
The Q2 2026 vmanomaly update introduces Temporal Envelope, a redesigned UI, faster online-model execution, and an AI-assisted workflow that turns natural-language monitoring goals into tested configurations and alerting rules.
VictoriaMetrics July updates bring a new LTS release, vmestimator, and a set of improvements across the stack that make operations simpler and observability more practical.
An interactive tour of what’s new in Go 1.27: every notable language, runtime, and standard library change, with short runnable examples you can edit and run in the browser.
Q2 2026 brought transparent credits reporting for prepaid billing, many navigation improvements across the console, progress on SOC 2, and a first look at the compute-based model that will reshape how VictoriaMetrics Cluster is sized and priced.
Monitor NVIDIA, AMD, and Intel GPUs with the OpenLIT OpenTelemetry GPU Collector and the VictoriaMetrics stack: eBPF CUDA kernel tracing, OTel hardware semantic conventions, MetricsQL queries, recording rules, and alerts.
vmestimator is a new open-source tool that estimates metric cardinality in real time. It can alert to high-cardinality spikes before they slow queries and increase resource usage. Works with any Prometheus-compatible setups, Grafana, and vmalert
Take a look at what we shipped in the first half of 2026 across VictoriaMetrics: metrics, logs, traces, and cloud,with improvements in performance, scalability, and usability.
See practical examples on monitoring LLM applications and Agents with OpenLIT and VictoriaMetrics observability stack. See real examples of the deployment manifests, alerting rules and Grafana dashboard.
A beginner-friendly tour of how VictoriaLogs stores your logs on disk: streams and daily partitions, immutable parts, blocks and columns, and the files inside a part (timestamps, values, bloom filters, column headers, and the two-level index) that let a query read only the bytes it needs.
Many thanks for submitting our Contact Us form. One of our team members will be in touch shortly to follow up on it with you.