- Blog /
- Observability's Sixth Sense: Grounding Anomaly Detection in Reality
Observability's Sixth Sense: Grounding Anomaly Detection in Reality
Share:


Summary: Machine learning-based anomaly detection improves observability by learning normal system behavior instead of relying only on static thresholds. This article explains how vmanomaly, its MCP server, purpose-built skills, and an LLM-powered UI copilot help engineers explore telemetry, investigate anomalies, build MetricsQL queries, select suitable models, apply business constraints, and validate configurations through natural language. These AI-assisted workflows reduce configuration effort, support proactive issue detection, and keep engineers in control of validation and production deployment.
Modern production systems are incredibly noisy. We are collecting more metrics, logs, and distributed traces than ever before, yet when an actual production incident hits, debugging still feels entirely reactive, slow, and manual. You end up digging through a mountain of custom dashboards, fighting alert fatigue from static thresholds, and firefighting problems after they’ve already impacted your users.
At the recent JNation, Berlin Buzzwords, and DevConf.cz conferences, we explored a better path forward: treating anomaly detection as a core extension of the monitoring workflow to help developers surface critical infrastructure signals before they escalate into outages.
Incorporating anomaly detection into your daily workflow fundamentally changes how engineering teams interact with production:
- For Developers: Reduces time spent chasing false alarms. By surfacing genuine anomalies automatically, developers can spend less time debugging noisy, recurring incidents and more time delivering new features.
- For SREs: Shifts operations from reactive to proactive. Instead of manually maintaining thousands of static Prometheus Alertmanager thresholds that break during cluster auto-scaling, you gain a dynamic framework that reduces Mean Time to Resolution (MTTR).
1. Rethinking the Baseline: Normal vs. Abnormal
#
In time-series data, an anomaly is a data point or an entire pattern that deviates significantly from expected system behavior. These deviations typically manifest as unexpected spikes, sudden dips, or weird cyclical structural shifts that standard baseline fluctuations cannot explain. In an engineering ecosystem, these are frequently driven by code bugs, unexpected shifts in customer workloads, infrastructure resource exhaustion, data collection errors, or rare downstream dependency failures.
The Universal Signal: Anomaly Score
#
How does an anomaly detection platform systematically catch these patterns without drowning your on-call team in false alarms? It comes down to translating raw telemetry into a standardized anomaly score.
The model produces one number per timestamp to measure data normality:
- Between 0 and 1: Represents normal variance matching the model’s expectation. If the actual value aligns perfectly, the score is exactly zero.
- Approaching 1: Behavior is moving closer to the boundaries of its expected range.
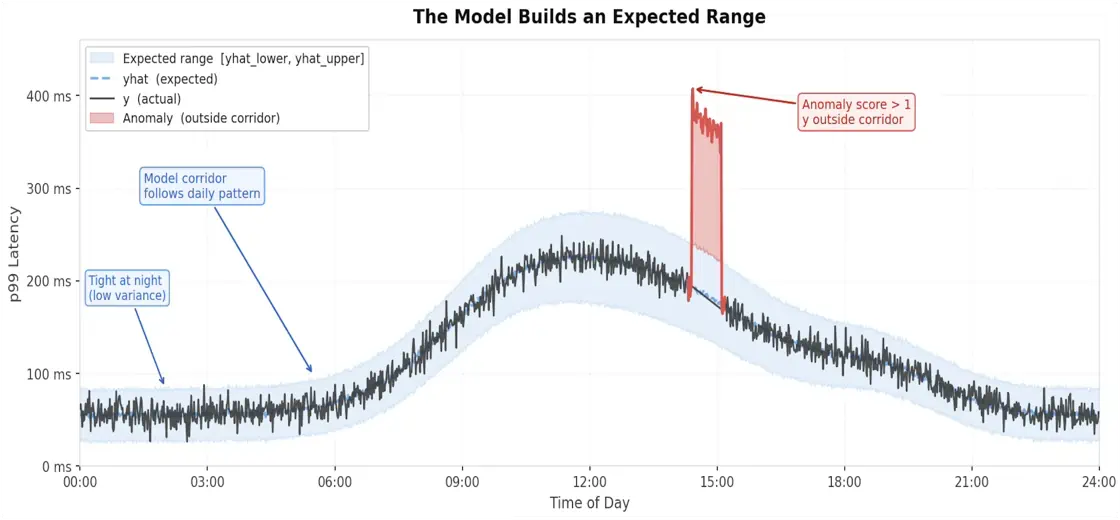
- Above 1: The real values have breached learned historical boundaries and are officially anomalous.
The anomaly score is de-trended, de-seasonalized, and de-scaled into a universal signal that grows in proportion to how far outside the expected corridor the value has traveled. This means a score of 1.5 is a mild anomaly, while a score of 5 signals something is seriously wrong. The anomaly score works seamlessly across CPU, latency, error rates, or request counts on any scale, allowing teams to route alerts intuitively, such as warning at 1 and paging at 3.
2. The Core Problem with Threshold Alerting
#
Static thresholds break when software systems evolve because a single, flat number cannot fit all operational contexts or describe what is truly “normal”. Meanwhile, threshold-driven alert fatigue actively kills observability; when a team receives fifty false alerts a week, they simply stop trusting the system.
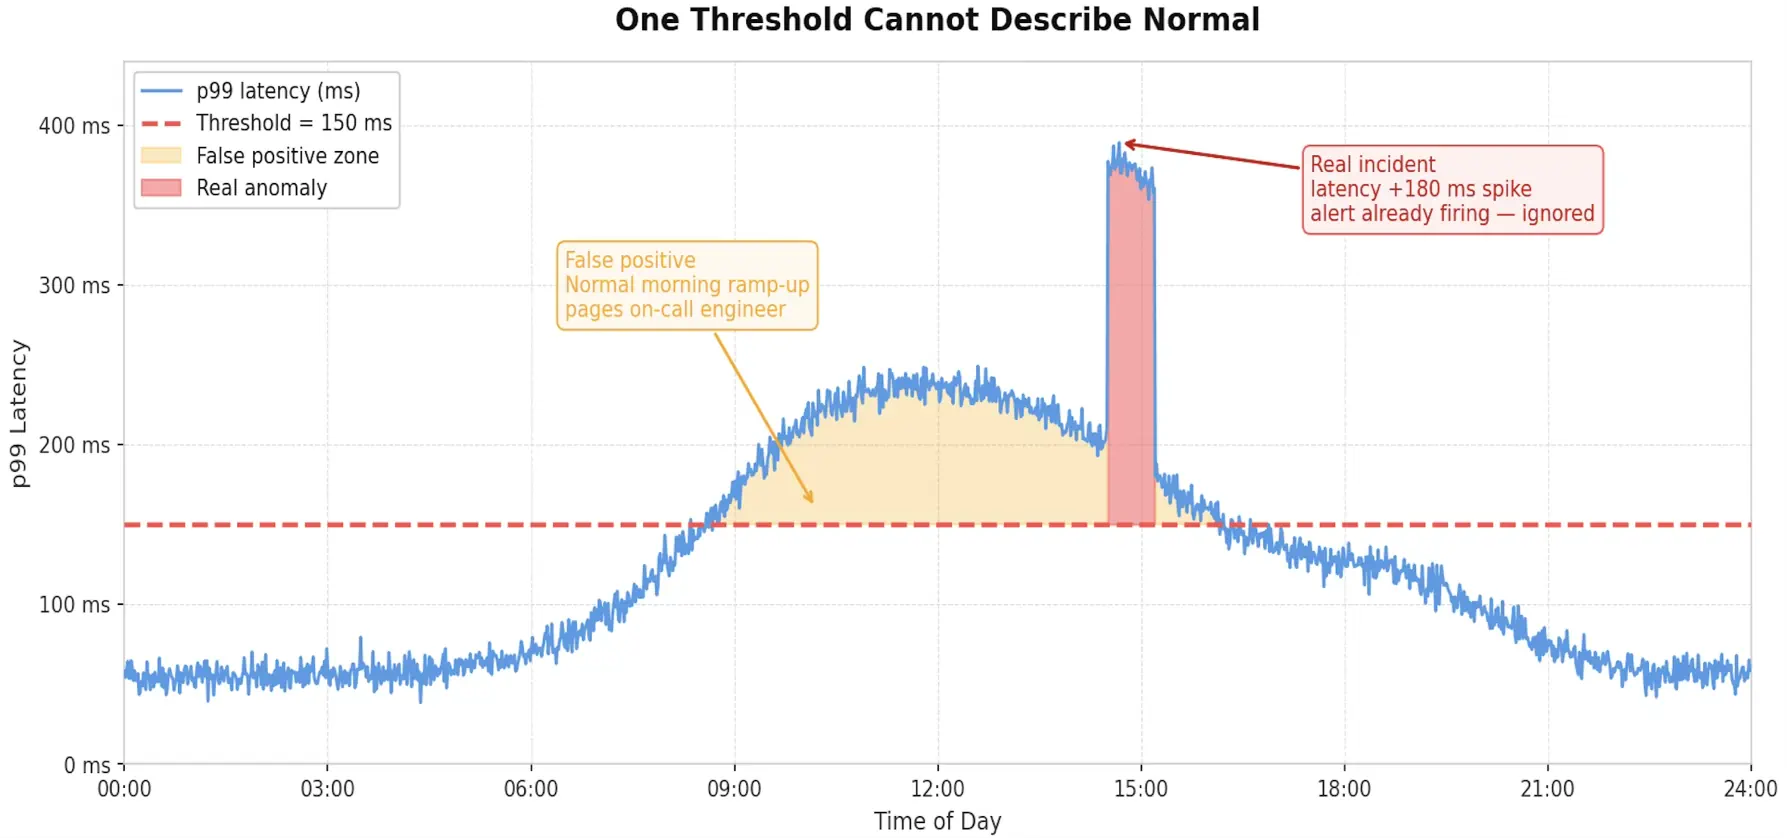
Consider a latency metric with a clear daily pattern, low at night and high during business hours.
If you draw a single static threshold line at 150ms:
- False Positives: You trigger invalid alerts during normal morning ramp-up windows when traffic naturally rises.
- False Negatives: You completely miss real, severe latency 180ms spikes during peak load periods because the baseline is already high, leaving the alert completely ignored or un-triggered.
A model, by contrast, trains on historical data to learn trends, daily patterns, and weekly cycles. It dynamically builds an expected corridor (“here is what is expected at 3:00 AM vs. 2:00 PM on a Friday”). Anything outside this corridor is flagged as an anomaly, not because a rigid number was crossed, but because the model recognizes that the behavior has never happened at that specific time under those exact conditions.
3. Adapting Anomaly Detection to Engineering Teams
#
Incorporating dynamic anomaly detection into a daily workflow fundamentally changes how different engineering teams interact with production software.
For Developers & Backend Engineers
#
- The Operational Benefit: Reduces time spent chasing false alarms and firefighting legacy infrastructure setups, freeing up valuable time to focus on shipping core features.
- Specific Use Cases: Pinpointing code regressions or silent background degradations immediately following a rolling deployment. For example, catching a subtle code bug that forces a service into an infinite retry loop or surfaces a sudden structural shift in cross-dependency latency.
For Site Reliability Engineers (SREs)
#
- The Operational Benefit: Shifts the team’s posture from reactive firefighting to proactive mitigation. It reduces the overhead of manually maintaining thousands of static Prometheus Alertmanager thresholds that inevitably break whenever a cluster auto-scales.
- Specific Use Cases: Capturing sparse, sudden infrastructure spikes or resource saturation anomalies. SREs can track container restart deltas or evaluate real-time CPU and memory request/limit compliance ratios across dynamic namespaces before they cascade into widespread cluster outages.
For Observability & Platform Practitioners
#
- The Operational Benefit: Optimizes platform efficiency by transforming raw, isolated metrics into context-aware, structured signals.
- Specific Use Cases: Implementing multi-variable cross-metric correlations. Instead of piling on hundreds of unnecessary single-metric dashboards, platform engineers can run multivariate models to spot complex regressions where individual metrics appear within normal technical boundaries, but their unified interaction signals systemic health failures.
4. Grounding Models in Reality: Why Business Context Matters
#
Pure machine learning algorithms are entirely blind to real-world business intent. A massive spike in system errors is obviously an operational failure, but an algorithmic model analyzing an arbitrary query curve might also treat a sudden drop to zero errors as an anomaly simply because it deviates from a noisy historical baseline.
Expanding the Business Parameters
#
We can configure the behavior of our models with several settings:
detection_direction: "above_expected": This directly stops the model from waking up an engineer at 3:00 AM just because error rates dropped to absolute zero. It guides the algorithm that statistical deviations are only dangerous when they move in a destructive direction (upward for errors or latency).min_dev_from_expected: 1: Acts as an automated noise dampener. If an underlying metric exhibits minor, harmless fluctuations, this parameter suppresses low-level variance, ensuring alerts are only routed when a deviation carries true operational weight.data_range: [0, .inf]: Clamping boundaries ensures that the mathematical models remain anchored within the physical boundaries of your active architecture, ignoring mathematically valid but structurally irrelevant data bounds.
Code-First Contextual Configuration
#
Below is a configuration example demonstrating how operational parameters are applied directly to an anomaly detection engine to align the models with real-world business intent.
In the example below, detection_direction is a model-level argument and min_dev_from_expected is used as the lower limit for error count:
models:
  api_latency_model_spikes:
    class: prophet
    interval_width: 0.95
    args:
      # some model args override, if needed
    detection_direction: above_expected # let us focus on spikes
    min_dev_from_expected: 1 # if we track error count, this is absolute scale guard
In the example below, data_range can be both reader-level and query-level parameters:
reader:
  class: vm
  datasource_url: xxx
  queries:
    api_errors:
      expr: "your_metricsql_expression"
      data_range: [0, '.inf'] # as error cnt is unbounded
5. Lowering the Onboarding Barrier: Natural Language Explorations
#
Similar results can be achieved through MCP and purpose-built skills without a dedicated UI, for example in agentic observability workflows used to launch new anomaly detection installations or validate existing ones. Developers can use natural-language requests to investigate anomalous behavior, query anomaly scores, inspect alerting rules, and review firing alerts without having to compose every MetricsQL expression or respective API request manually. The MCP server provides the integration layer, while the AI client supplies the conversational interface.
The developer describes the monitoring goal in natural language—no prior ML expertise or deep product understanding is required. The AI assistant interacts with service endpoints through MCP to inspect existing production queries, check documentation, list available models, and build the correct MetricsQL query.
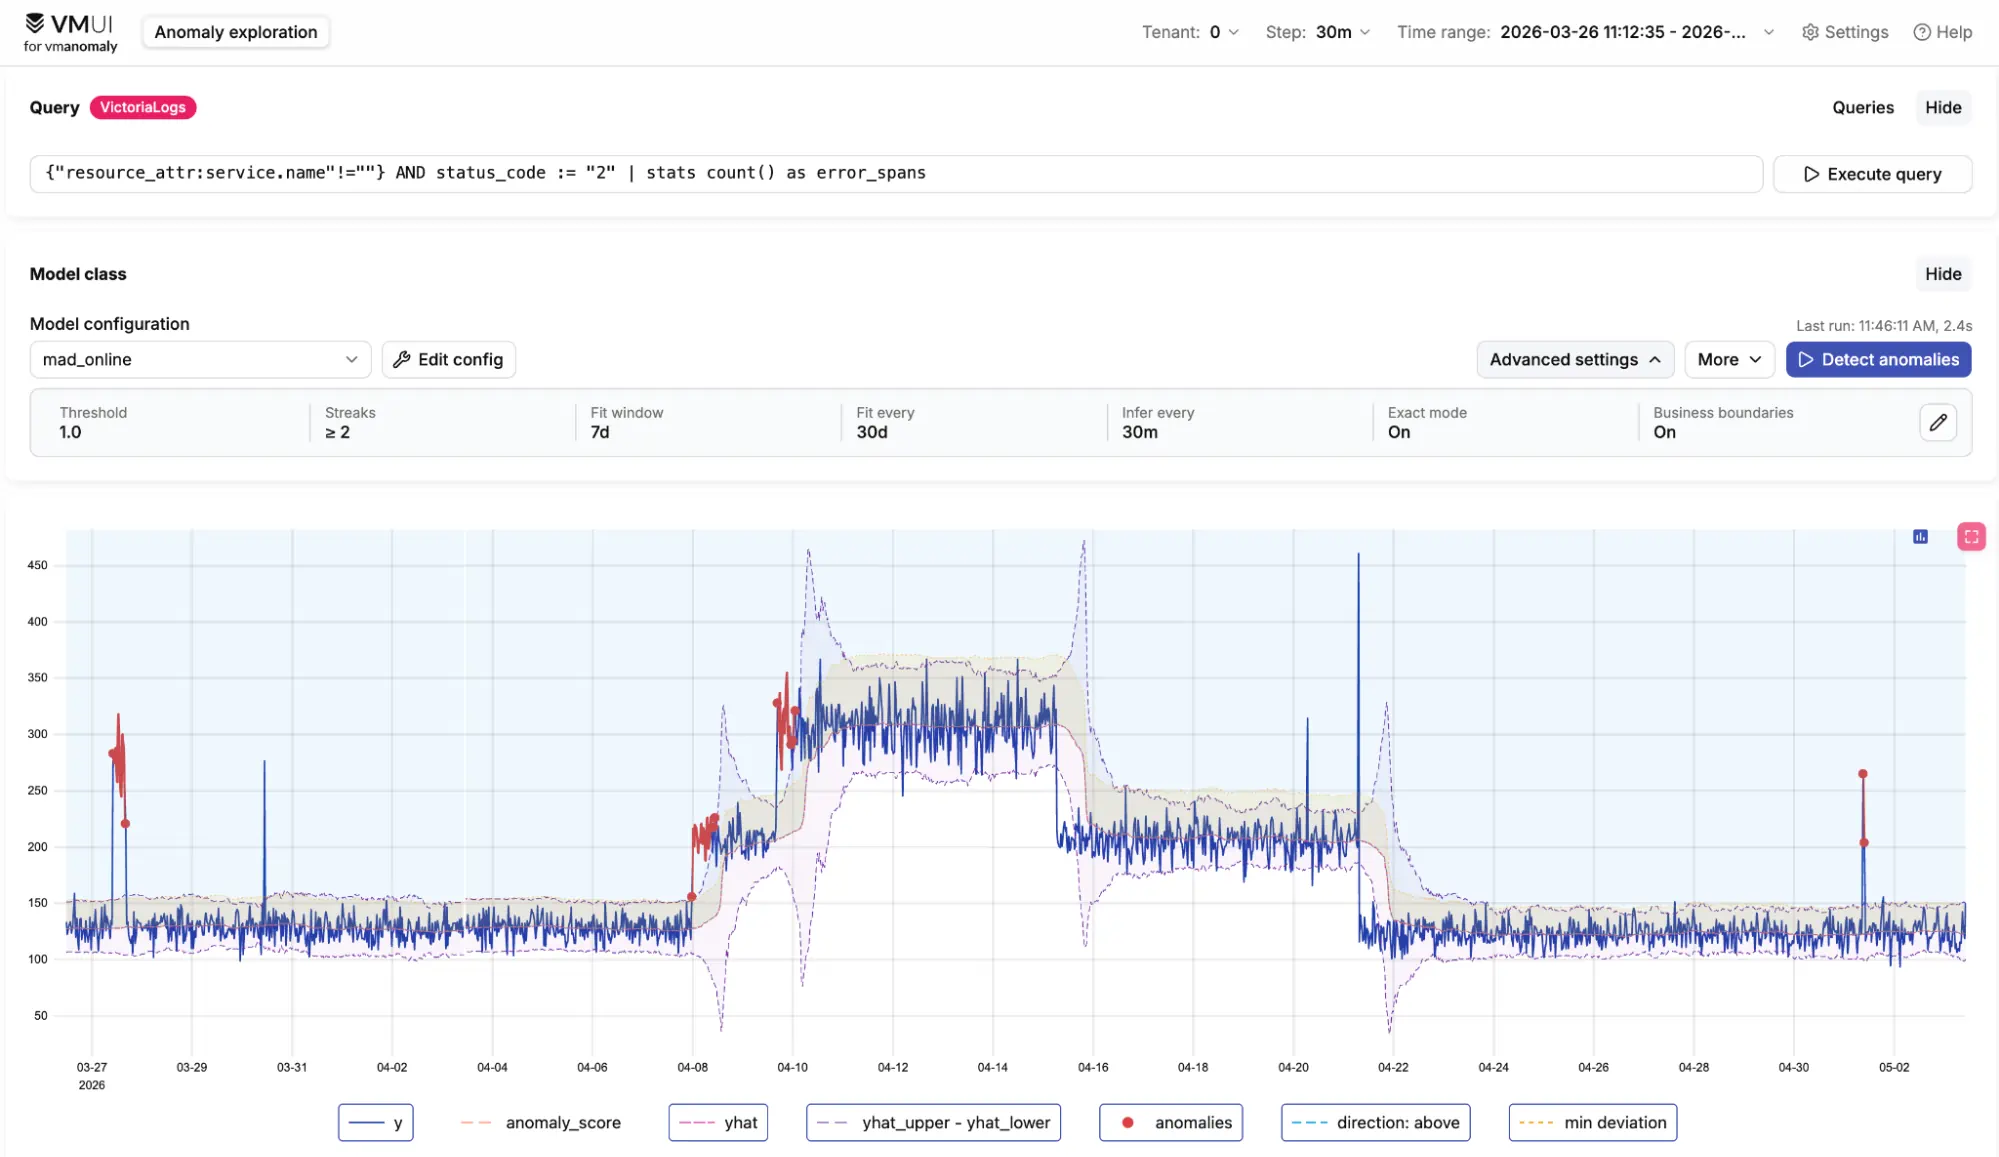
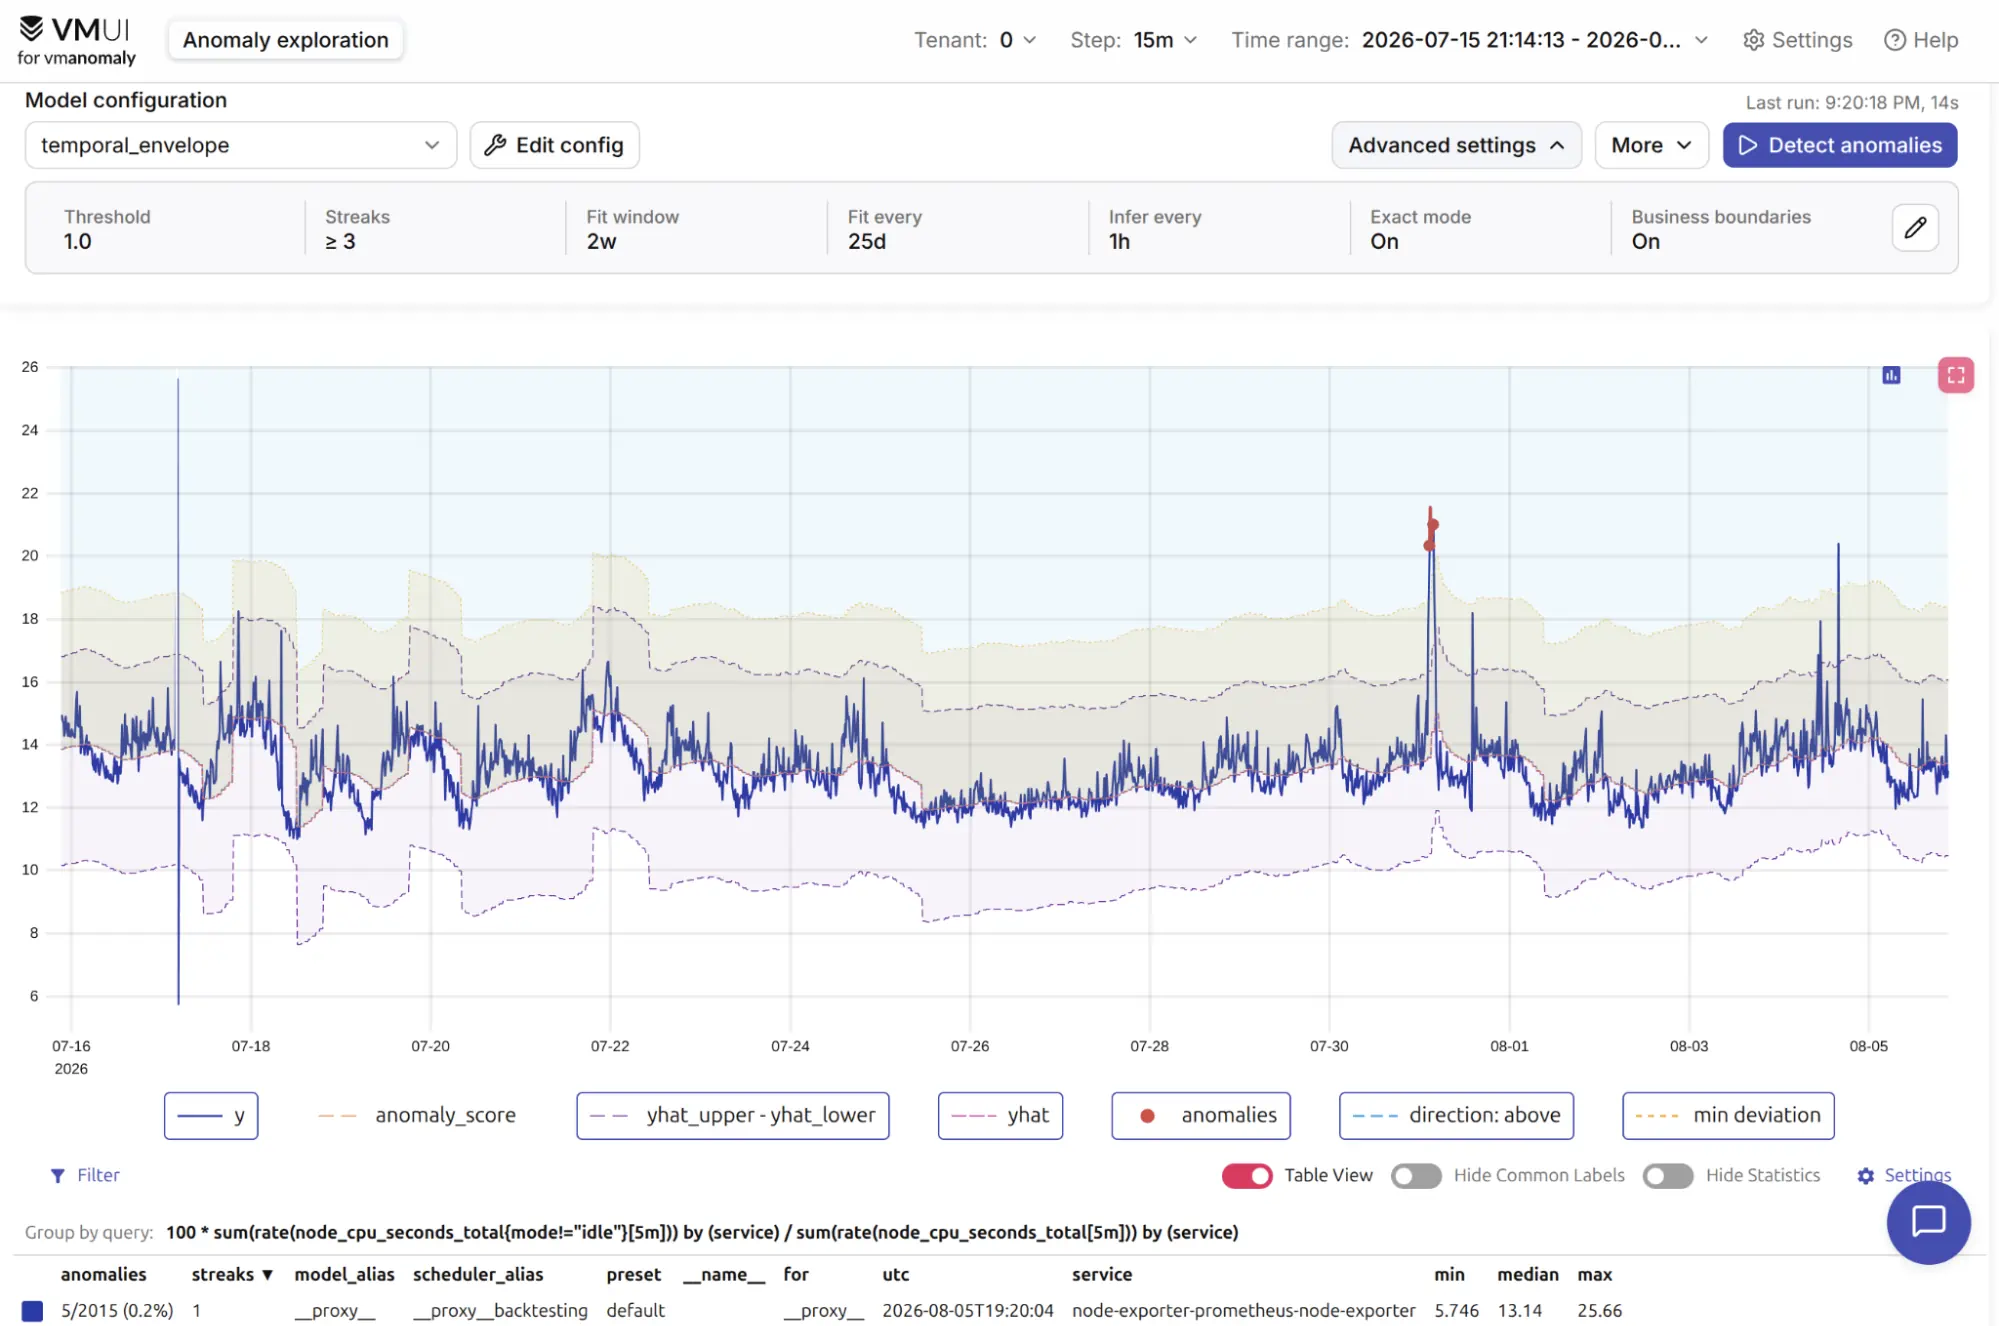
It then analyzes the returned time series for trends, change points, seasonality, and noise, recommends a suitable model class, applies business constraints such as detection direction, and tunes hyperparameters to keep anomalies below 2% while requiring at least three consecutive anomalous points to count as an anomaly.
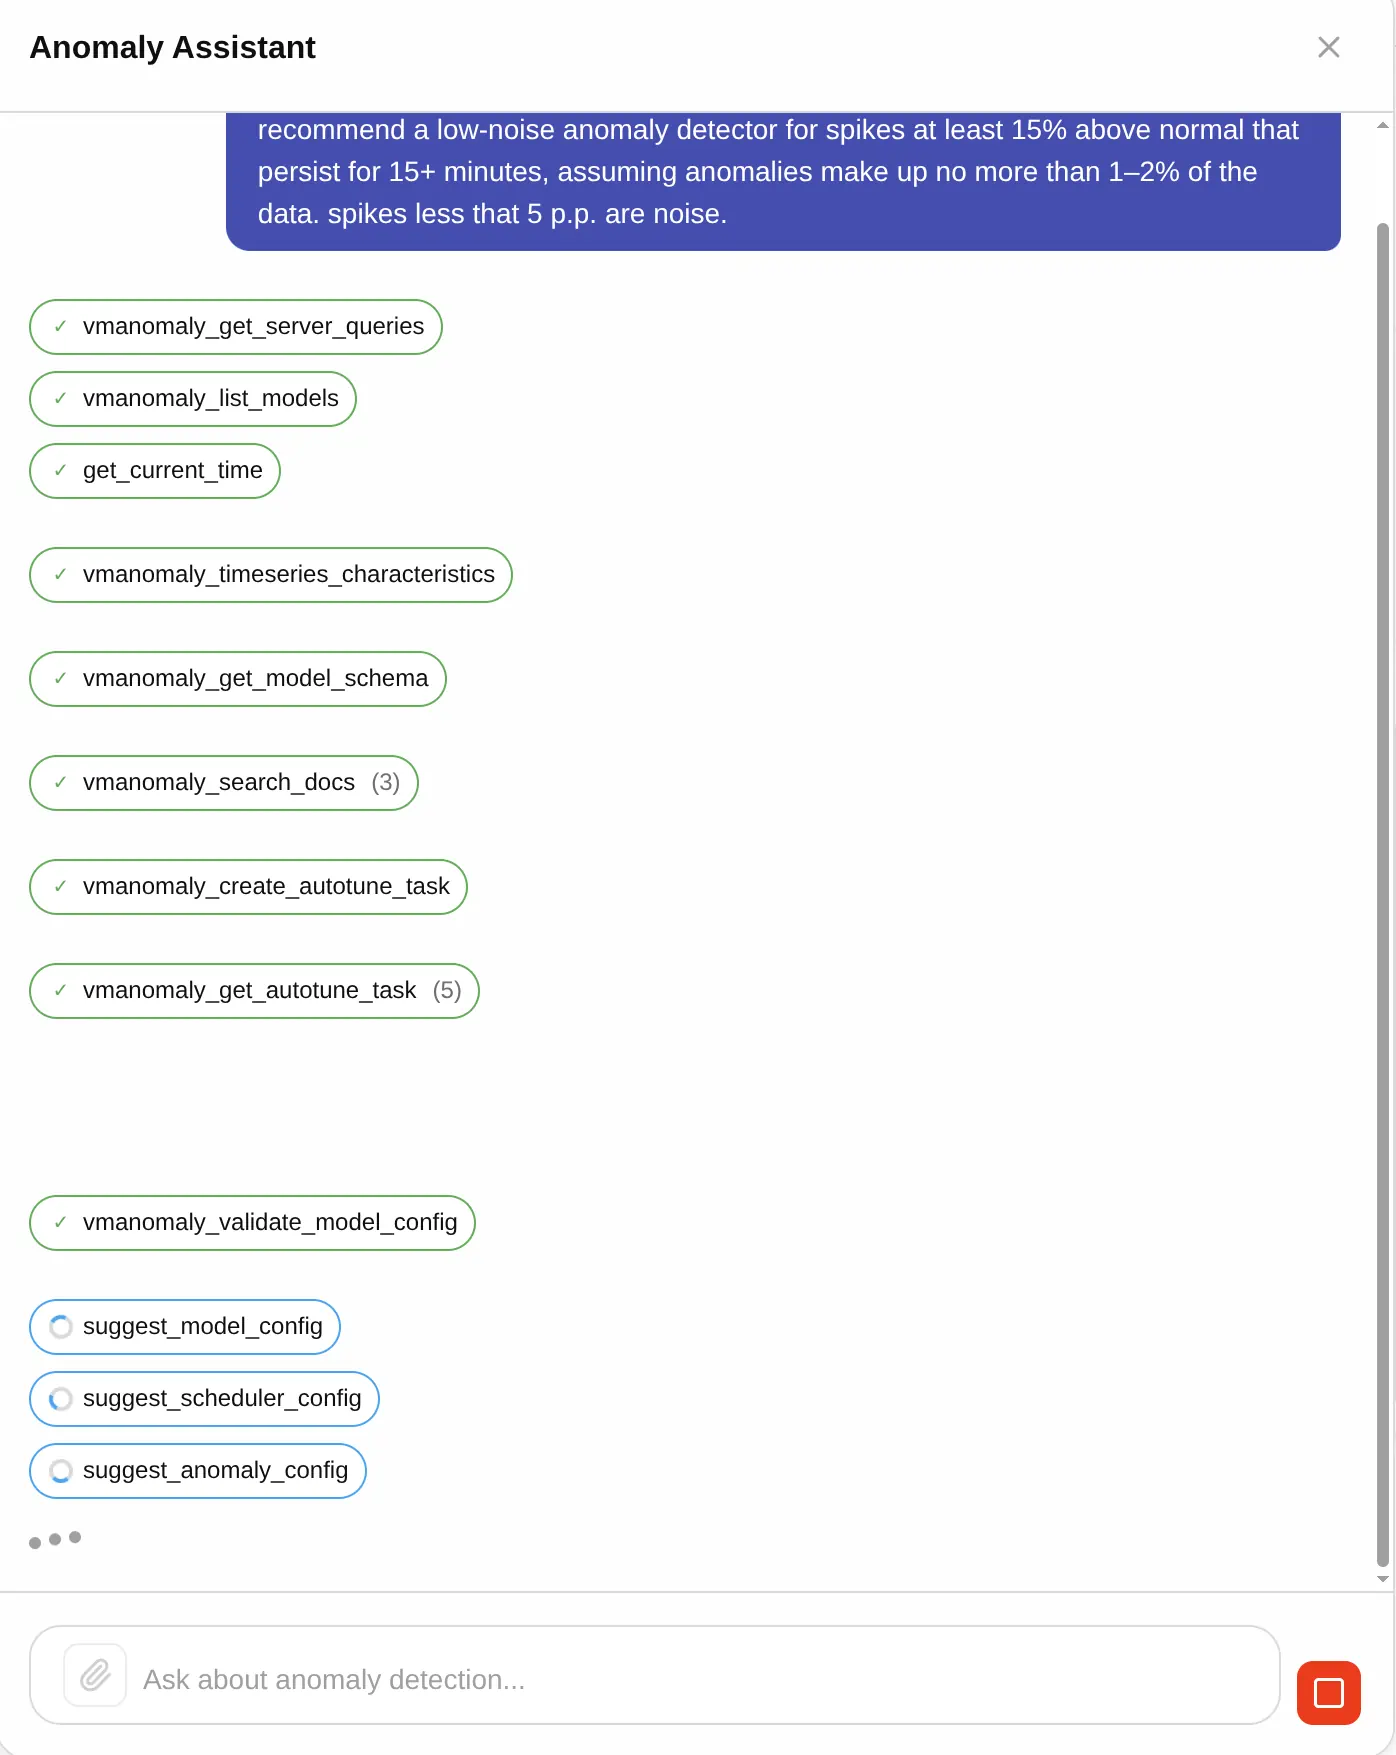
Then, the assistant validates the generated configuration and uses interaction protocols such as AG-UI to propose the corresponding UI changes, while explaining the choice and motivation.
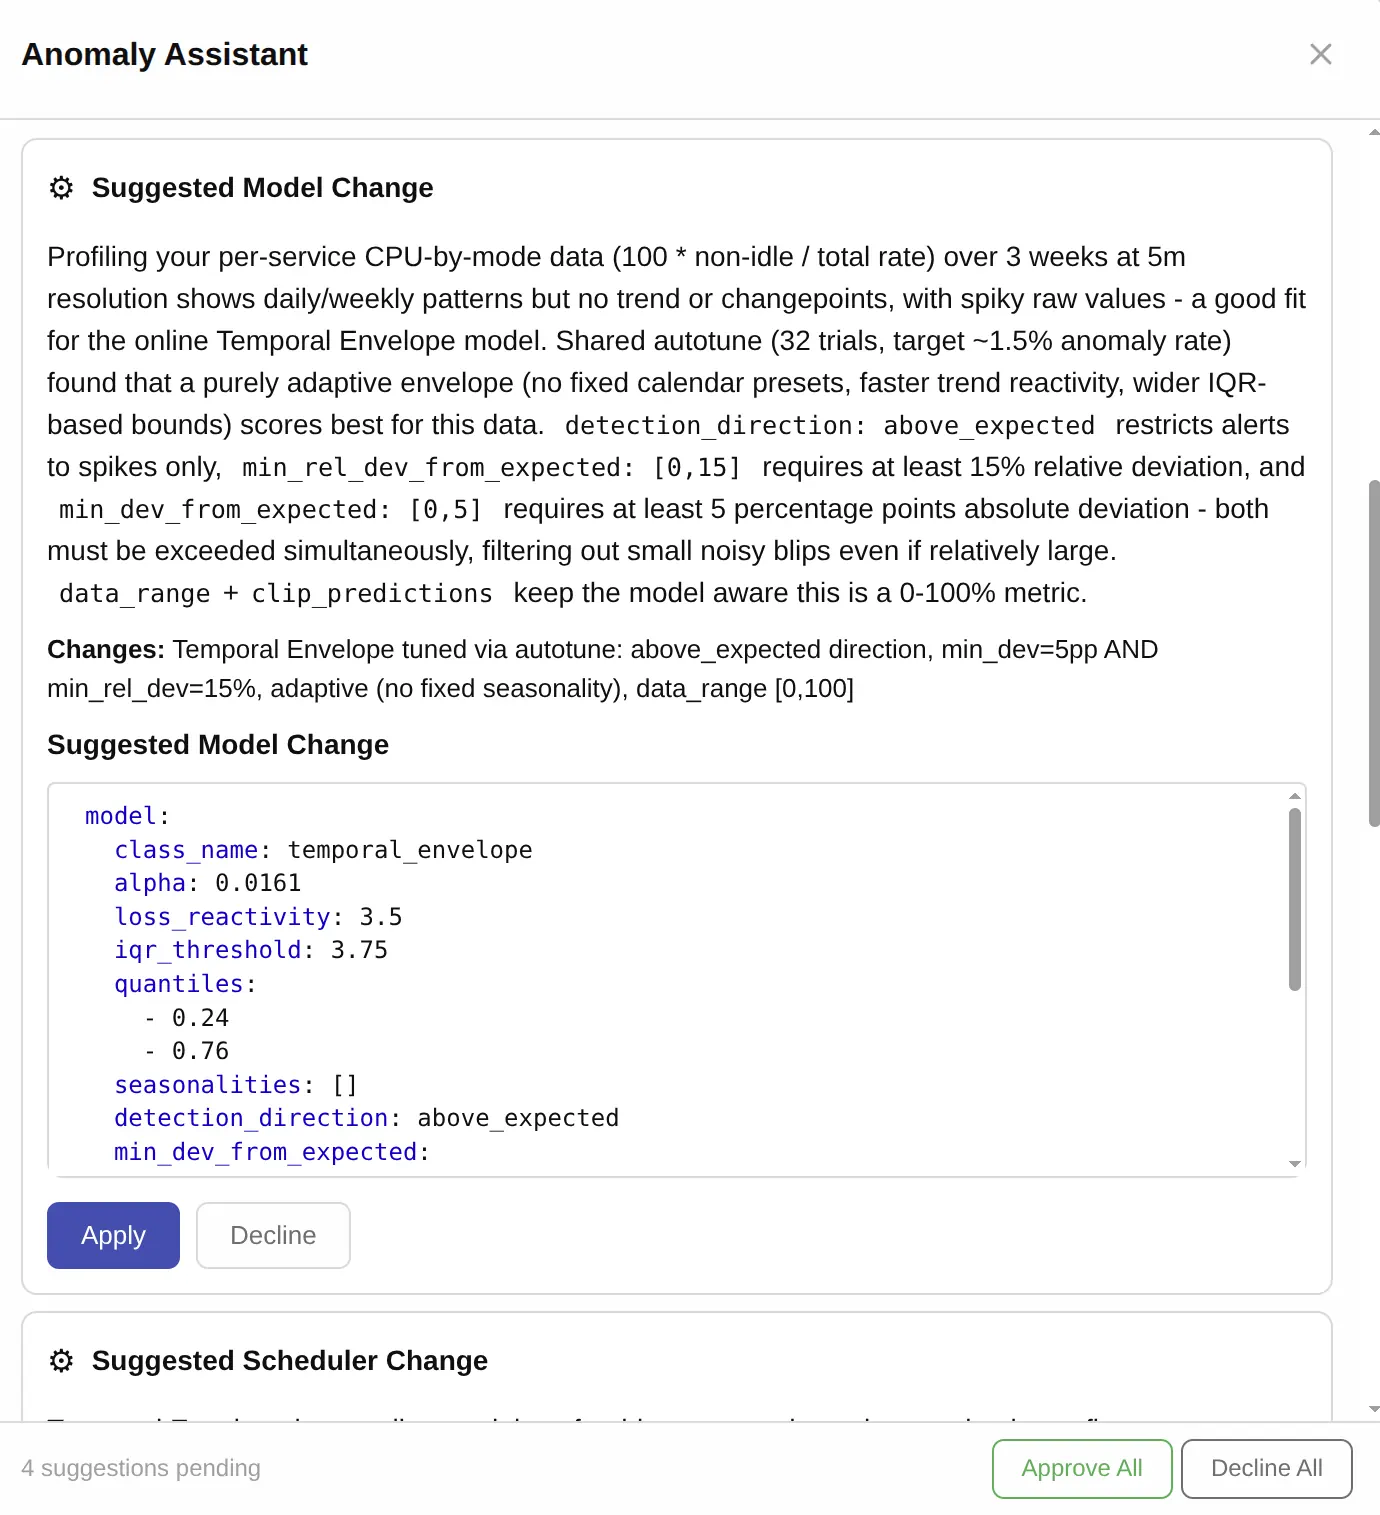
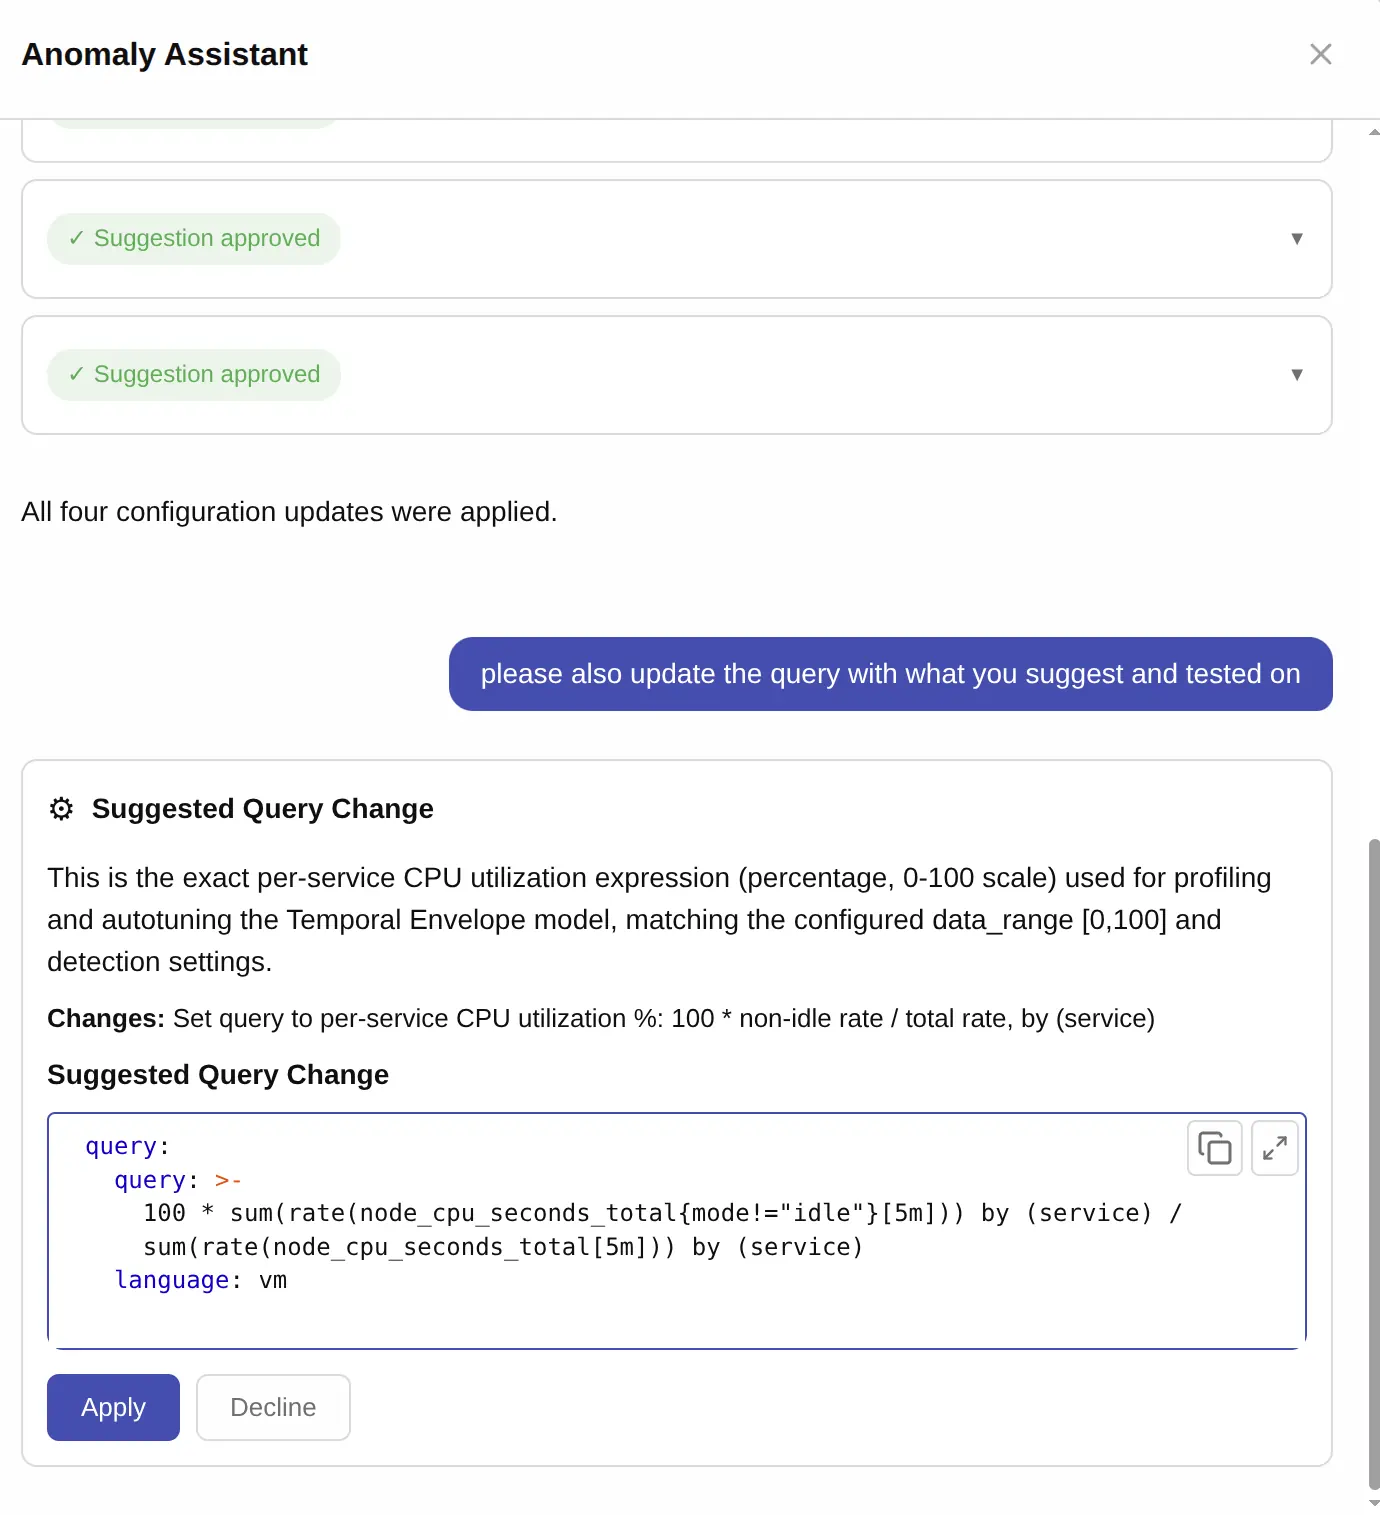
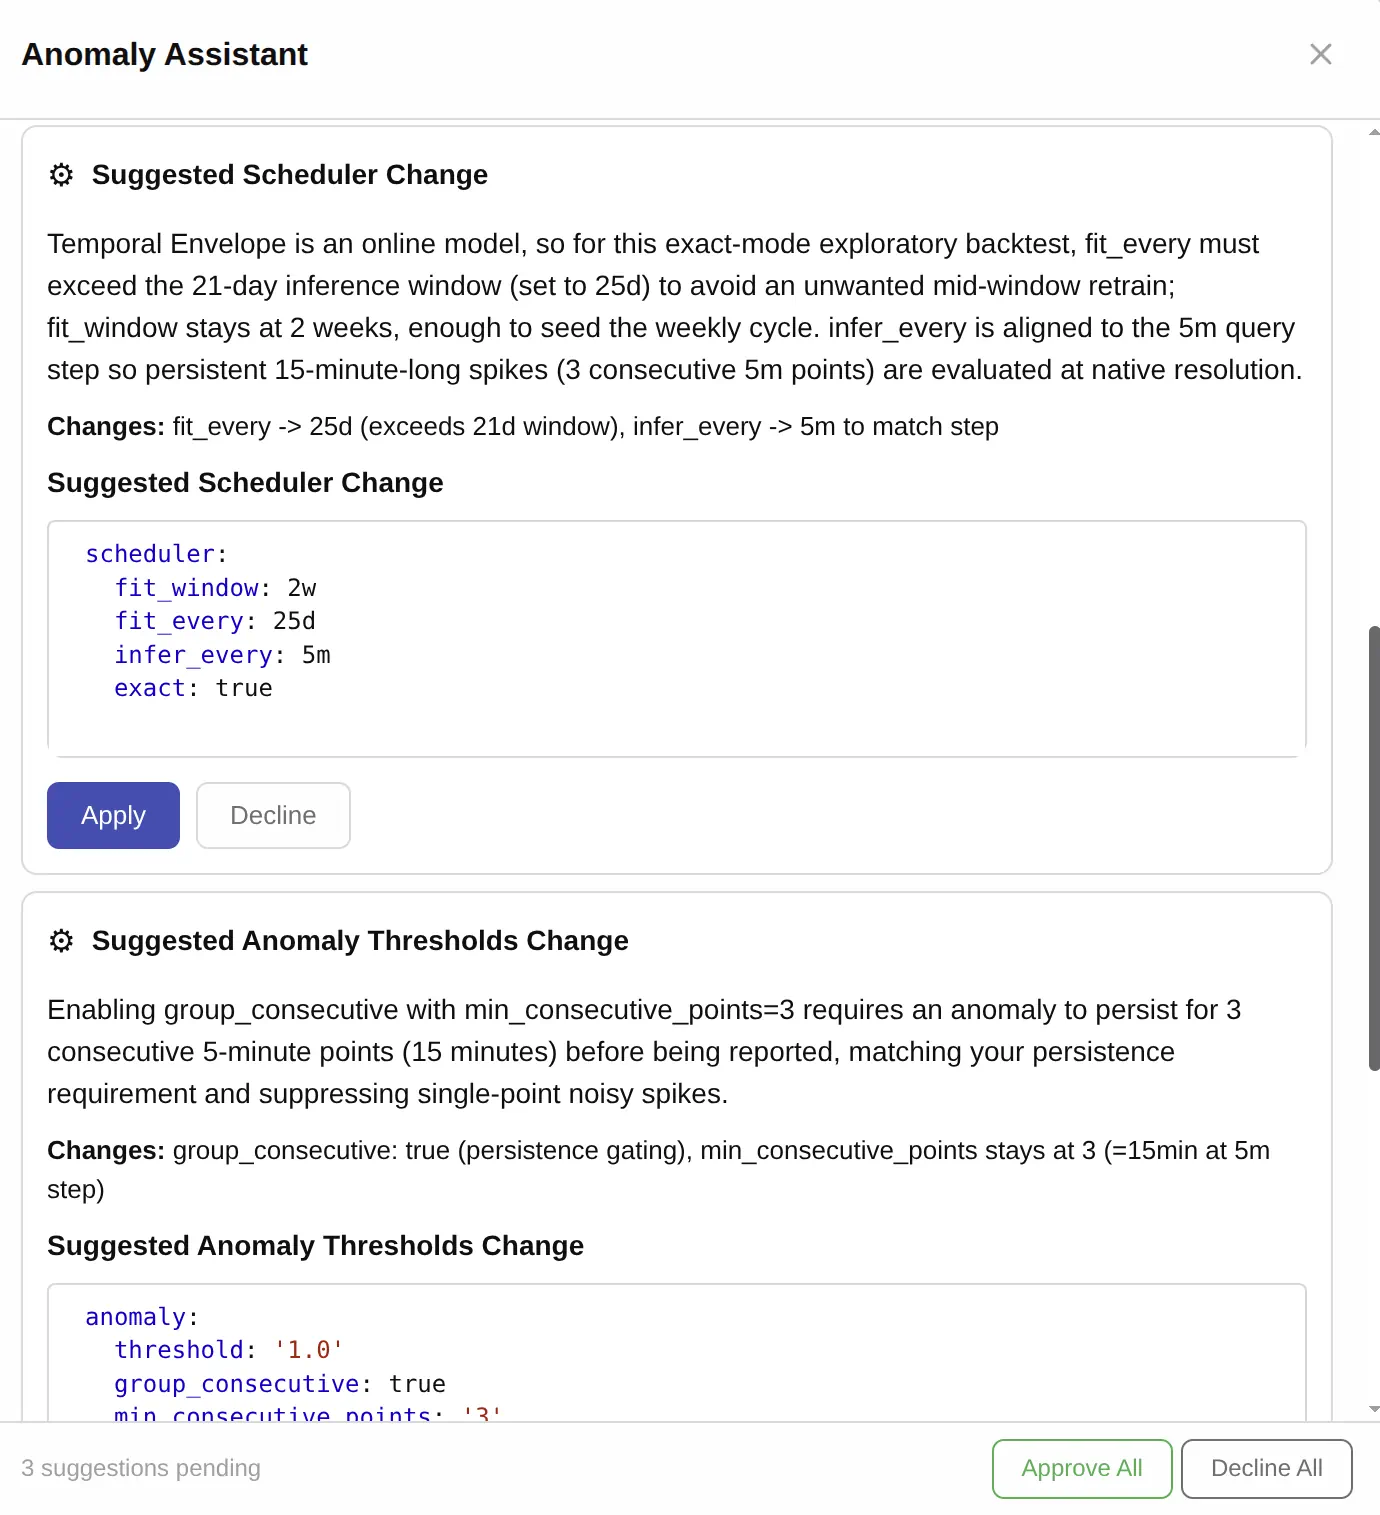
Once the user confirms, refines, or rejects the proposed changes, the accepted updates are applied automatically, updating the UI state and drastically reducing manual effort.
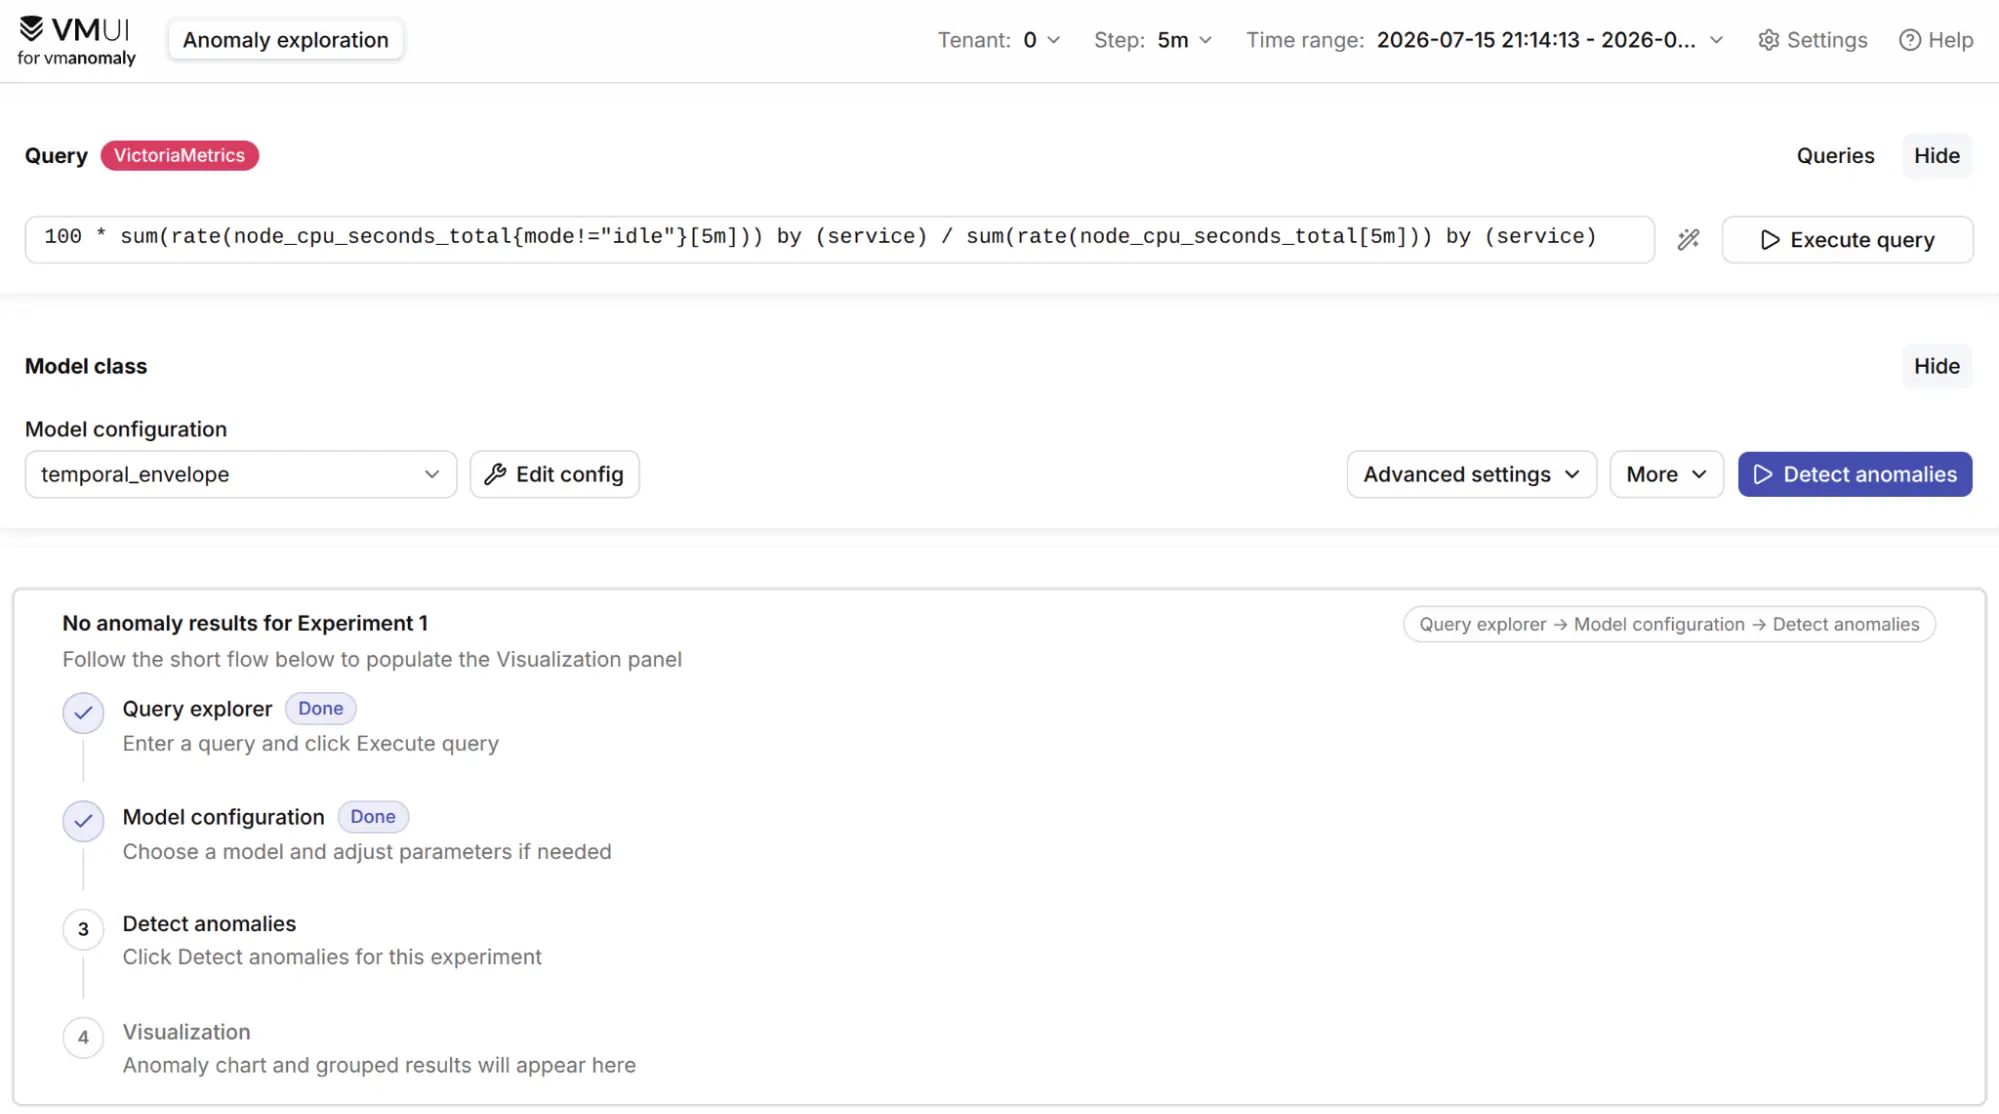
The only remaining step is to click “Detect anomalies” and review the results. The user can then verify that the business constraints are respected and that the anomaly rate remains within the configured limit—which in the example is 0.2%, well below the 2% threshold.
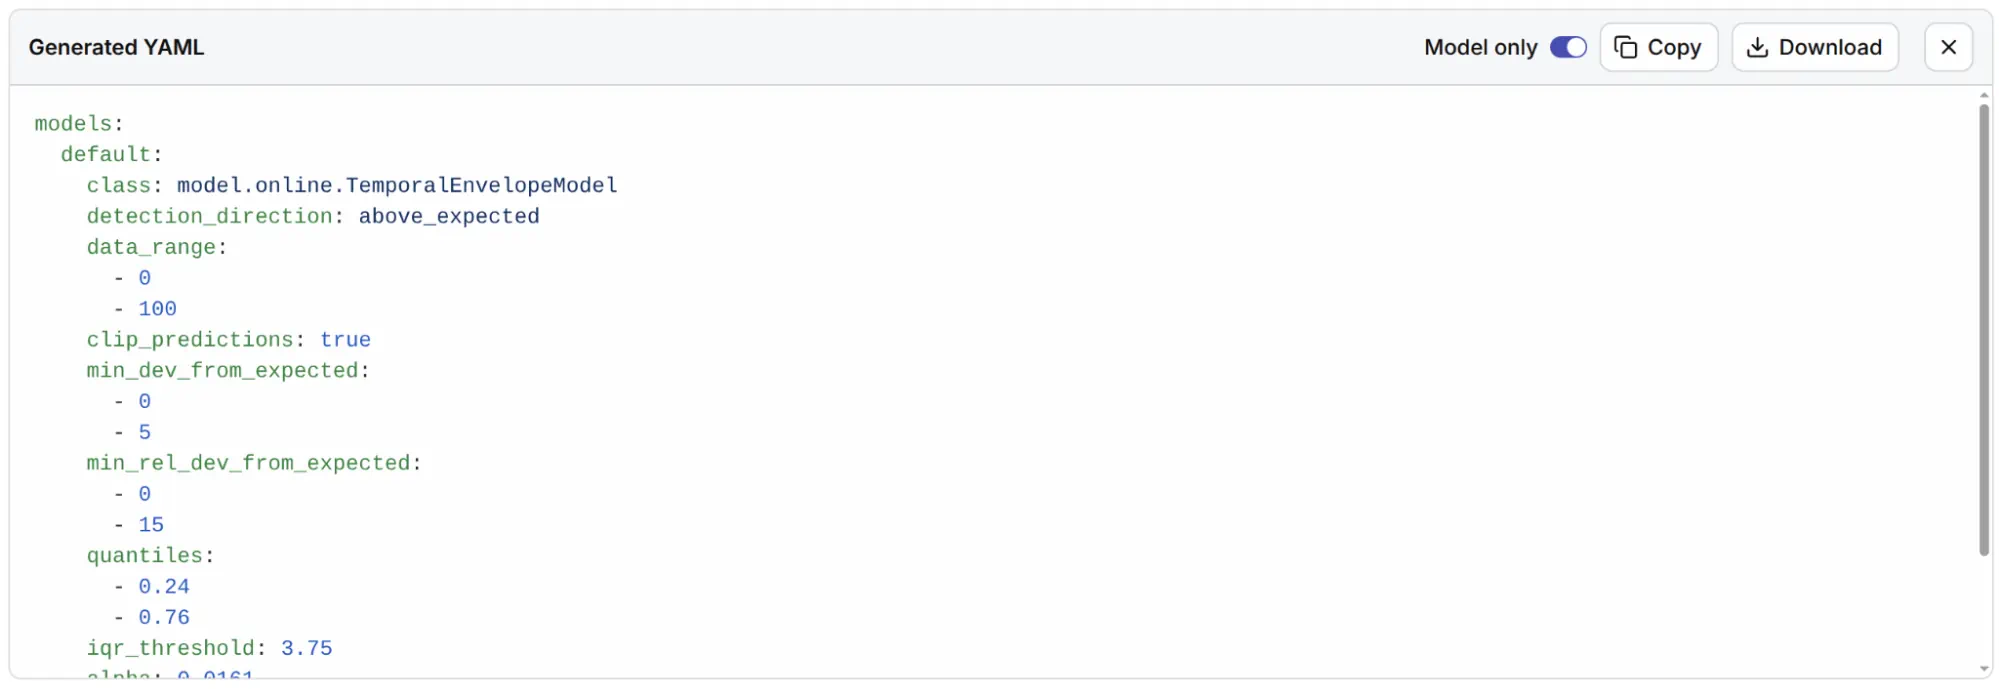
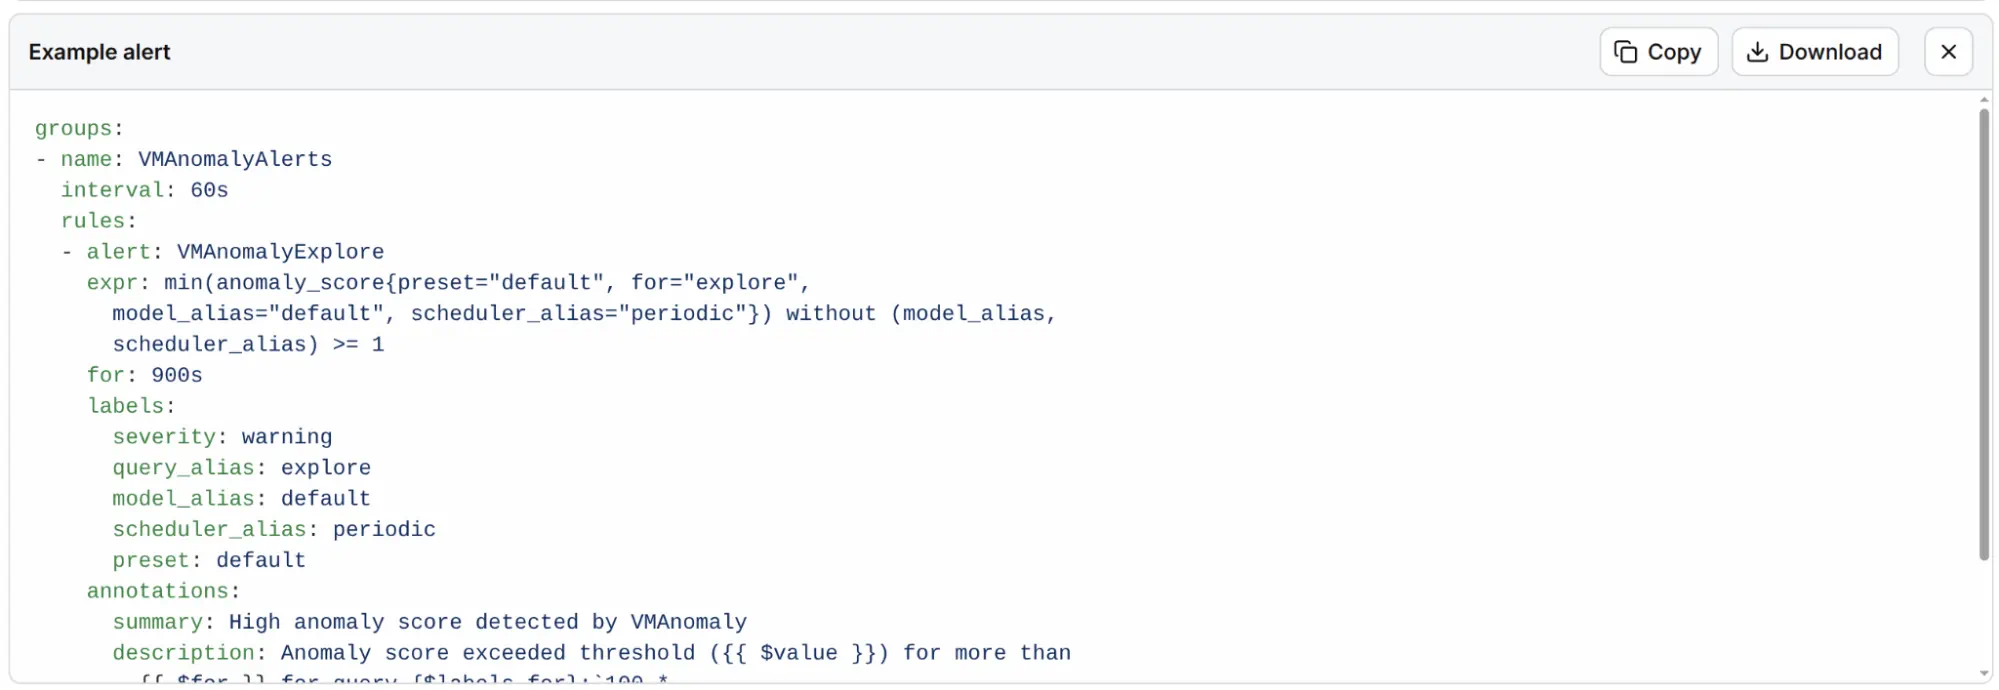
Once the experiments produce satisfactory results, the generated vmanomaly service configuration and accompanying anomaly_score-based vmalert rules can be copied directly into production jobs.
Ready to explore more?
#
You can interact directly with live, automated tracing and metrics setups using these public developer environments:
- Metrics Sandbox UI: Explore anomaly detection on pure time-series data.
- Distributed Traces Sandbox UI: Operate on traces-to-metrics data to enrich metrics context.
- MCP GitHub repository: Inspect the underlying operational code or roll out a quick containerized proof of concept by visiting the official mcp-vmanomaly GitHub repository.
- Equip your LLMs with VictoriaMetrics skills to detect, investigate, and respond to anomalies while automating everyday observability workflows.
- Workshop OpenTelemetry and anomaly detection with VictoriaMetrics: Explore OpenTelemetry and anomaly detection with VictoriaMetrics through a hands-on workshop that includes practical examples, Grafana dashboards, and guided setup materials.
Conclusion
#
Always remember: anomaly detection isn’t a replacement for standard alerting, dashboards, or service-level objectives (SLOs); it is a tool meant to live alongside them. By letting machine learning models learn what “normal” behavior looks like for your unique code paths and workflows while incorporating clear domain expectations, you can cut out the noise and reclaim your engineering time to focus on building features rather than firefighting outages.
Resources
#
- Get a free vmanomaly trial license.
- Anomaly Detection for Time Series Data: An Introduction (Part 1).
- Anomaly Detection for Time Series Data: Anomaly Types (Part 2).
- Anomaly Detection for Time Series Data: Techniques and Models (Part 3).
- News and updates about anomaly detection from VictoriaMetrics.
- Explore the vmanomaly documentation.
- Try the vmanomaly MCP server.
- Equip your LLMs with VictoriaMetrics skills.
Frequently Asked Questions
#
How do VictoriaMetrics skills help engineers work with observability data? VictoriaMetrics skills provide reusable instructions and workflows for anomaly detection and observability tasks. They help engineers investigate telemetry, generate appropriate queries, review alerting rules, validate configurations, and follow common operational procedures more consistently.
What role does MCP play in AI-powered observability? The Model Context Protocol (MCP) provides a standardized integration layer between AI clients and observability services. It enables access to production queries, documentation, model information, time-series data, alerting rules, and service endpoints through a unified interface.
Can AI automatically configure anomaly detection models? Yes. AI can analyze historical telemetry, recommend an appropriate model class, apply business-specific constraints (such as detection direction and anomaly thresholds), tune hyperparameters, validate the configuration, and even propose corresponding UI changes before deployment. Human approval is still required before changes are applied.
How do natural-language workflows lower the onboarding barrier? Developers can describe their monitoring goals in everyday language without needing deep machine learning expertise, detailed product knowledge, or the ability to manually write complex queries and API requests. The AI assistant translates those goals into queries, model recommendations, and validated configurations, making anomaly detection easier to adopt.
Will AI replace traditional monitoring and alerting? No. AI-driven anomaly detection complements existing dashboards, alerts, and SLOs rather than replacing them. Machine learning helps identify unusual behavior more intelligently, while traditional monitoring remains essential for comprehensive observability.
Leave a comment below or Contact Us if you have any questions!
comments powered by Disqus
You might also like:
What's new in VictoriaMetrics Anomaly Detection (Q2 2026)
The Q2 2026 vmanomaly update introduces Temporal Envelope, a redesigned UI, faster online-model execution, and an AI-assisted workflow that turns natural-language monitoring goals into tested configurations and alerting rules.
What's new in VictoriaMetrics Anomaly Detection (Q1 2026)
Q1 2026 brought incremental but important updates to VictoriaMetrics Anomaly Detection: UI improvements, AI assistance inside the UI, a public traces playground, new false-positive reduction controls, and continued resource optimizations.
VictoriaMetrics Anomaly Detection: What's New in Q3 2024?
Explore the latest improvements in VictoriaMetrics Anomaly Detection (vmanomaly), including optimizations, online models, multitenantcy and mTLS support.