- Blog /
- Observability Lessons NVIDIA and CoreWeave
Observability Lessons NVIDIA and CoreWeave
Share:


The best thing that can happen to an open-source project is to find its way into some of the world’s largest technology companies. In September 2026, this happened twice in one week: VictoriaMetrics is now officially bundled in the self-managed edition of NVIDIA’s Cloud Functions, and I learned that CoreWeave is using VictoriaMetrics as the metrics backend for all of its infrastructure customers. Both companies adopted VictoriaMetrics independently. In fact, we just found out about these integrations.
Like the time OpenAI chose our observability stack for their internal development or Airbnb used vmagent to aggregate 100 million samples per second, I’m delighted to see how people are using our projects. This is a perfect example of open source being great at marketing.
Both companies use VictoriaMetrics for more than dashboards: at NVIDIA it drives an autoscaler, and at CoreWeave it feeds an AI agent.
NVIDIA Cloud Functions Autoscaling
#
NVIDIA Cloud Functions (NVCF) is NVIDIA’s platform for running GPU workloads as functions. You package an inference model, and NVCF routes requests to GPU workers that can serve it. NVIDIA’s self-managed edition brings the same platform to your own Kubernetes clusters, and NVCF Release 1.0.1 ships with a single-node VictoriaMetrics chart as the default for metrics storage.
A metrics backend in a platform like this usually ends up behind a Grafana dashboard. But NVCF does something entirely different; it uses VictoriaMetrics data for autoscaling. A component called Function Autoscaler reads invocation metrics and queue depth to scale the required GPU instances for each function.
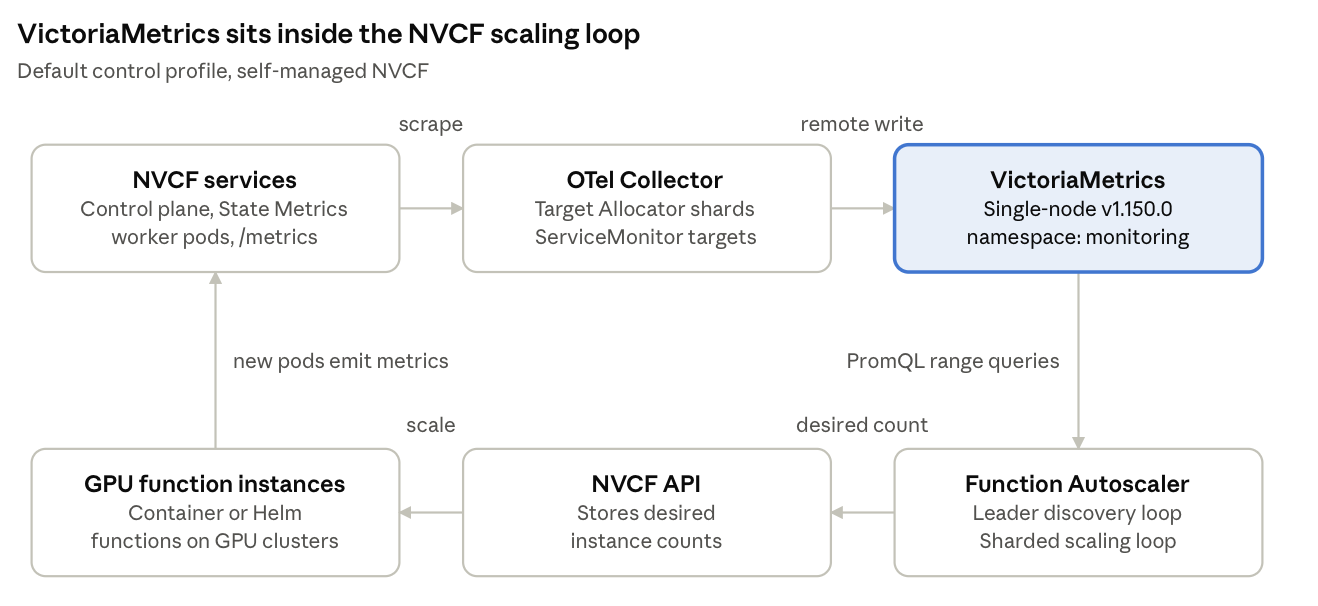
Interestingly, NVIDIA doesn’t force VictoriaMetrics on their users. The stack collects metrics with the OpenTelemetry Collector and forwards them using open protocols. But NVIDIA did choose VictoriaMetrics as the default metrics backend. The release notes don’t say why NVIDIA chose VictoriaMetrics, but I can think of a few reasons:
- Simplicity: VictoriaMetrics runs as a single binary with no external dependencies.
- Efficiency: A metrics store that uses less RAM and disk than Prometheus leaves more free resources on the cluster for work.
- Reliability: metrics need to be reliable. If the backend is down, scaling stops. That makes VictoriaMetrics a critical moving part of NVCF. VictoriaMetrics is designed to survive unclean shutdowns without corrupting data, and it restarts in seconds.
- License: VictoriaMetrics is Apache 2.0, so NVIDIA can bundle and redistribute it in its stack freely.
CoreWeave’s Condensation Conundrum
#
CoreWeave sells an AI cloud such as GPU clusters, managed Kubernetes, and storage. The company rents GPUs to AI labs to train and serve models. CoreWeave exposes infrastructure telemetry to its customers as part of the platform, and the company describes its VictoriaMetrics deployment as one of the largest in the world.
That fact alone would be worth a blog post, but CoreWeave’s Mission Control Agent announcement had an even better story: one about AI, metrics, and psychrometrics.
The Psychrometrics Dashboard
#
On September 24, 2026, CoreWeave Mission Control MCP became generally available, so customers can connect AI tools like Claude to do things such as query metrics, access logs, or read documentation.
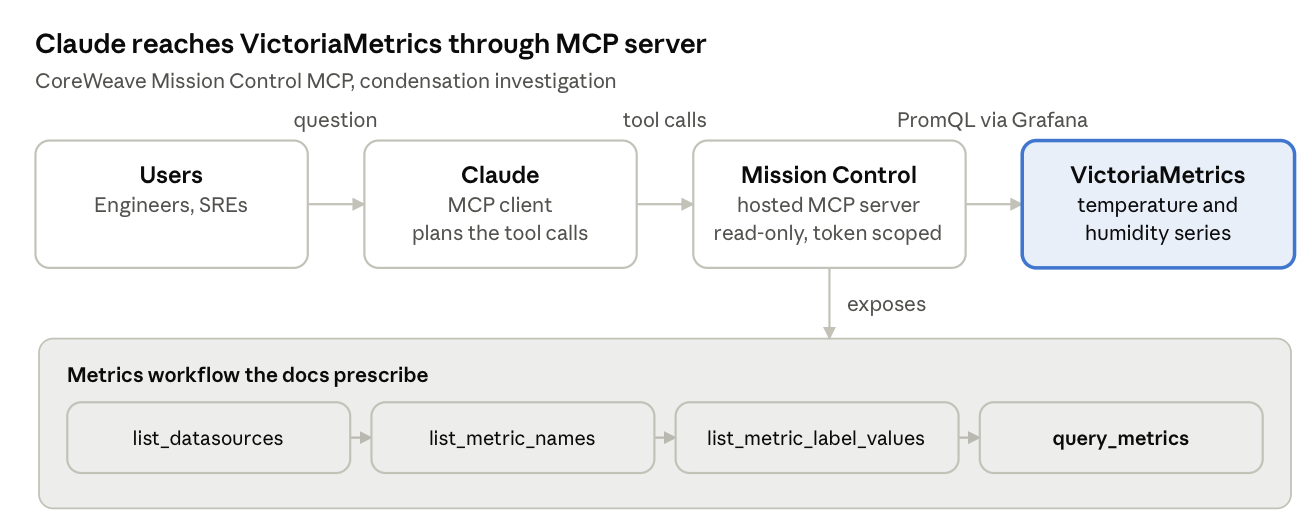
Rick Donohue, a facilities engineer at CoreWeave, used that MCP connection to investigate condensation risks in the company’s data centers. Condensation forms on any surface colder than the air’s dew point, such as cooling pipes near GPUs (as we know, water and electronics don’t mix well).
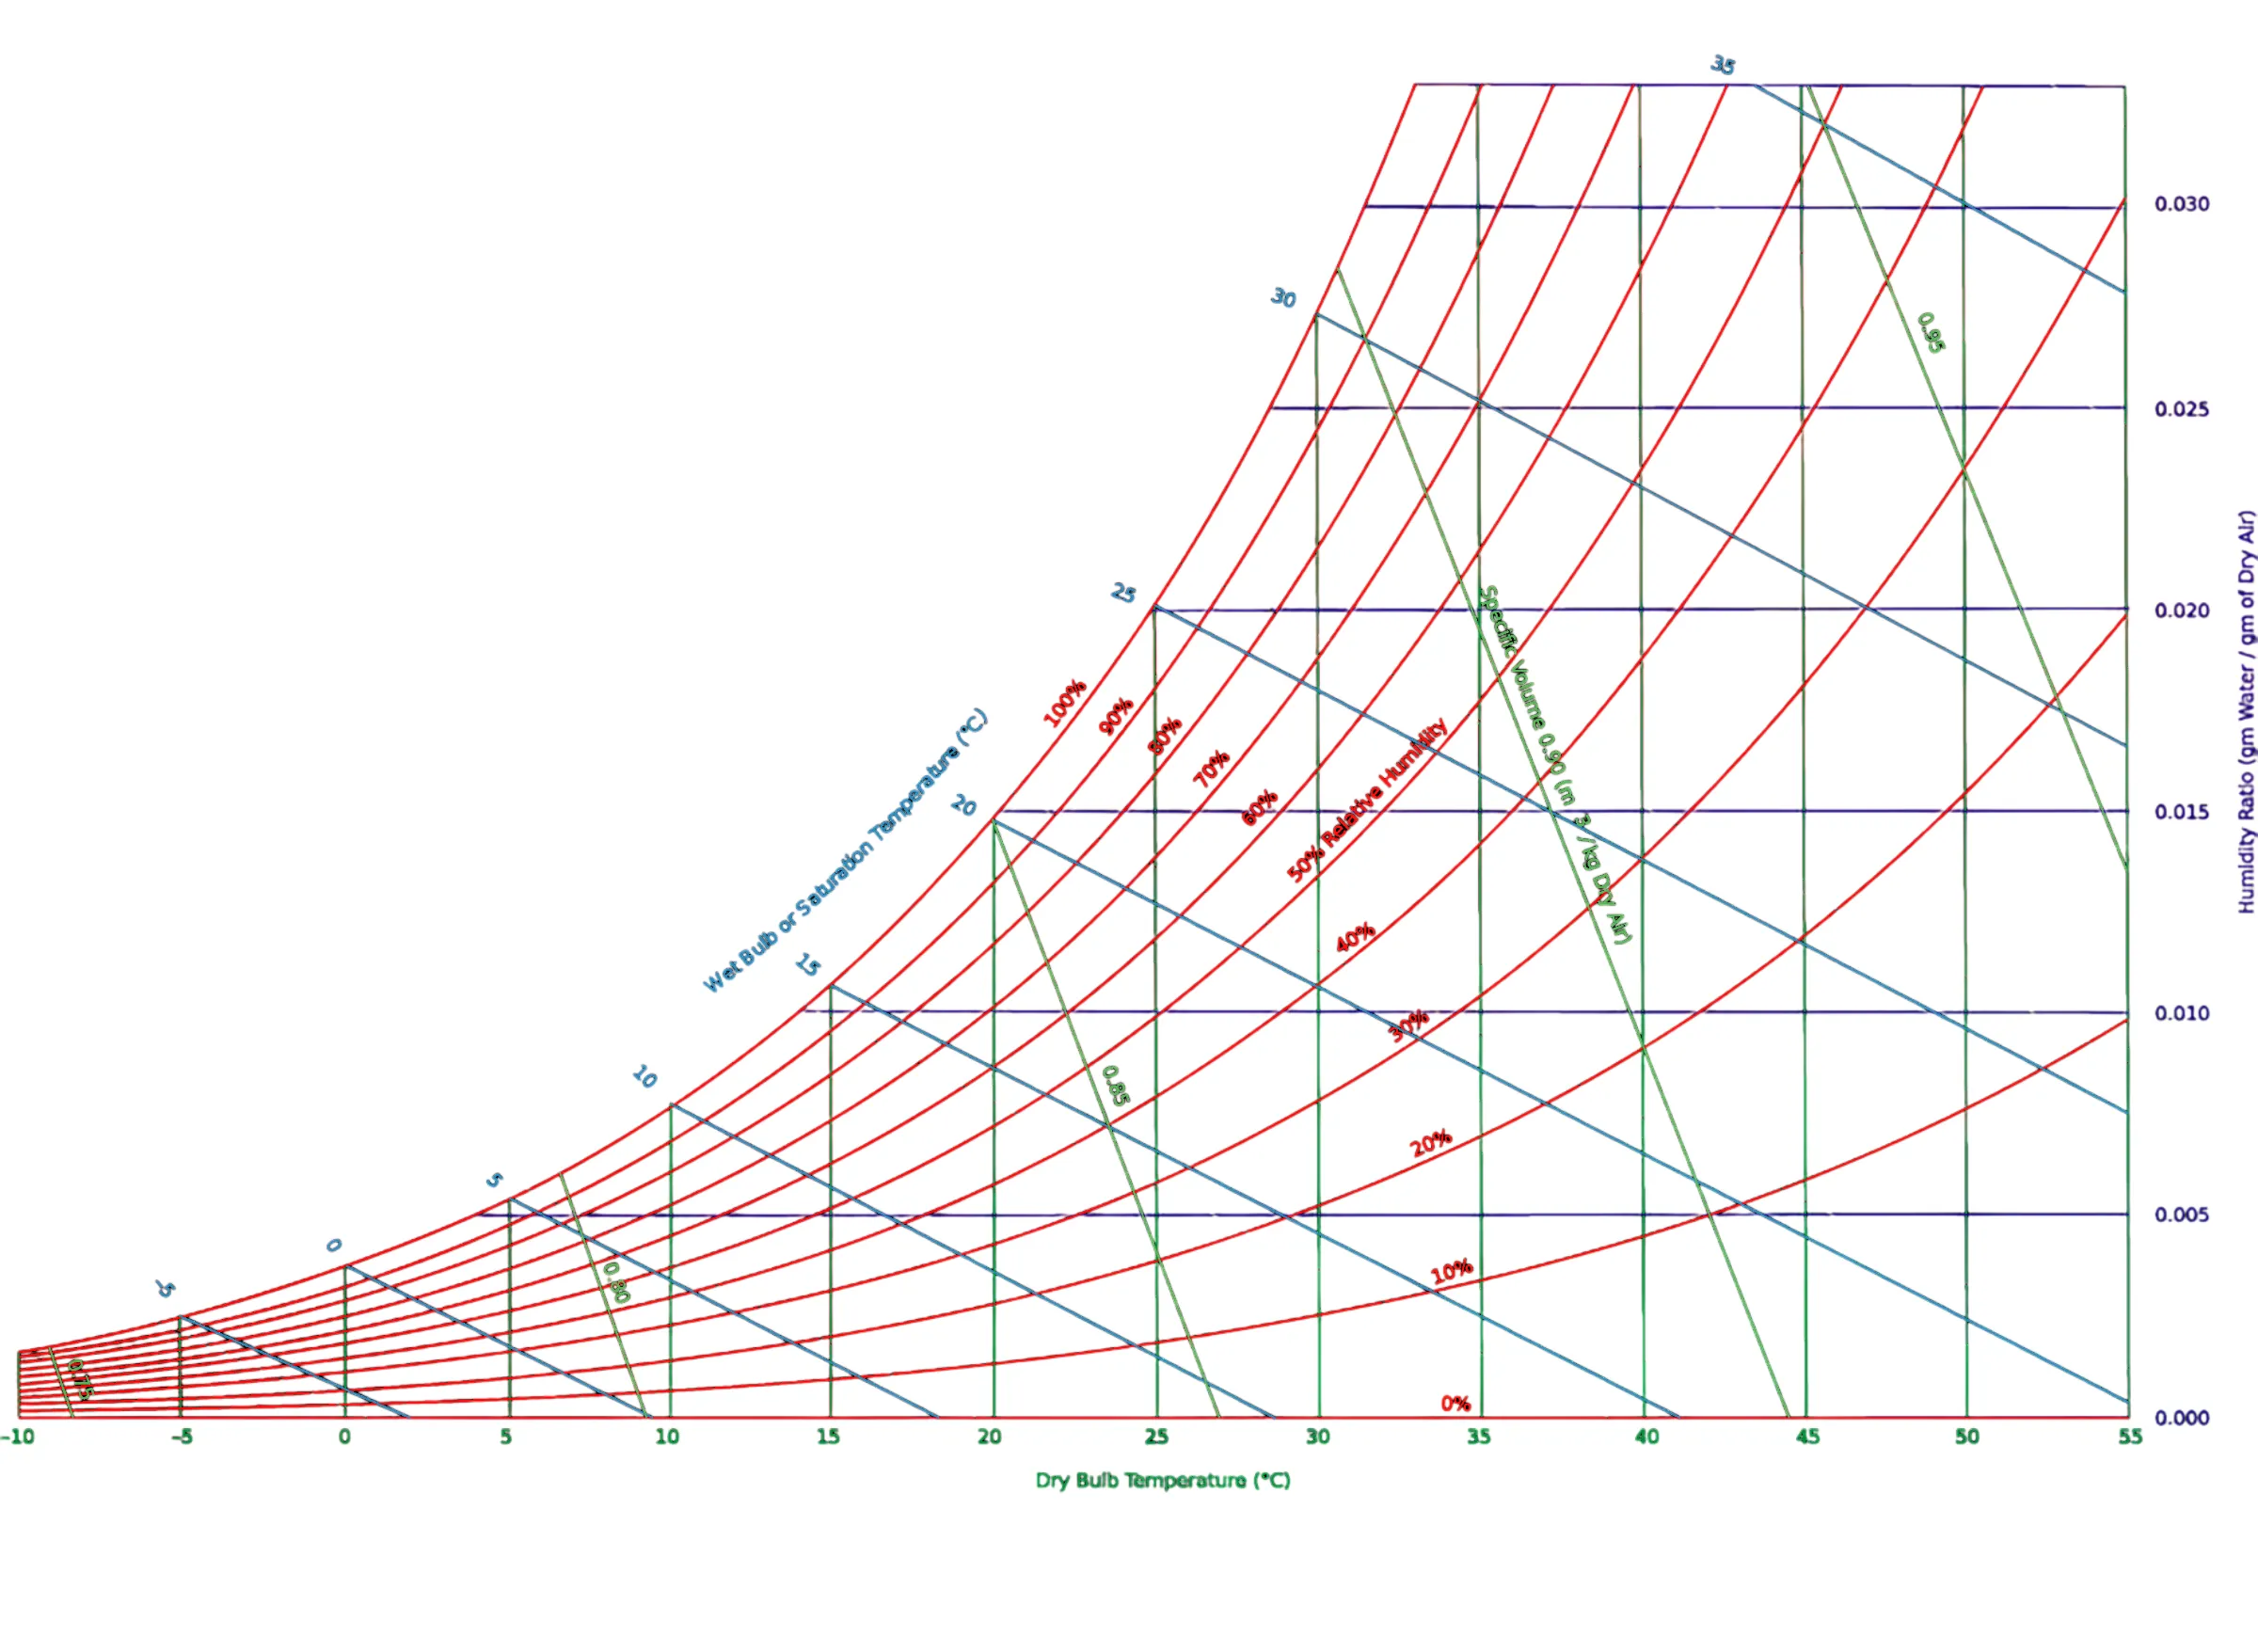
Rick knew the physics and knew CoreWeave was already collecting temperature and humidity readings. What he needed was a way to dig through them. Claude queried VictoriaMetrics, identified readings approaching condensation conditions, and generated the JavaScript code to create a psychrometric chart in a dashboard. A psychrometric chart maps the thermodynamic properties of moist air, so Rick could see at a glance which conditions were drifting toward condensation.
Closing Thoughts
#
We built a fast, open-source, Prometheus-compatible metrics store and put it where anyone could use it. NVIDIA chose it as the default for its GPU platform, and CoreWeave used it as their metrics backend. This goes to show just how far and deep open source can travel.
If you run VictoriaMetrics somewhere interesting, we’d like to hear about it. Star the repository, try our own MCP server, or tell us your story in the comments or our Slack channel.
Leave a comment below or Contact Us if you have any questions!
comments powered by Disqus
You might also like:
Observability for LLM Apps and Agents: OpenLIT SDK + VictoriaMetrics observability stack
See practical examples on monitoring LLM applications and Agents with OpenLIT and VictoriaMetrics observability stack. See real examples of the deployment manifests, alerting rules and Grafana dashboard.
Observability Lessons From OpenAI
OpenAI applies observability to autonomous AI agents using the VictoriaMetrics Stack and OpenTelemetry. Learn to build your own local setup with metrics, logs, and traces that help LLMs test, benchmark, and iterate autonomously.
AI Agents Observability with OpenTelemetry and the VictoriaMetrics Stack
Learn how to add observability to AI agents using OpenTelemetry and the VictoriaMetrics Stack. This guide explains how to instrument popular LLM frameworks and visualize metrics, logs, and traces in Grafana.