- Blog /
- Observability Lessons From OpenAI
Observability Lessons From OpenAI
Share:


Writing code is moving from the good old IDE into the realm of autonomous AI agents. One example of this is OpenAI, which has been developing internally with 0 lines of manually written code. You can read about their workflow in their engineering blog: Harness engineering: leveraging Codex in an agent-first world.
For me, the main takeaway of OpenAI’s article is how AI has rewritten the constraints equation. An AI Agent, such as Codex, can run for hours without human supervision, generating code at a speed no developer or QA specialist can keep up with. Human supervision is now the bottleneck.
Observability Harness
#
If humans cannot review code fast enough, we need to automate testing and QA as much as possible. And this is what a thought-out harness does.
In the context of AI agents, the harness is all the “scaffolding” that wraps around an LLM to make it functional, durable, and capable of autonomous, multi-step actions. What OpenAI did is augment their harness with the VictoriaMetrics Observability Stack, giving agents access to metrics, logs, and traces.
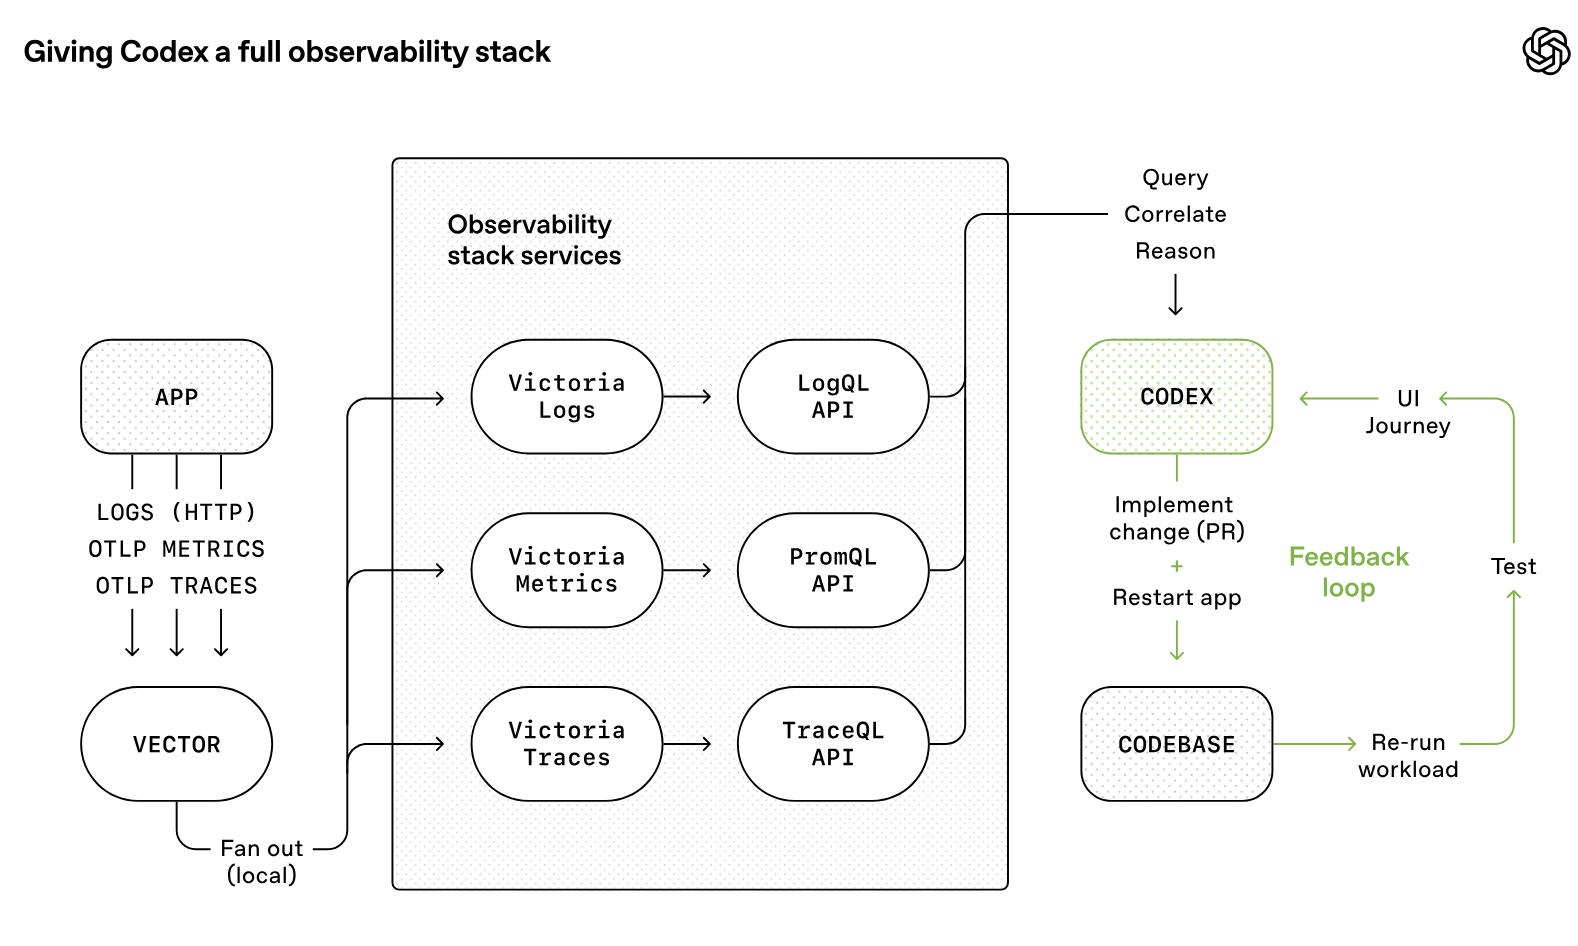
Logs, metrics, and traces are exposed to Codex via a local observability stack that’s ephemeral for any given worktree. […] Agents can query logs with LogsQL and metrics with PromQL. With this context available, prompts like “ensure service startup completes in under 800ms” or “no span in these four critical user journeys exceeds two seconds” become tractable. Source: https://openai.com/index/harness-engineering/
If we provide the observability infrastructure, we can record metrics, logs, and traces during testing, allowing AI agents to run benchmarks and iterate on improvements.
Observability with VictoriaMetrics
#
We don’t know how OpenAI has implemented observability for its Codex agents; that part isn’t covered in the article. We can, however, reproduce the setup for local development with Docker.
All you need is a Docker Compose file. We can take the docker-compose.yml that Alexander used in his post “AI Agents Observability with OpenTelemetry and the VictoriaMetrics Stack” as a starting point.
In this case, I just removed the volumes since we don’t need persistent storage; the telemetry is deleted when the containers stop.
# docker-compose.yml

services:

  otel-collector:
    image: ghcr.io/open-telemetry/opentelemetry-collector-releases/opentelemetry-collector-contrib:0.133.0
    command: [ "--config=/etc/otel-collector-config.yml" ]
    ports: [ "4317:4317", "4318:4318" ]
    configs: [ { source: "otel-collector-config", target: "/etc/otel-collector-config.yml", mode: 0444 } ]

  victoriametrics:
    image: victoriametrics/victoria-metrics:v1.130.0
    ports: [ "8428:8428" ]
    command: [ "--storageDataPath=/storage", "--opentelemetry.usePrometheusNaming=true" ]

  victorialogs:
    image: victoriametrics/victoria-logs:v1.47.0
    ports: [ "9428:9428" ]
    command: [ "--storageDataPath=/vlogs" ]

  victoriatraces:
    image: victoriametrics/victoria-traces:v0.7.1
    ports: [ "10428:10428" ]
    command: [ "--storageDataPath=/vtraces", "--servicegraph.enableTask=true" ]

configs:
  otel-collector-config:
    content: |
      receivers:
        otlp:
          protocols:
            http:
              endpoint: "otel-collector:4318"
              cors:
                allowed_origins: [ "http://*", "https://*" ]
      exporters:
        otlphttp/victoriametrics:
          metrics_endpoint: "http://victoriametrics:8428/opentelemetry/v1/metrics"
          tls:
            insecure: true
        otlphttp/victorialogs:
          logs_endpoint: "http://victorialogs:9428/insert/opentelemetry/v1/logs"
          tls:
            insecure: true
        otlphttp/victoriatraces:
          traces_endpoint: "http://victoriatraces:10428/insert/opentelemetry/v1/traces"
          tls:
            insecure: true
      service:
        pipelines:
          traces: { receivers: [ otlp ], exporters: [ otlphttp/victoriatraces ] }
          metrics: { receivers: [ otlp ], exporters: [ otlphttp/victoriametrics ] }
          logs: { receivers: [ otlp ], exporters: [ otlphttp/victorialogs ] }
Here, we’re using four components for observability. First, VictoriaMetrics, VictoriaLogs, and VictoriaTraces listen for the metrics, logs, and traces, respectively. Then we use OpenTelemetry to route each signal to the appropriate destination.
The Observability-Powered Loop
#
With VictoriaMetrics Observability Stack in place, the development loop turns into:
- Start the observability stack:
docker compose up
- Run your tests or start your application. Here you can run anything: unit tests, end-to-end tests, non-functional tests, and performance benchmarks. Everything and anything you want to measure.
- Once done, retrieve telemetry from the API. For instance:
- Metrics:
curl -sG 'http://localhost:8428/api/v1/query?query=app_latency_ms_sum' - Logs:
curl -sG 'http://localhost:9428/select/logsql/query?query=*' - Traces:
curl -sG 'http://localhost:10428/select/jaeger/api/traces?service=otel-example'
- Metrics:
- Stop VictoriaMetrics, wiping the recorded data:
docker compose down -v
- Rinse and repeat: the agents use all gathered data to decide what to do next.
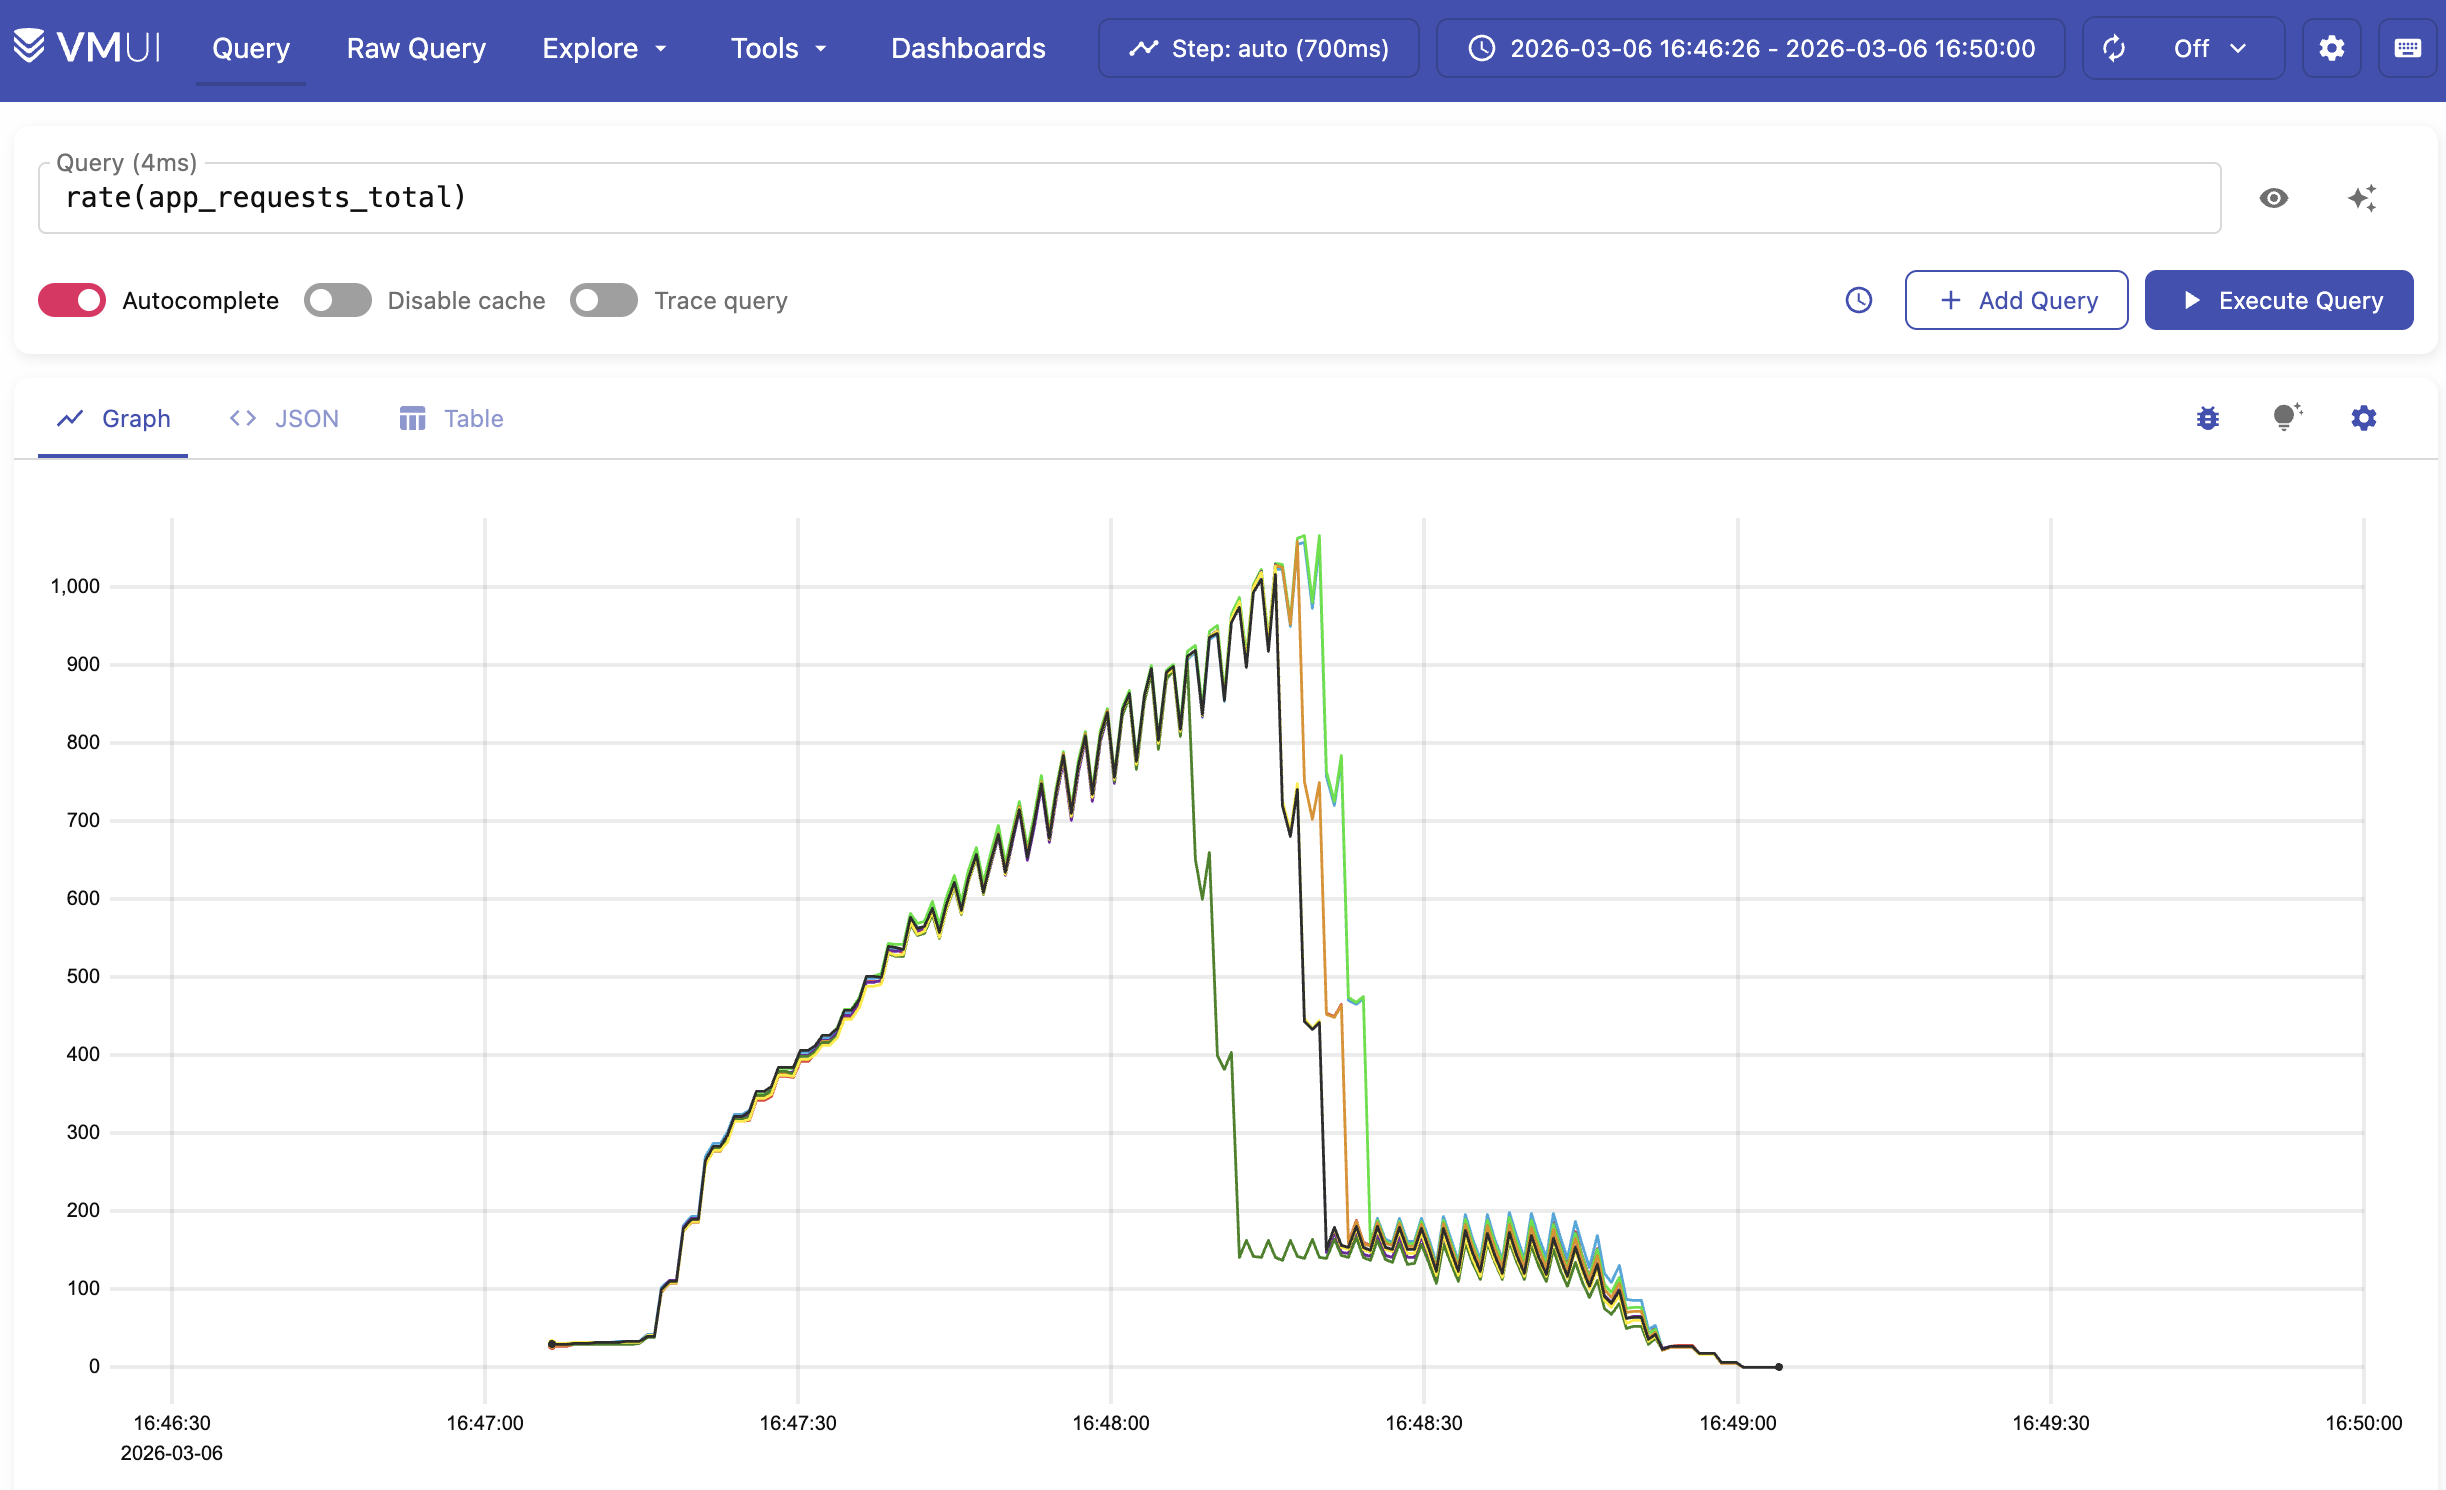
You can delegate all this setup to your AI agent. For me, Codex dumped everything into a single JSON file and used it as context for the next iteration. It even generated screenshots for human review.
What’s Next?
#
The beauty of this setup is that you don’t need to rip out the observability in your code once it ships. You can leave all the instrumentation in place, change the endpoint to your production observability stack, and now you have visibility into your deployed application.
Adding telemetry to the AI context opens new possibilities, to name a few:
- AI agents can add benchmark results to their pull requests
- You can implement quality gates by running tests in CI and failing on performance drops
- Or leave the VictoriaMetrics Observability Stack up after tests and do a bit of manual exploration.
- Or maybe plug in the VictoriaMetrics MCP Server for a more AI-native access.
If you’re interested in observability and AI, you will find these articles interesting:
- AI Agents Observability with OpenTelemetry and the VictoriaMetrics Stack
- Vibe coding tools observability with VictoriaMetrics Stack and OpenTelemetry
- Check out the VictoriaMetrics AI Tools
Leave a comment below or Contact Us if you have any questions!
comments powered by Disqus