- Blog /
- Not All Telemetry Requires Premium Pricing
Not All Telemetry Requires Premium Pricing
Share:


Summary: Not all telemetry deserves premium pricing. This article explains how teams can use hybrid observability to keep high-value signals, such as SLOs, alerts, dashboards, and business-critical metrics, in SaaS tools while moving high-volume diagnostic telemetry to a more cost-effective backend. We also break down practical ways to separate and route telemetry data, including splitting signals by value and centralizing data before forwarding only what needs premium visibility. The goal is to support data observability with cost optimization, helping teams preserve the monitoring and troubleshooting data they need without sending every metric, log, and trace through the most expensive pipeline.
Observability in software is often framed as a choice between self-hosted and SaaS: manage it yourself, or pay a vendor to handle your data.
Both self-hosted and SaaS approaches have their merits, but assuming you must choose one exclusively over the other leads to poor trade-offs: either overcommitting to an all-in-one SaaS despite spiraling costs, or fully self-hosting when it’s unnecessary.
Observability shouldn’t be a binary choice. A hybrid observability strategy can let you keep the signals that matter most in your favorite SaaS while running a self-hosted backend for high‑volume telemetry that doesn’t need to live in a premium-priced pipeline. The tricky part is knowing where to draw the line, and this article will help you figure out exactly that.
How to Reduce Observability Costs in 2026
#
A 2026 analysis of 47 companies using managed SaaS observability reported that initial estimates underestimate total cost once host count, ingestion, retention, and product add-ons are included.
As we onboard more systems, increase log verbosity, and add labels, observability expenses can creep up to the point where they rival the cost of the infrastructure being monitored.
Flying Blind
#
Spiraling costs force difficult choices on us: should we log less data or shorten retention? Do we really need to retain telemetry for services and non-critical business functions that don’t drive revenue? Who knows?
The problem is that nobody knows; it’s impossible to know what you’ll need on a bad day. A good reminder of the dangers of flying blind is GitLab’s 18-hour outage. Only after accidentally deleting a primary database did GitLab’s engineers discover that the backup system had been failing silently for a long time, unnoticed. There were no dashboards or metrics tracking backup success rates, completion times, or data integrity — only the email alerts that nobody saw.
“While notifications are enabled for any cronjobs that error, these notifications are sent by email. For GitLab.com we use DMARC. Unfortunately DMARC was not enabled for the cronjob emails, resulting in them being rejected by the receiver. This means we were never aware of the backups failing, until it was too late.”
Prioritize Revenue-Driving Signals First
#
Instead of deciding which data to keep and drop, divide telemetry into two tiers: decision-tier and diagnostic-tier.
Decision-tier signals directly impact customer experience or revenue, such as SLOs for key user journeys, business KPIs, uptime, latency, error budgets, checkout success, and payment failures.
Diagnostic-tier signals support running and debugging the system, but have indirect or episodic business impact. Useful for on-call engineers and performance work.
To determine if a signal is decision or diagnostic, you can evaluate it across several dimensions:
- Business relevance: How directly does this signal map to user experience or revenue? SLO/SLI metrics for key flows (checkout latency, login error rate, API availability) sit at the top of this dimension and are classic decision signals.
- Cost to store and process: How expensive is this signal under your current pricing model? Does its cost align with the value it provides?
- Operational criticality: How often do you need this metric to keep the system healthy, versus only during deep debugging sessions?
- Audience: Who actually looks at this metric? If product, leadership, or customer-facing teams rely on it, that’s a strong decision signal.
- Single-pane-of-glass necessity: Does this signal need to live in your main SaaS dashboard, or can it stay in a separate, engineering‑focused dashboard?
Hybrid Observability
#
Once you start thinking of signals as decision and diagnostic tiers, the next step is to plan your hybrid setup. For this, we set up a second cost‑efficient, high‑performance observability backend, such as the VictoriaMetrics Stack, which lets you afford far more retention and detail without paying per‑metric premiums.
The VictoriaMetrics Observability Stack gives you an open‑source home for all three pillars of observability:
- VictoriaMetrics: fast, cost-effective time series database for metrics.
- VictoriaLogs: fast, resource-efficient log database.
- VictoriaTraces: database designed for storing and querying distributed tracing data.
There are two key ways to practically implement this hybrid model: Split by Signal and Centralize and Forward. Let’s see how each works next.
Split by Signal
#
In the “Split by Signal” strategy, we split the signal destination at the collector layer. Every exporter, agent, or collector sends decision signals to your SaaS and the rest to the VictoriaMetrics Observability Stack, using routing rules to send each signal to their assigned backend.
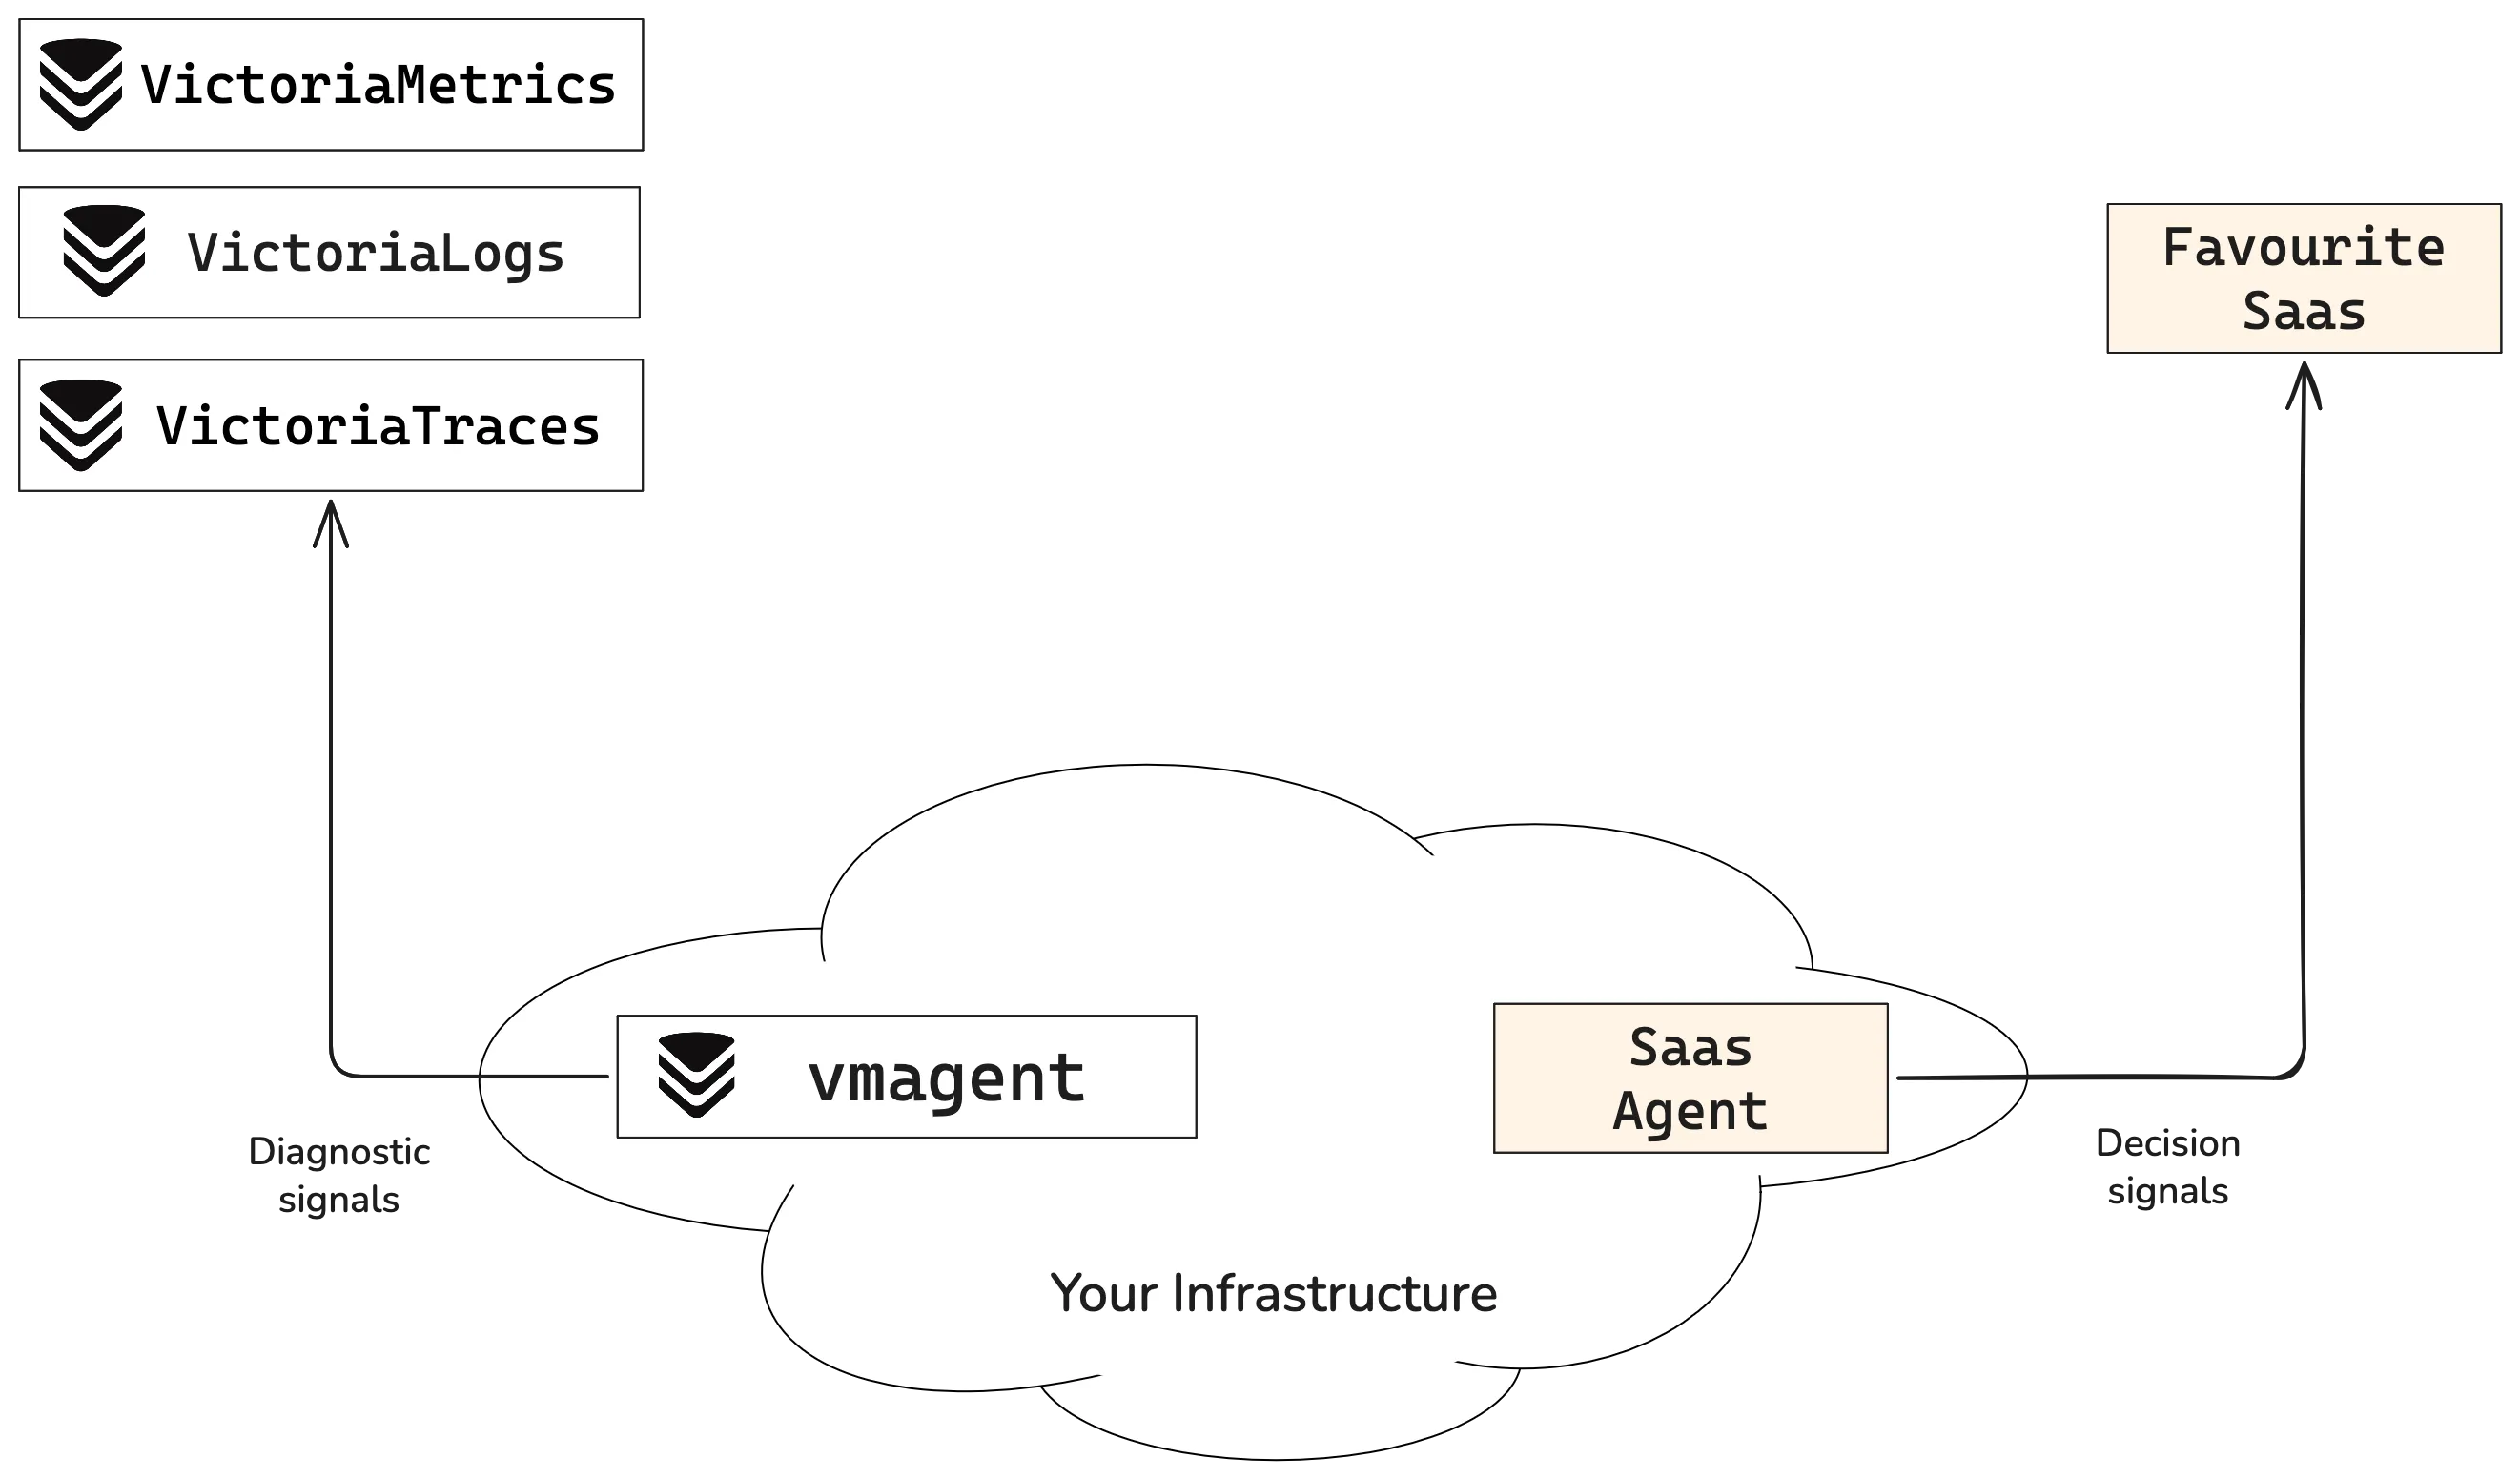
“Split by Signal” can be implemented piecemeal, starting small and switching your diagnostic metrics a few at a time as needed. It’s a good way to try out what self-hosting your observability platform feels like.
The flip side of this approach is that switching signals between backends is not as easy as flipping a switch, as it usually involves updating multiple configs. The other thing to consider is that we now have two separate dashboards, which means we must remember where each system lives, making it harder to correlate events across systems.
Centralize and Forward
#
With this approach, centralize all signals in the VictoriaMetrics Observability Stack and then forward only the decision-tier metrics to our SaaS provider of choice.
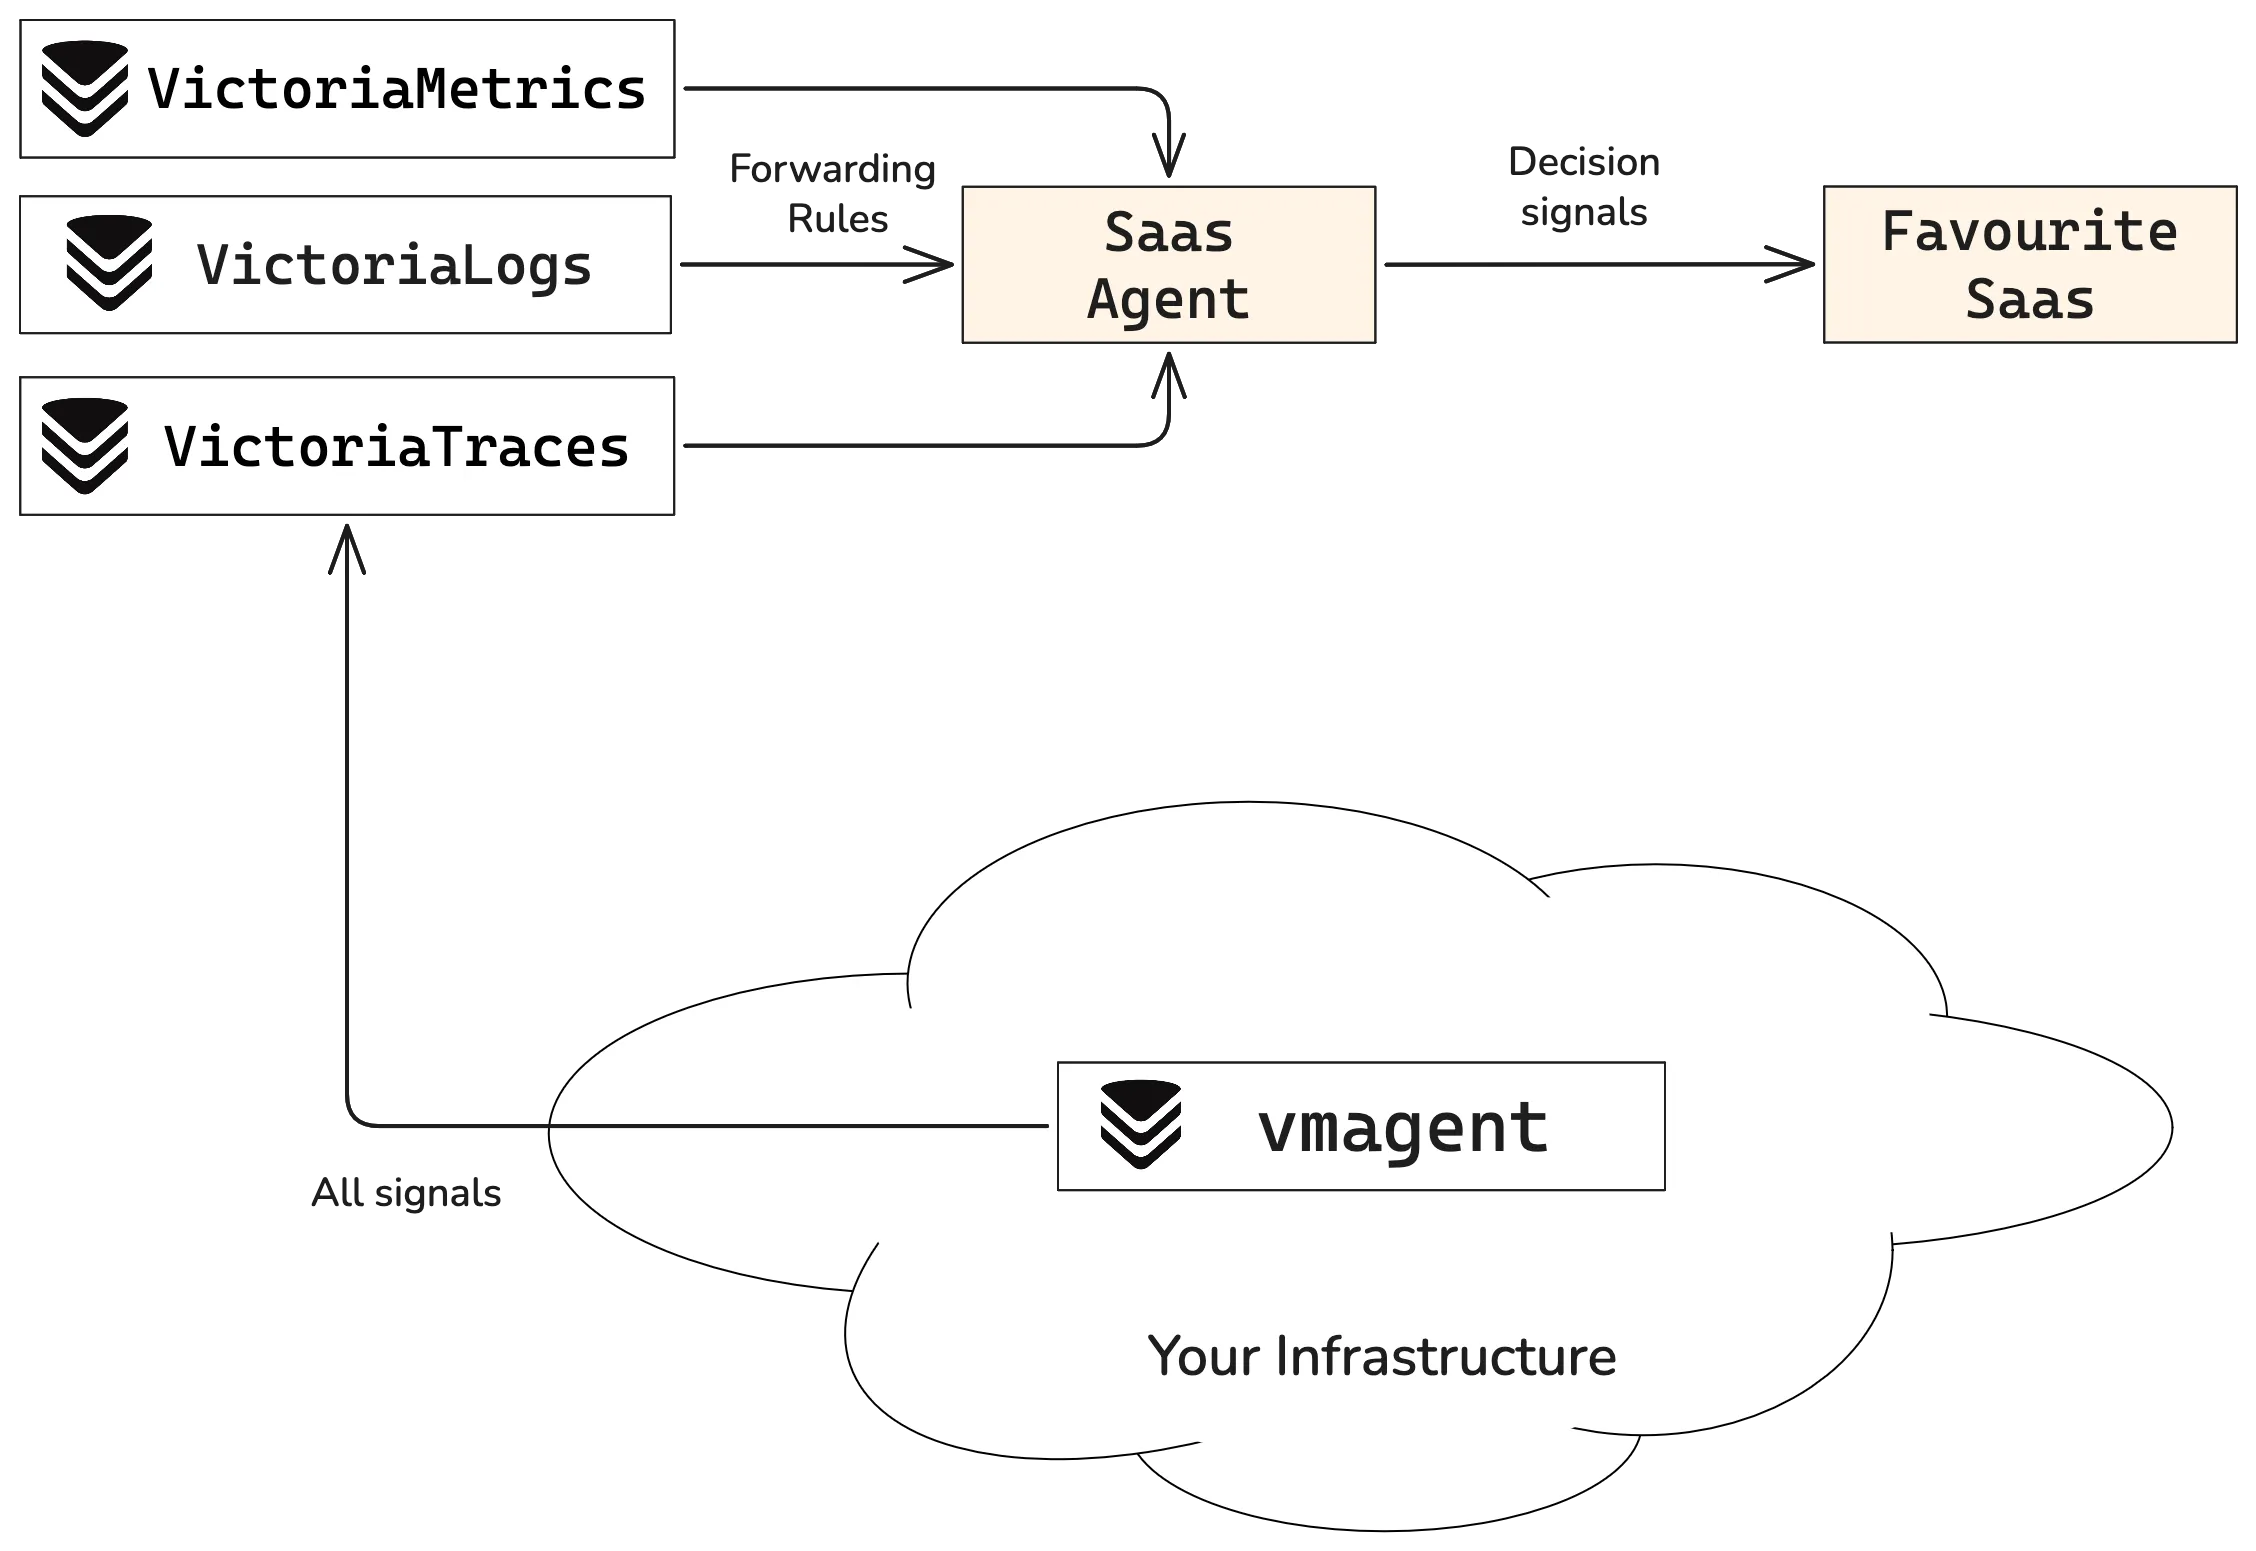
“Centralize and Forward” takes more work up front to set up. You can read a step-by-step guide by Samor Isa. But once running, it provides many benefits:
- Duplication: The most important data is duplicated. You can find it in your SaaS provider and in the VictoriaMetrics storage.
- Easy switch: Promoting a signal to the decision tier is as easy as adding it to the list of forward metrics. Moving signals to and from your SaaS is trivial.
- Centralization: the full dataset lives in VictoriaMetrics. Having everything in one place makes correlation and root cause analysis much easier.
Self-hosting Your Data with VictoriaMetrics
#
To get started with the VictoriaMetrics Observability Stack, here’s a high-level step-by-step guide:
- Plan how you want to implement your hybrid setup: Split by Signal or Centralize and Forward. Evaluate the pros and cons of each strategy.
- Estimate the capacity needed for your data. VictoriaMetrics ships open-source single-node and cluster versions of every component. This means that:
- A single-node VictoriaMetrics instance can handle up to 100 million active time series and is a good fit for “Split by Signal”.
- If you need more, for example, for the “Centralize and Forward” setup, you can scale horizontally with the cluster version.
- For more details, check out the capacity planning page.
- Install the parts of the VictoriaMetrics Observability Stack you need:
- VictoriaMetrics for metrics
- VictoriaLogs for logs
- VictoriaTraces for traces.
- Use our guides to set up your observability stack.
- Plan how to ingest data: We provide integrations and data ingestions for all standard collectors. For example, you can configure remote_write in Prometheus to forward metrics to VictoriaMetrics. You can even plug in your SaaS agent directly.
- Install an agent: In many distributed scenarios, an agent is the simplest way to scrape and forward signals to the VictoriaMetrics backend. For example, vmagent can replace Prometheus scraping capabilities, and vlagent can efficiently process and forward logs.
- Install Grafana: You can build or import information-rich dashboards with Grafana. VictoriaMetrics provides several ready-to-use dashboards to get started quickly.
You can always find help in our docs page, the community Slack, or in Telegram. Get in touch, we love to help.
Conclusion
#
The goal isn’t to rip and replace your favorite tool; it’s to keep it focused on what truly matters while letting a lean backend bear the weight of the rest. Considering how expensive SaaS observability platforms can be, a hybrid setup can be a great way to manage costs without sacrificing valuable data.
Frequently Asked Questions
#
What is hybrid observability?
#
Hybrid observability is an approach that combines SaaS observability tools with a self-hosted or lower-cost backend. Instead of sending every metric, log, and trace to a premium-priced platform, teams can keep high-value signals in SaaS dashboards while storing high-volume diagnostic telemetry in a more cost-effective system. This helps teams preserve visibility while reducing unnecessary observability spend.
How can teams reduce observability costs without losing important telemetry?
#
Teams can reduce observability costs by separating telemetry into decision-tier and diagnostic-tier data. Decision-tier signals, such as SLOs, uptime, latency, payment failures, and executive dashboards, may justify premium SaaS visibility. Diagnostic-tier telemetry, such as detailed metrics, verbose logs, and traces used mainly for troubleshooting, can often be stored more affordably in a self-hosted backend.
How does data observability with cost optimization work?
#
Data observability with cost optimization means monitoring the systems and signals that matter while being intentional about where that data is stored and how long it is retained. Instead of treating all telemetry as equally valuable, teams can evaluate data based on business relevance, operational criticality, storage cost, and audience. This makes it easier to keep important signals highly visible while reducing spend on lower-priority, high-volume data.
How can platforms reduce data pipeline costs in observability?
#
Platforms reduce data pipeline costs in observability by filtering, routing, and storing telemetry based on value. For example, critical SLO and alerting metrics can be forwarded to a SaaS platform, while detailed diagnostic data can be sent to a self-hosted observability backend. This reduces the amount of data flowing through expensive pipelines and gives teams more control over ingestion, retention, and storage costs.
What telemetry should stay in a SaaS observability platform?
#
Telemetry that directly affects customer experience, revenue, or business-critical operations is usually the strongest candidate for SaaS observability. This may include SLOs, SLIs, uptime, latency, error budgets, checkout success, login failures, and payment issues. These signals often need to be visible across engineering, product, leadership, and support teams.
What telemetry can move to a self-hosted observability backend?
#
High-volume diagnostic telemetry can often move to a self-hosted observability backend. This includes detailed metrics, verbose logs, distributed traces, and engineering-focused data used for troubleshooting or performance investigations. This data is still valuable, but it may not need to live in a premium SaaS pipeline if it is mainly used during debugging.
Is hybrid observability better than fully self-hosted or fully SaaS observability?
#
Hybrid observability can be better when teams want the convenience of SaaS without paying premium prices for every piece of telemetry. Fully SaaS observability can become expensive as data volume grows, while fully self-hosted observability may require more operational effort than some teams want. A hybrid model lets teams use SaaS where it provides the most value and self-hosted storage where scale and cost control matter most.
How does VictoriaMetrics support hybrid observability?
#
VictoriaMetrics supports hybrid observability by giving teams a cost-effective backend for high-volume metrics, logs, and traces. Teams can use VictoriaMetrics, VictoriaLogs, and VictoriaTraces to store diagnostic telemetry while continuing to forward selected decision-tier signals to a SaaS observability platform. This allows teams to reduce telemetry costs without giving up important visibility.
Leave a comment below or Contact Us if you have any questions!
comments powered by Disqus