- Blog /
- New Capacity Tiers in VictoriaMetrics Cloud
New Capacity Tiers in VictoriaMetrics Cloud
Share:


As announced in our latest VictoriaMetrics Cloud Product updates in Q3 2025, we have been working to substantially improve our public tiers, and we wanted to dedicate some time to explain these changes and showcase what users can expect moving forward.
VictoriaMetrics Cloud Crash Course
#
For those who haven’t experienced VictoriaMetrics Cloud yet, let’s start with a brief recap: VictoriaMetrics Cloud is the managed Observability service for the VictoriaMetrics Observability stack. It allows you to deploy and run your own VictoriaMetrics stack instances, while we manage them. It offers a 1 month trial period without requiring a credit card upon SignUp. If you need help, we can also do a guided Proof Of Concept together. (You can read more and request it here).
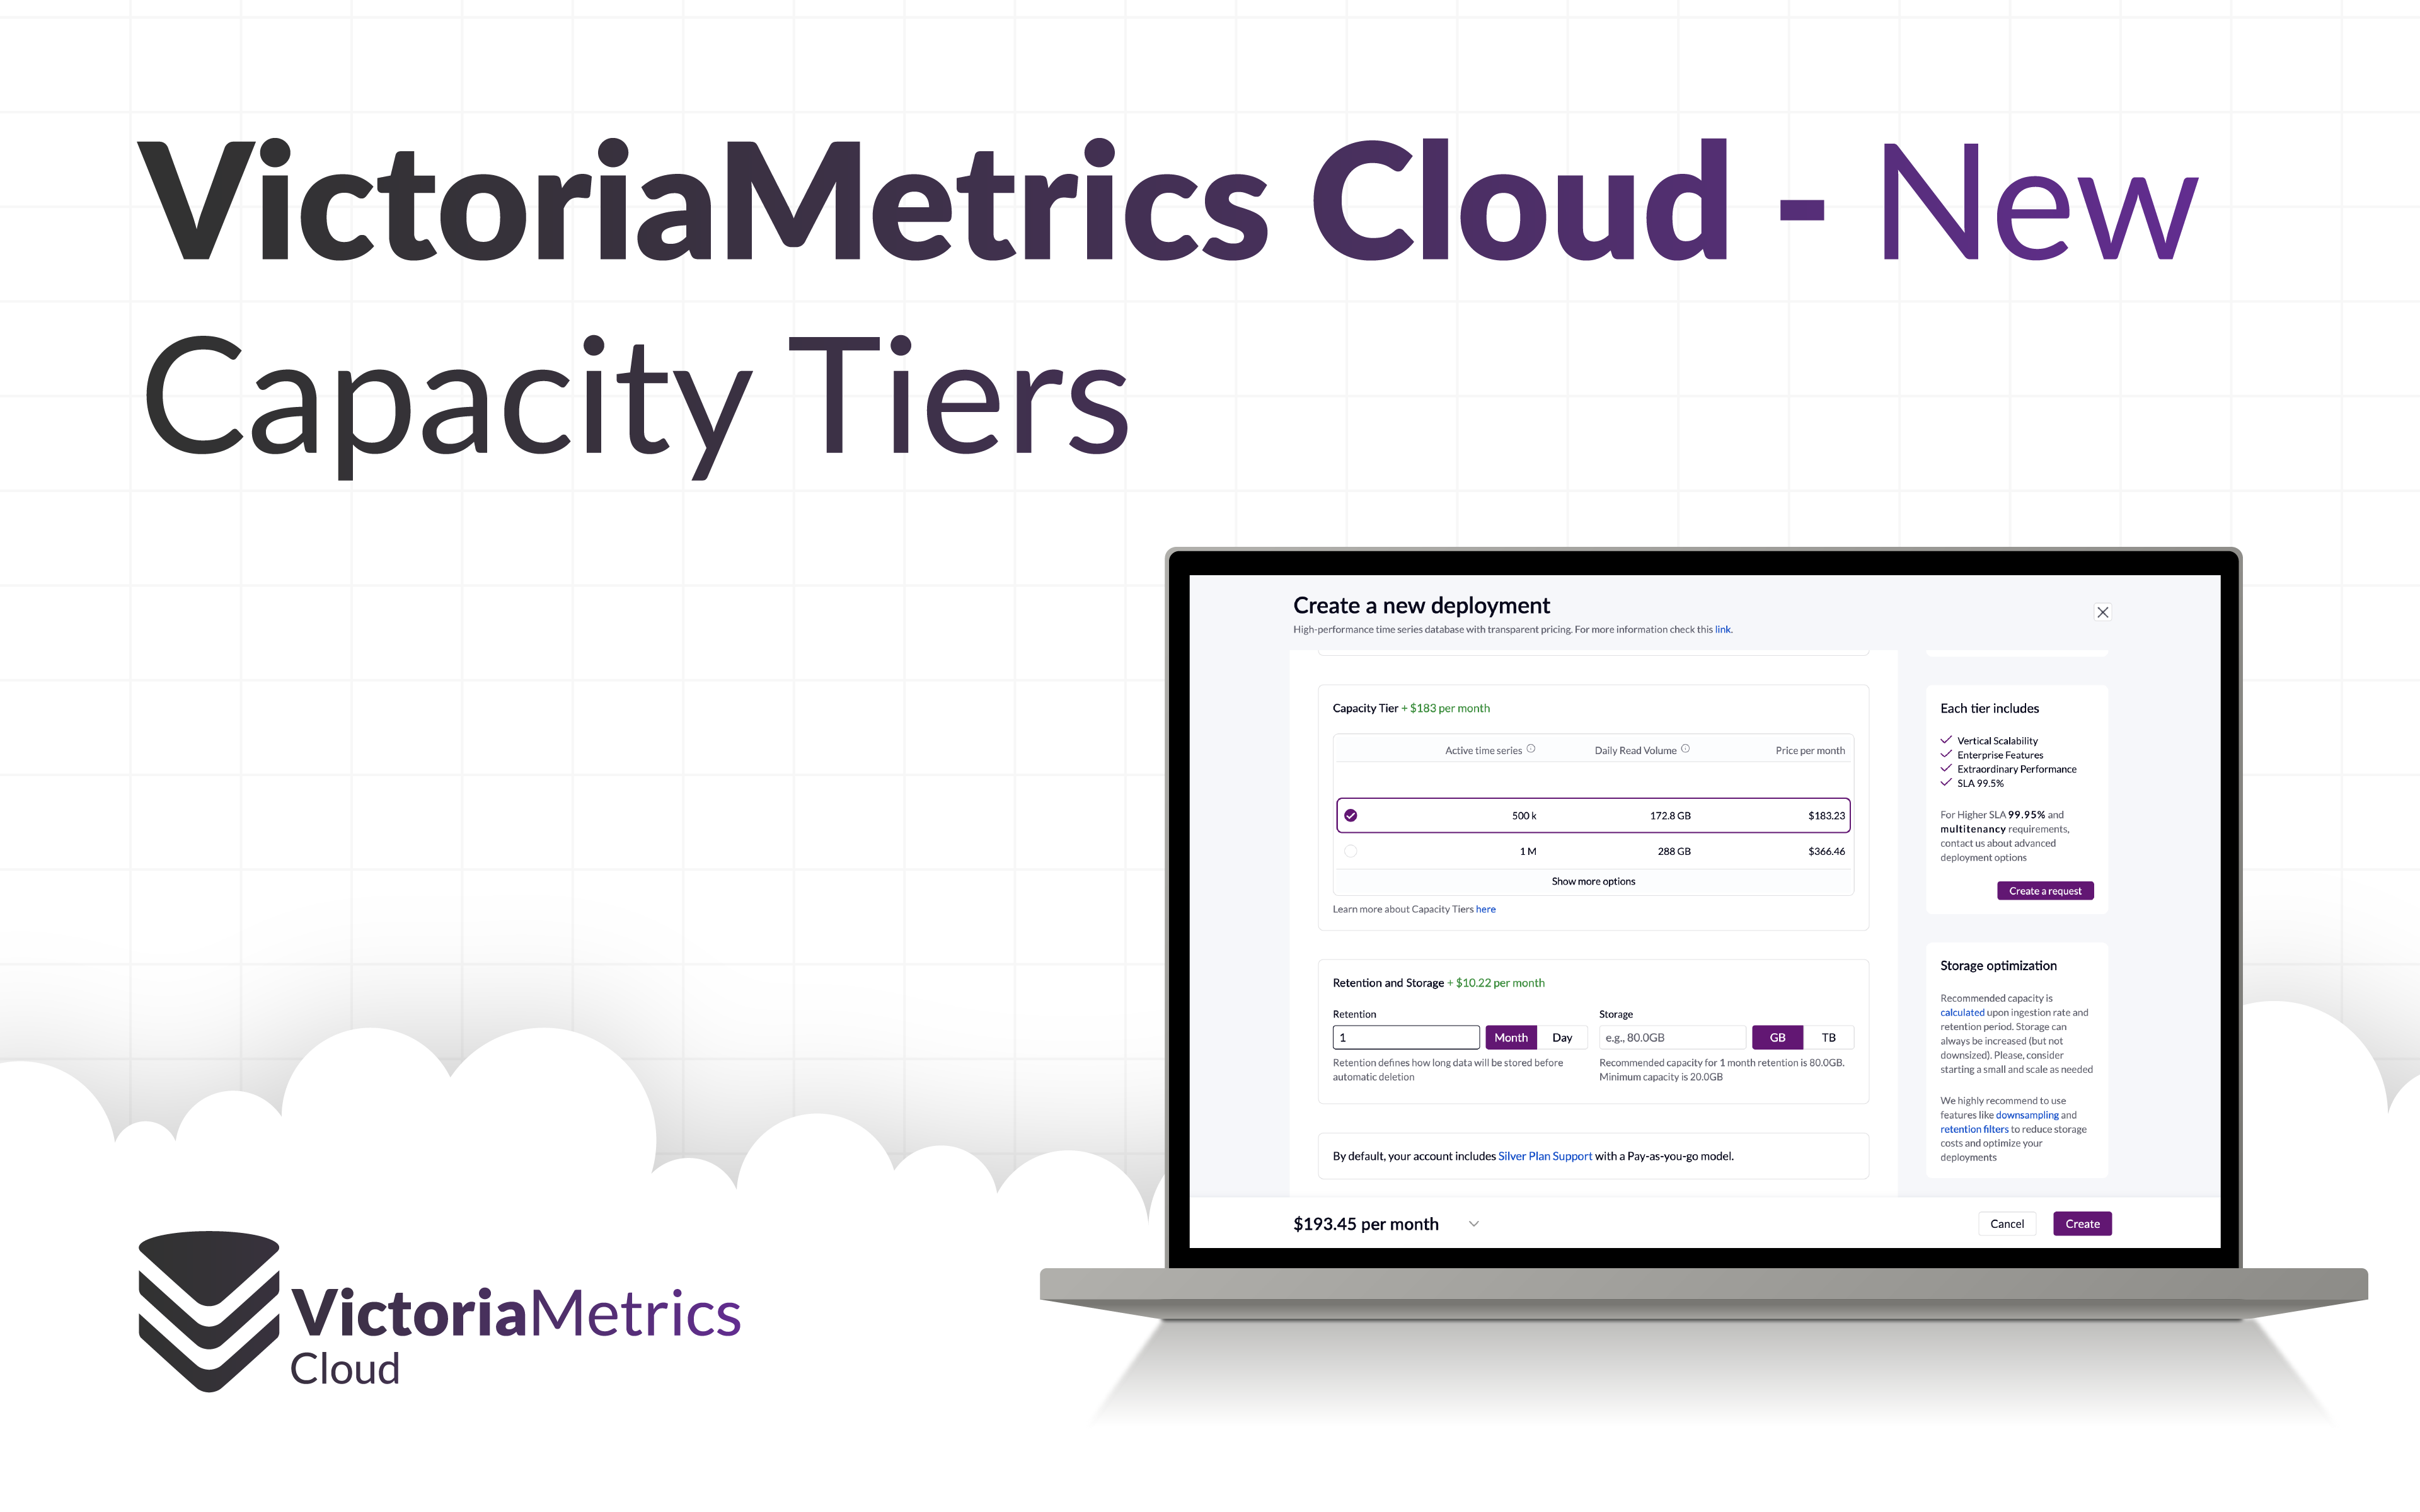
The VictoriaMetrics Cloud Quick Start process works in the following way:
- You pick a
Capacity Tierbased on your load - Select
Storagebased on your desiredRetention Createthe deployment
That’s it. In a few seconds you’re ready to integrate with your favorite tooling.
What is a Capacity Tier, anyways?
#
Very briefly, Capacity Tiers are just pre-defined VictoriaMetrics configurations equipped with different CPU and RAM arrangements. Our team benchmarks them for different loads, and set limits to ensure deployment stability and SLAs.
This approach offers a Database-as-a-Service (DBaaS) model, in which users are billed by conscious selections, preventing unexpected cost increases overnight. If more computing resources or retention are needed, it only takes to pick a higher Capacity Tier or disk, and the deployment will be automatically upgraded to cope with more load.
The VictoriaMetrics Cloud deployment model and billing are based on this principle, with networking costs matching AWS prices, which typically range from $1 to $30 per month. Even for very large deployments, from our experience this amount is typically below 0.5% of the total deployment cost.
Examples
#
While the performance parameters of a Time Series Database can get quite complex, one of the most
common used parameters used when picking a Capacity Tier is Active Time Series,
which is nothing but a metric that received at least a single sample during the last hour.
Monitoring hosts
#
Computing hosts generate load in terms of measurements for CPU, Memory, Disk IO… And these metrics are scraped every period of time. For example, placing a node exporter on a host exposes ~1000 time series per instance. Therefore, if you collect metrics from 50 node exporters, the approximate amount of Active Time Series is 1000 * 50 = 50,000 series. This parameter may be helpful for planning if you don’t know your needed Capacity.
Monitoring a small application
#
Every use case is very different, but in our experience, a small kubernetes cluster with a light workload (10 worker nodes + 10 applications) may expose about 80,000 active series.
The new smallest VictoriaMetrics Cloud tier is able to accept up to 500,000 Active Time Series scraped every 30s, which means that it can be enough for 6 of these small setups or 500 node exporters.
What has changed?
#
Since VictoriaMetrics Cloud was announced a while ago, we have learnt a lot from our customers. Based on feedback, requests, and adaptations, our tiers internals changed during this time. The side effect was that the big picture may not be up to our expectations, making it sometimes difficult for users to scale between them. We’ve found that it’s time to rethink all tiers from scratch, applying the knowledge acquired throughout the years. With these changes, our main goal is to offer a consistent set of Capacity Tiers which provide with the power that every user would expect from VictoriaMetrics while maintaining a consistent pricing strategy that helps in the decision making process.
Let’s explain the changes in detail. The following only applies to VictoriaMetrics Single-Node Capacity Tiers, VictoriaMetrics Cluster changes are explained below.
A gradual Computing Power ladder
#
After a thorough benchmarking process, our team has crafted a list of configurations that are able to serve relevant use cases in the industry. The main outcome of this process has been a set of Compute Units (CPU/RAM) assigned to every Capacity Tier.
The load used for our tests is available in our documentation,
and sorted by Active Time Series.
The rest of parameters (or capacities) include, among others, Churn (mostly related to High Cardinality),
Ingestion and Reading rates that should help users pick the best configuration that adapts to
their needs. For a detailed explanation of every parameter, please check the documentation link
shared above in this paragraph.
As it can be seen in the following graph, all tiers are now equipped with significantly more resources.
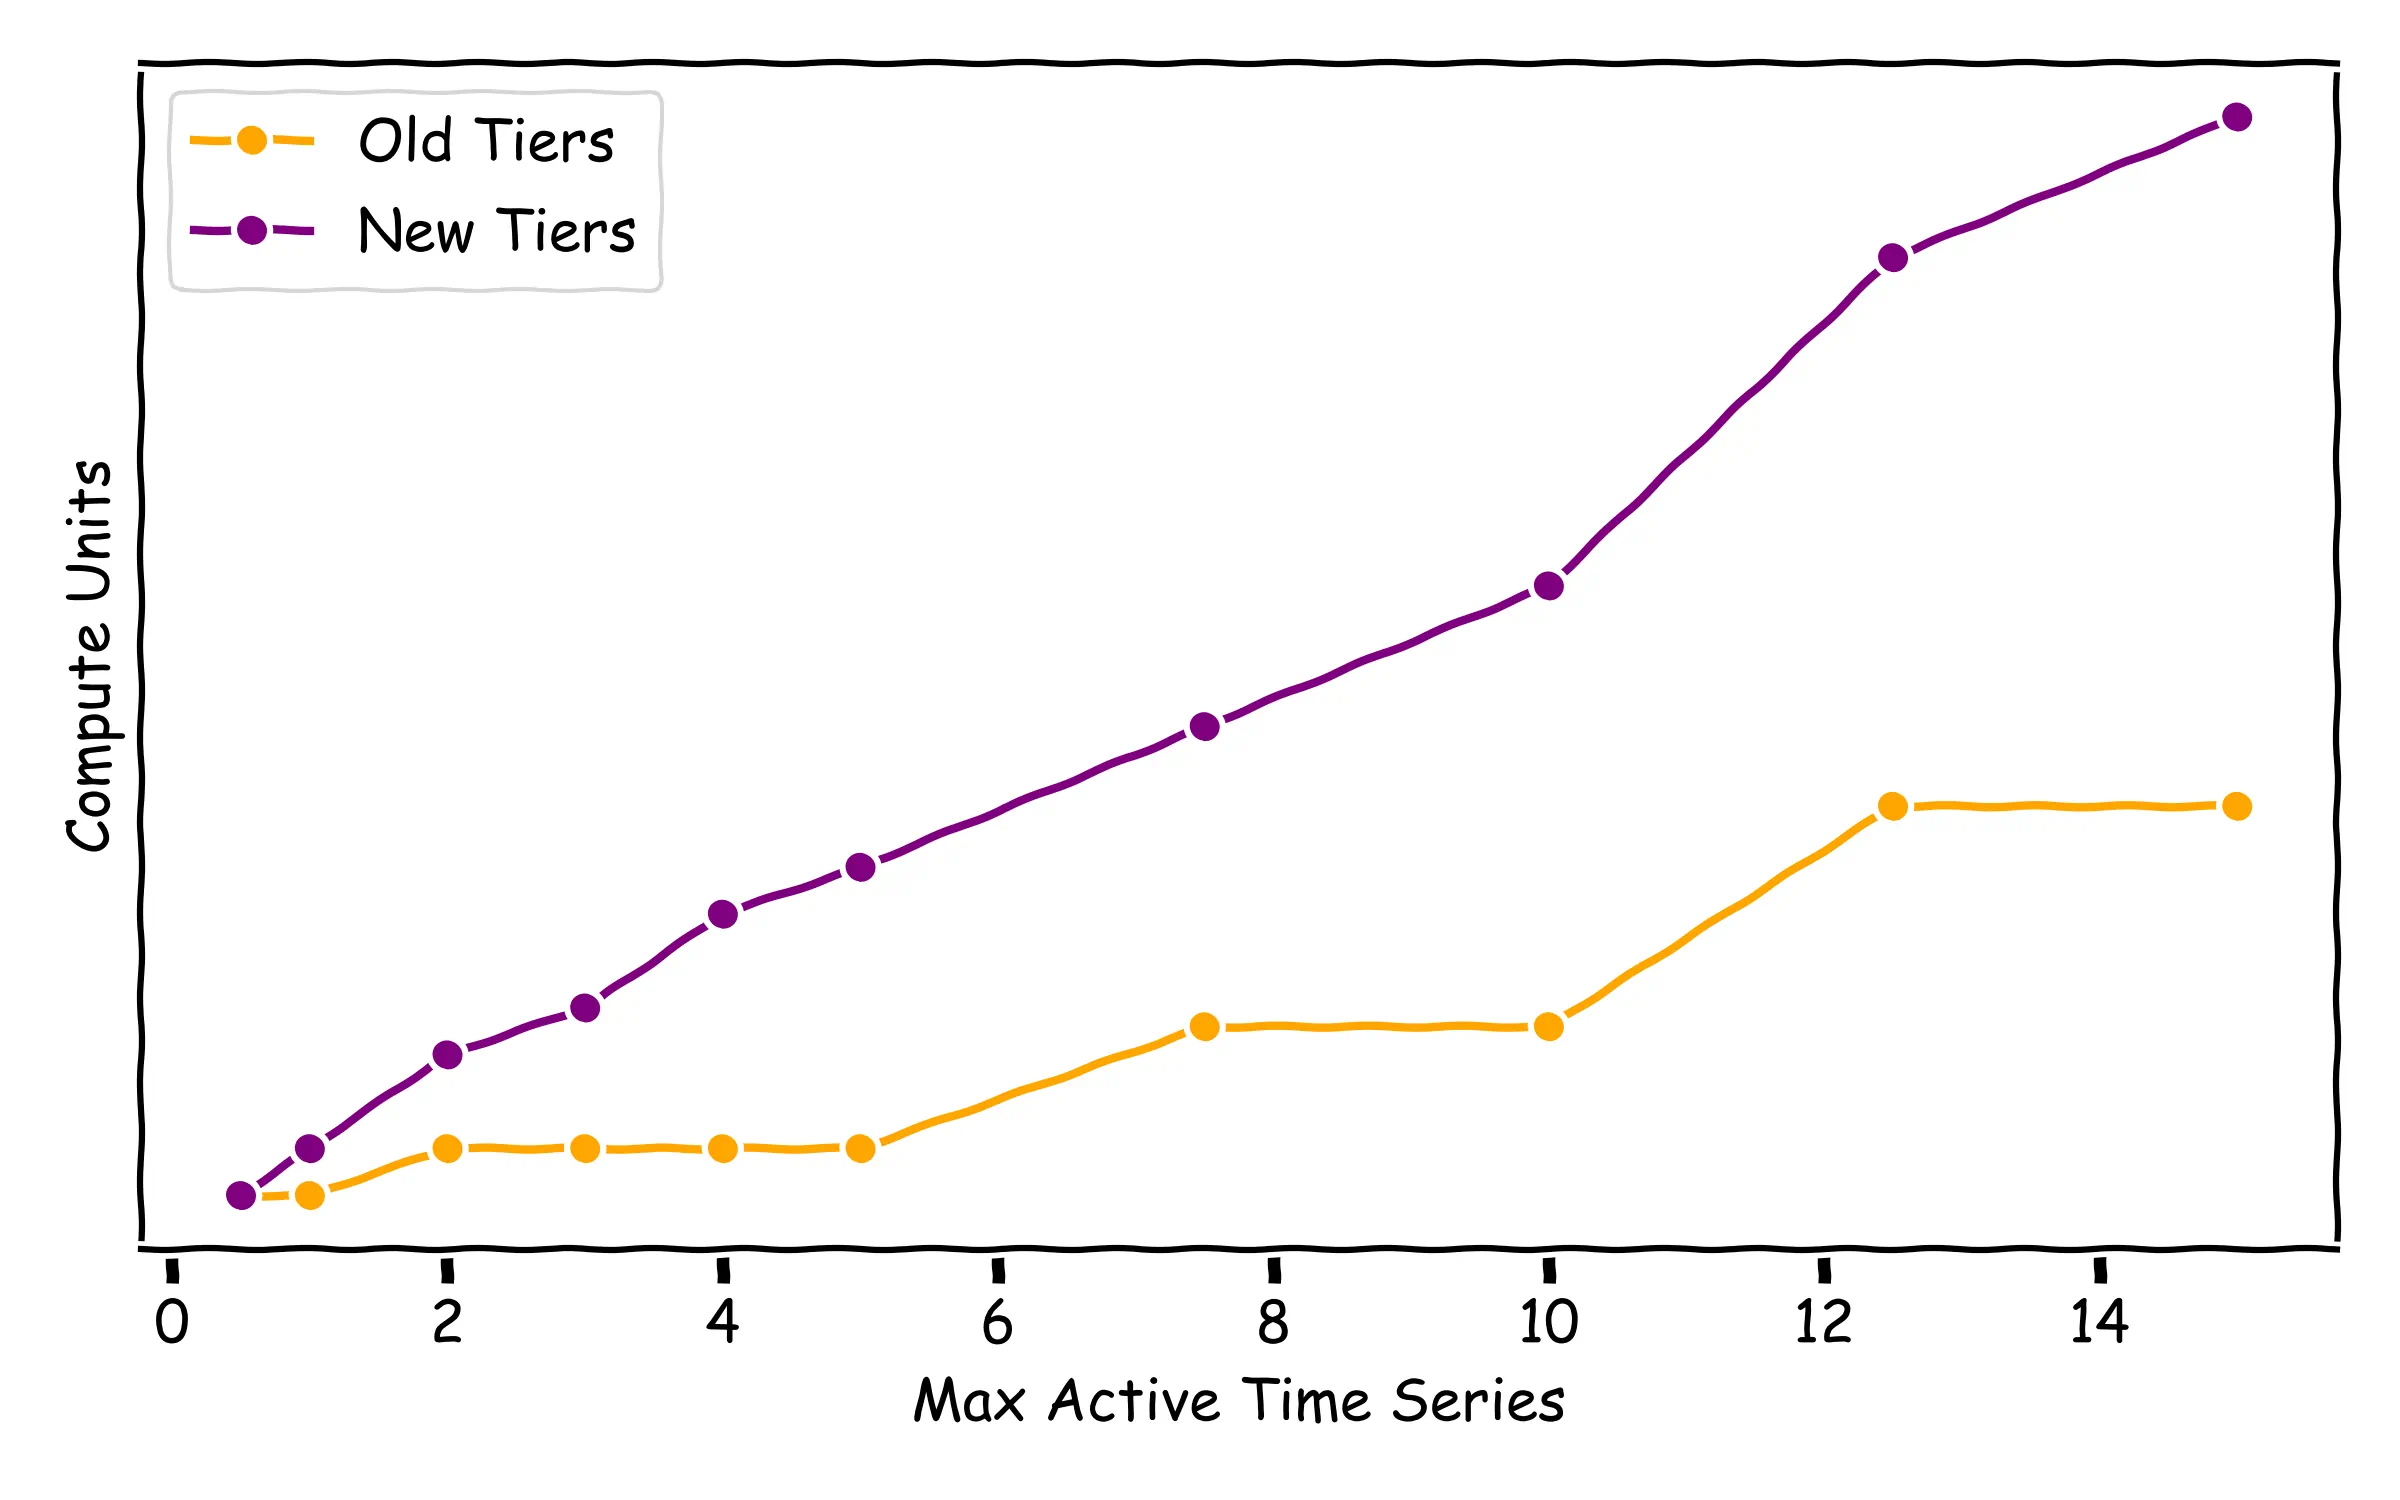
The main results of this process can be summarized in:
- The Capacity Tiers structure is now gradual, with intermediate options for a wider range of cases.
- The gaps between tiers have been reduced, with new options for 3, 4, 7.5 and 12.5 Million Active Time Series.
- Every tier has now much more resources. We have increased by a large factor (3x, or even 7x) the Memory and/or CPU allocated.
- With these new resources, limits for tiers have been rebuilt, to better align with all that these new tiers can do.
- A new metric, Data Read Rate, has been made available in the monitoring section, showing the amount of data scanned per minute. It represents the reading effort that the deployment is doing, and we believe that it will significantly help users to understand the full picture of the deployment’s load.
Progressive pricing
#
To illustrate it plain and simple: the jump from a Capacity Tier able to serve 2M Active Time Series, should just double the cost than one for 1M. The new Capacity Tiers follow that assumption. In the following graph, a price comparison between new and old Capacity Tiers for 1 month retention is shown:
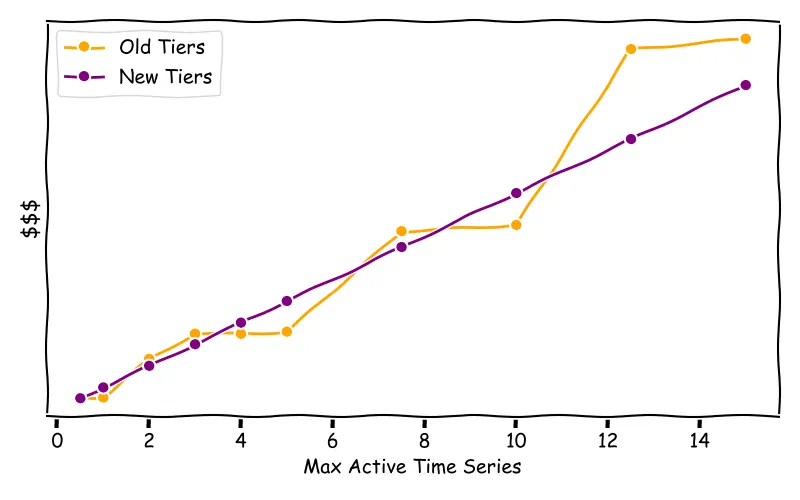
As you can see, the new Capacity Tiers structure provides a smooth ladder (example for 1 month retention).
Storage changes
#
After all this time running a live Database in production, you may imagine how much we learned (sometimes in the hard way) about optimizing our backup strategies and its operational costs. It’s been a while since we increased the number and cadence of our backups, without modifying our storage prices. With these changes, the new Capacity Tiers apply an increase in storage costs per GB. This comes together with an adjustment in the calculations for recommending disk size for desired retention periods.
The main impact of this change will of course be more significant in tiers configured with higher retention and ingestion rates, while not being much noticeable in other cases (see previous comparison of tier prices with 1 month retention).
In any case, we strongly recommend users to:
- Start small and scale as needed: storage can always be added when needed, and the full disk size will only be needed when hitting the retention period.
- Use
DownsamplingandRetention Filtersto remarkably reduce cost. If you need help to get started, check out our latest announcement where we added debugging tools for both features.
Is this expensive?
#
Even if we’d like to tell otherwise, there’s no magic here. Having a performant software supporting this service allows us to be extremely cost-efficient.
We do recommend every user to make their own comparisons, specially because every platform and product have different features and value, and everybody does volume discounts applied to the public pricing. That’s why we will show a couple of qualitative, anonymized, comparisons of VictoriaMetrics Single deployments cost against other vendors, for the sake of understanding orders of magnitude.
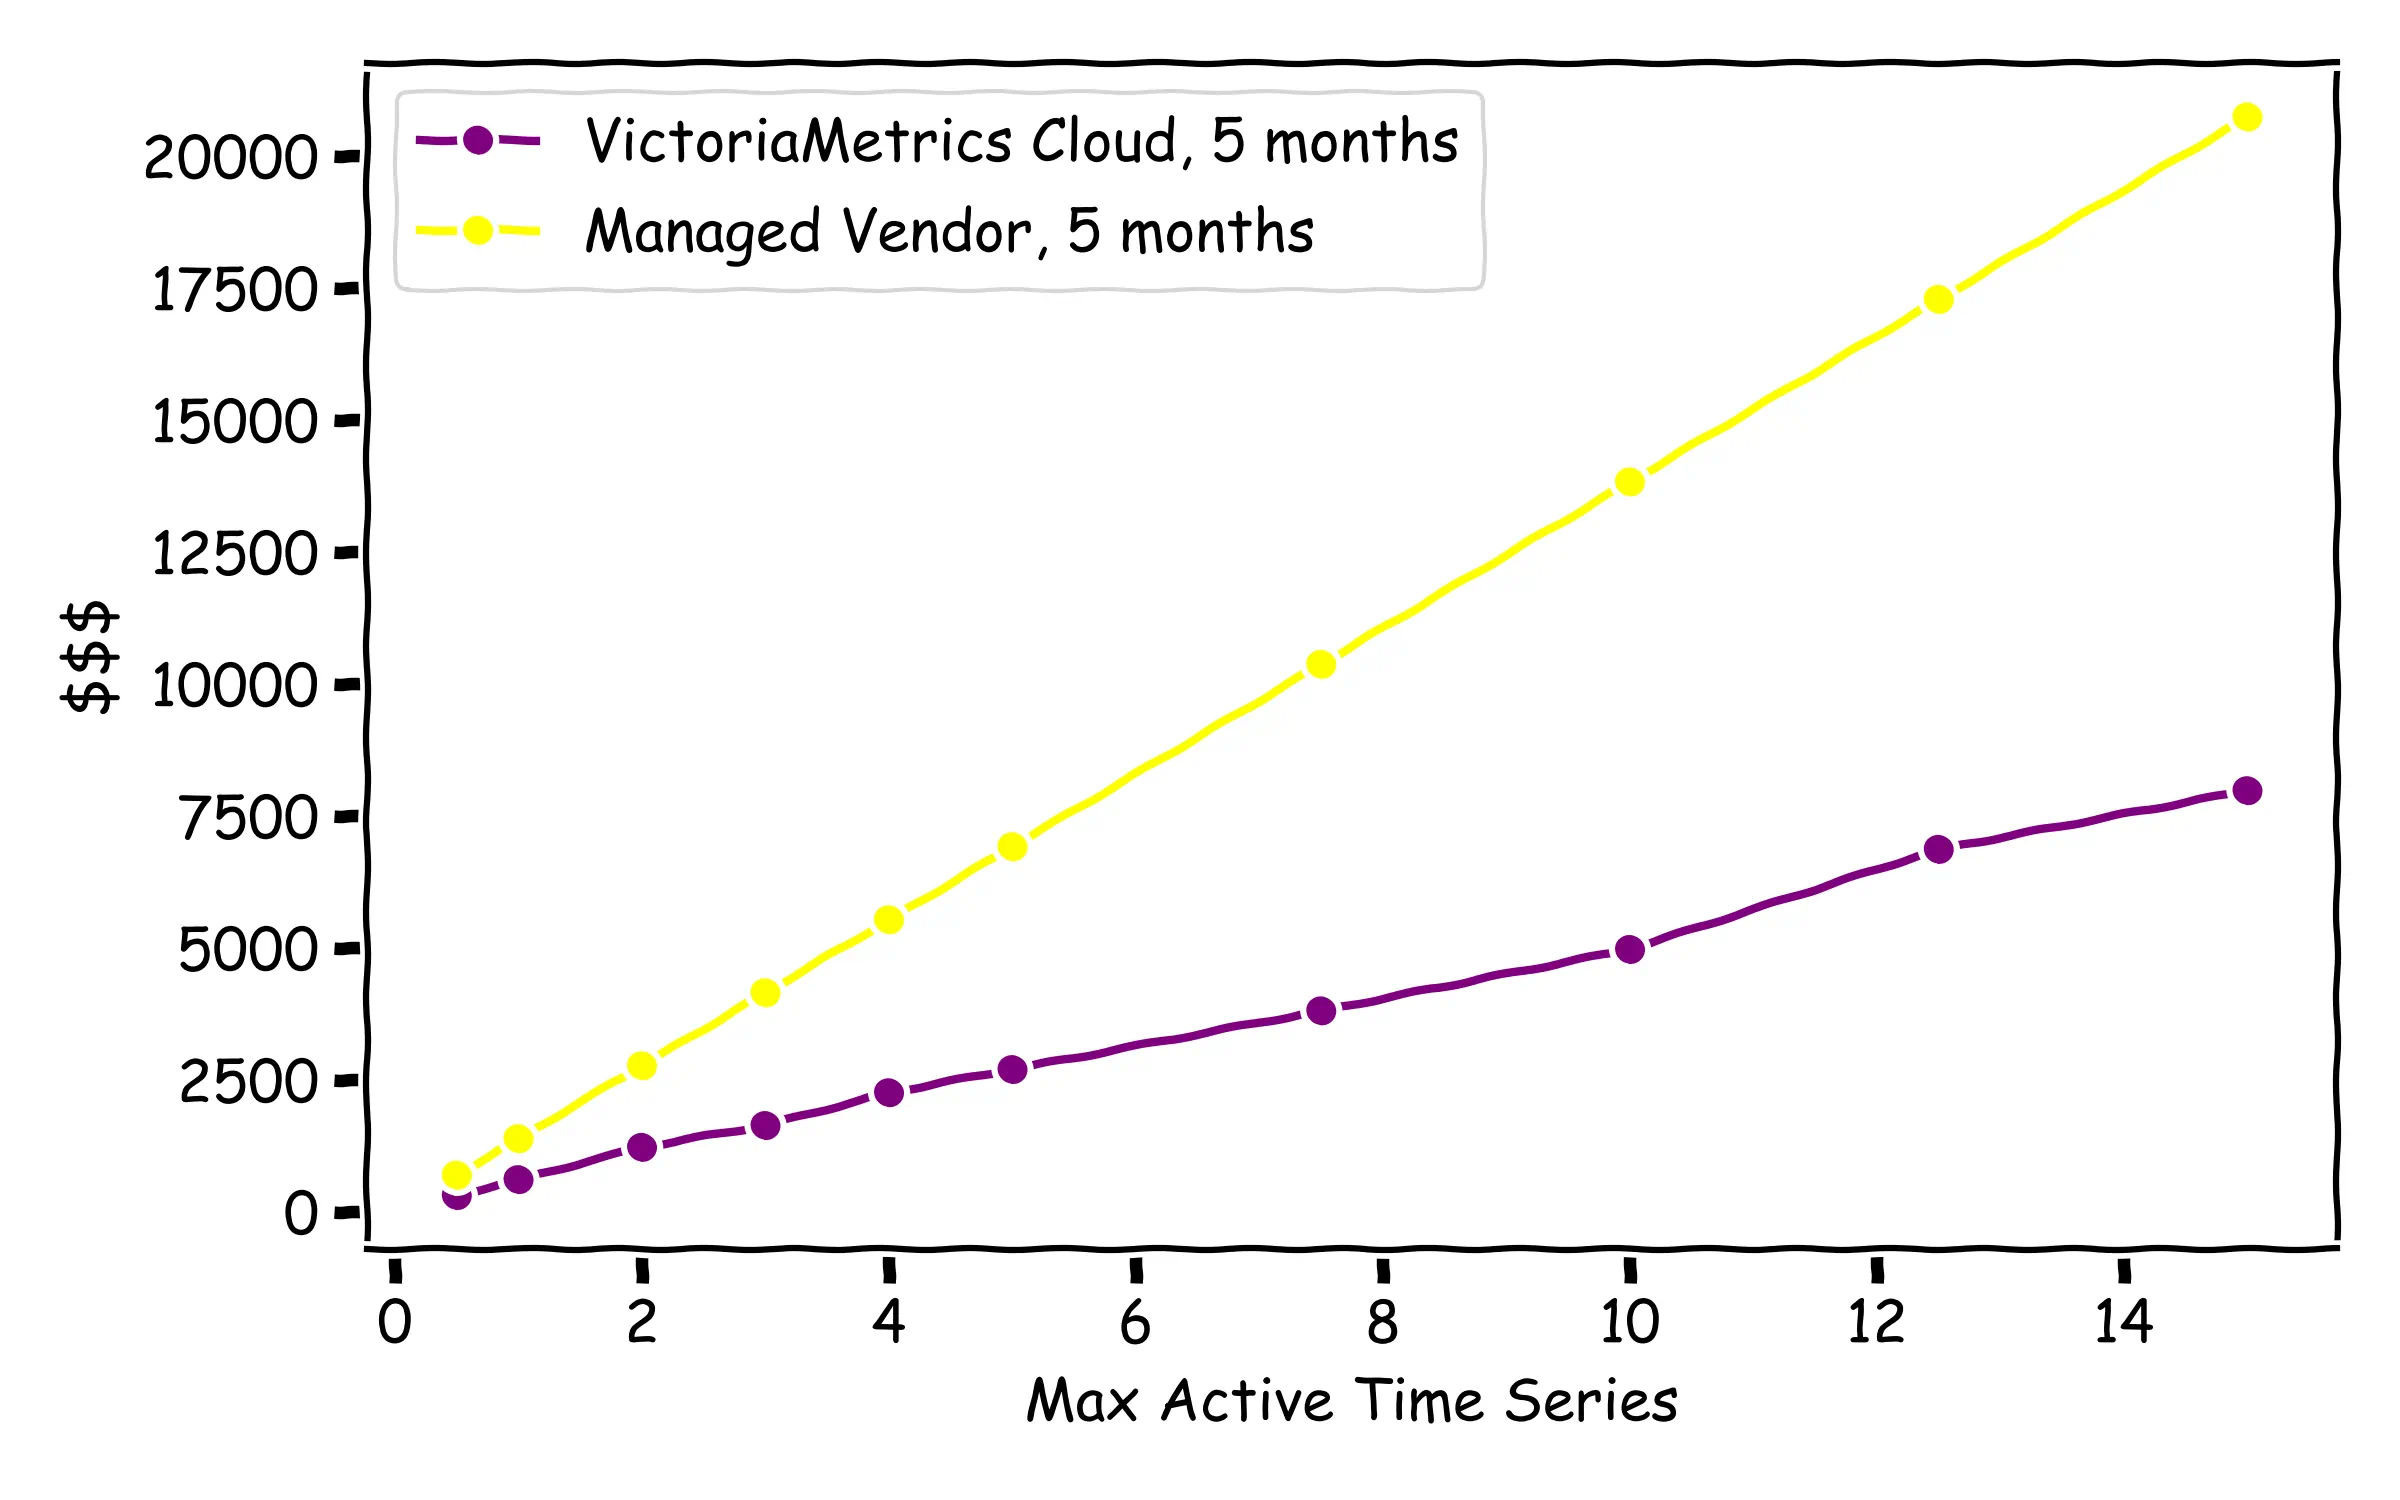
The first comparison is shown for a Managed Service for Prometheus (without taking into account querying, like in this example, to avoid complexity, but keeping in mind that in VictoriaMetrics Cloud, querying is included). The lowest volumes imply a 1.5x price difference, while this highest are 5x:
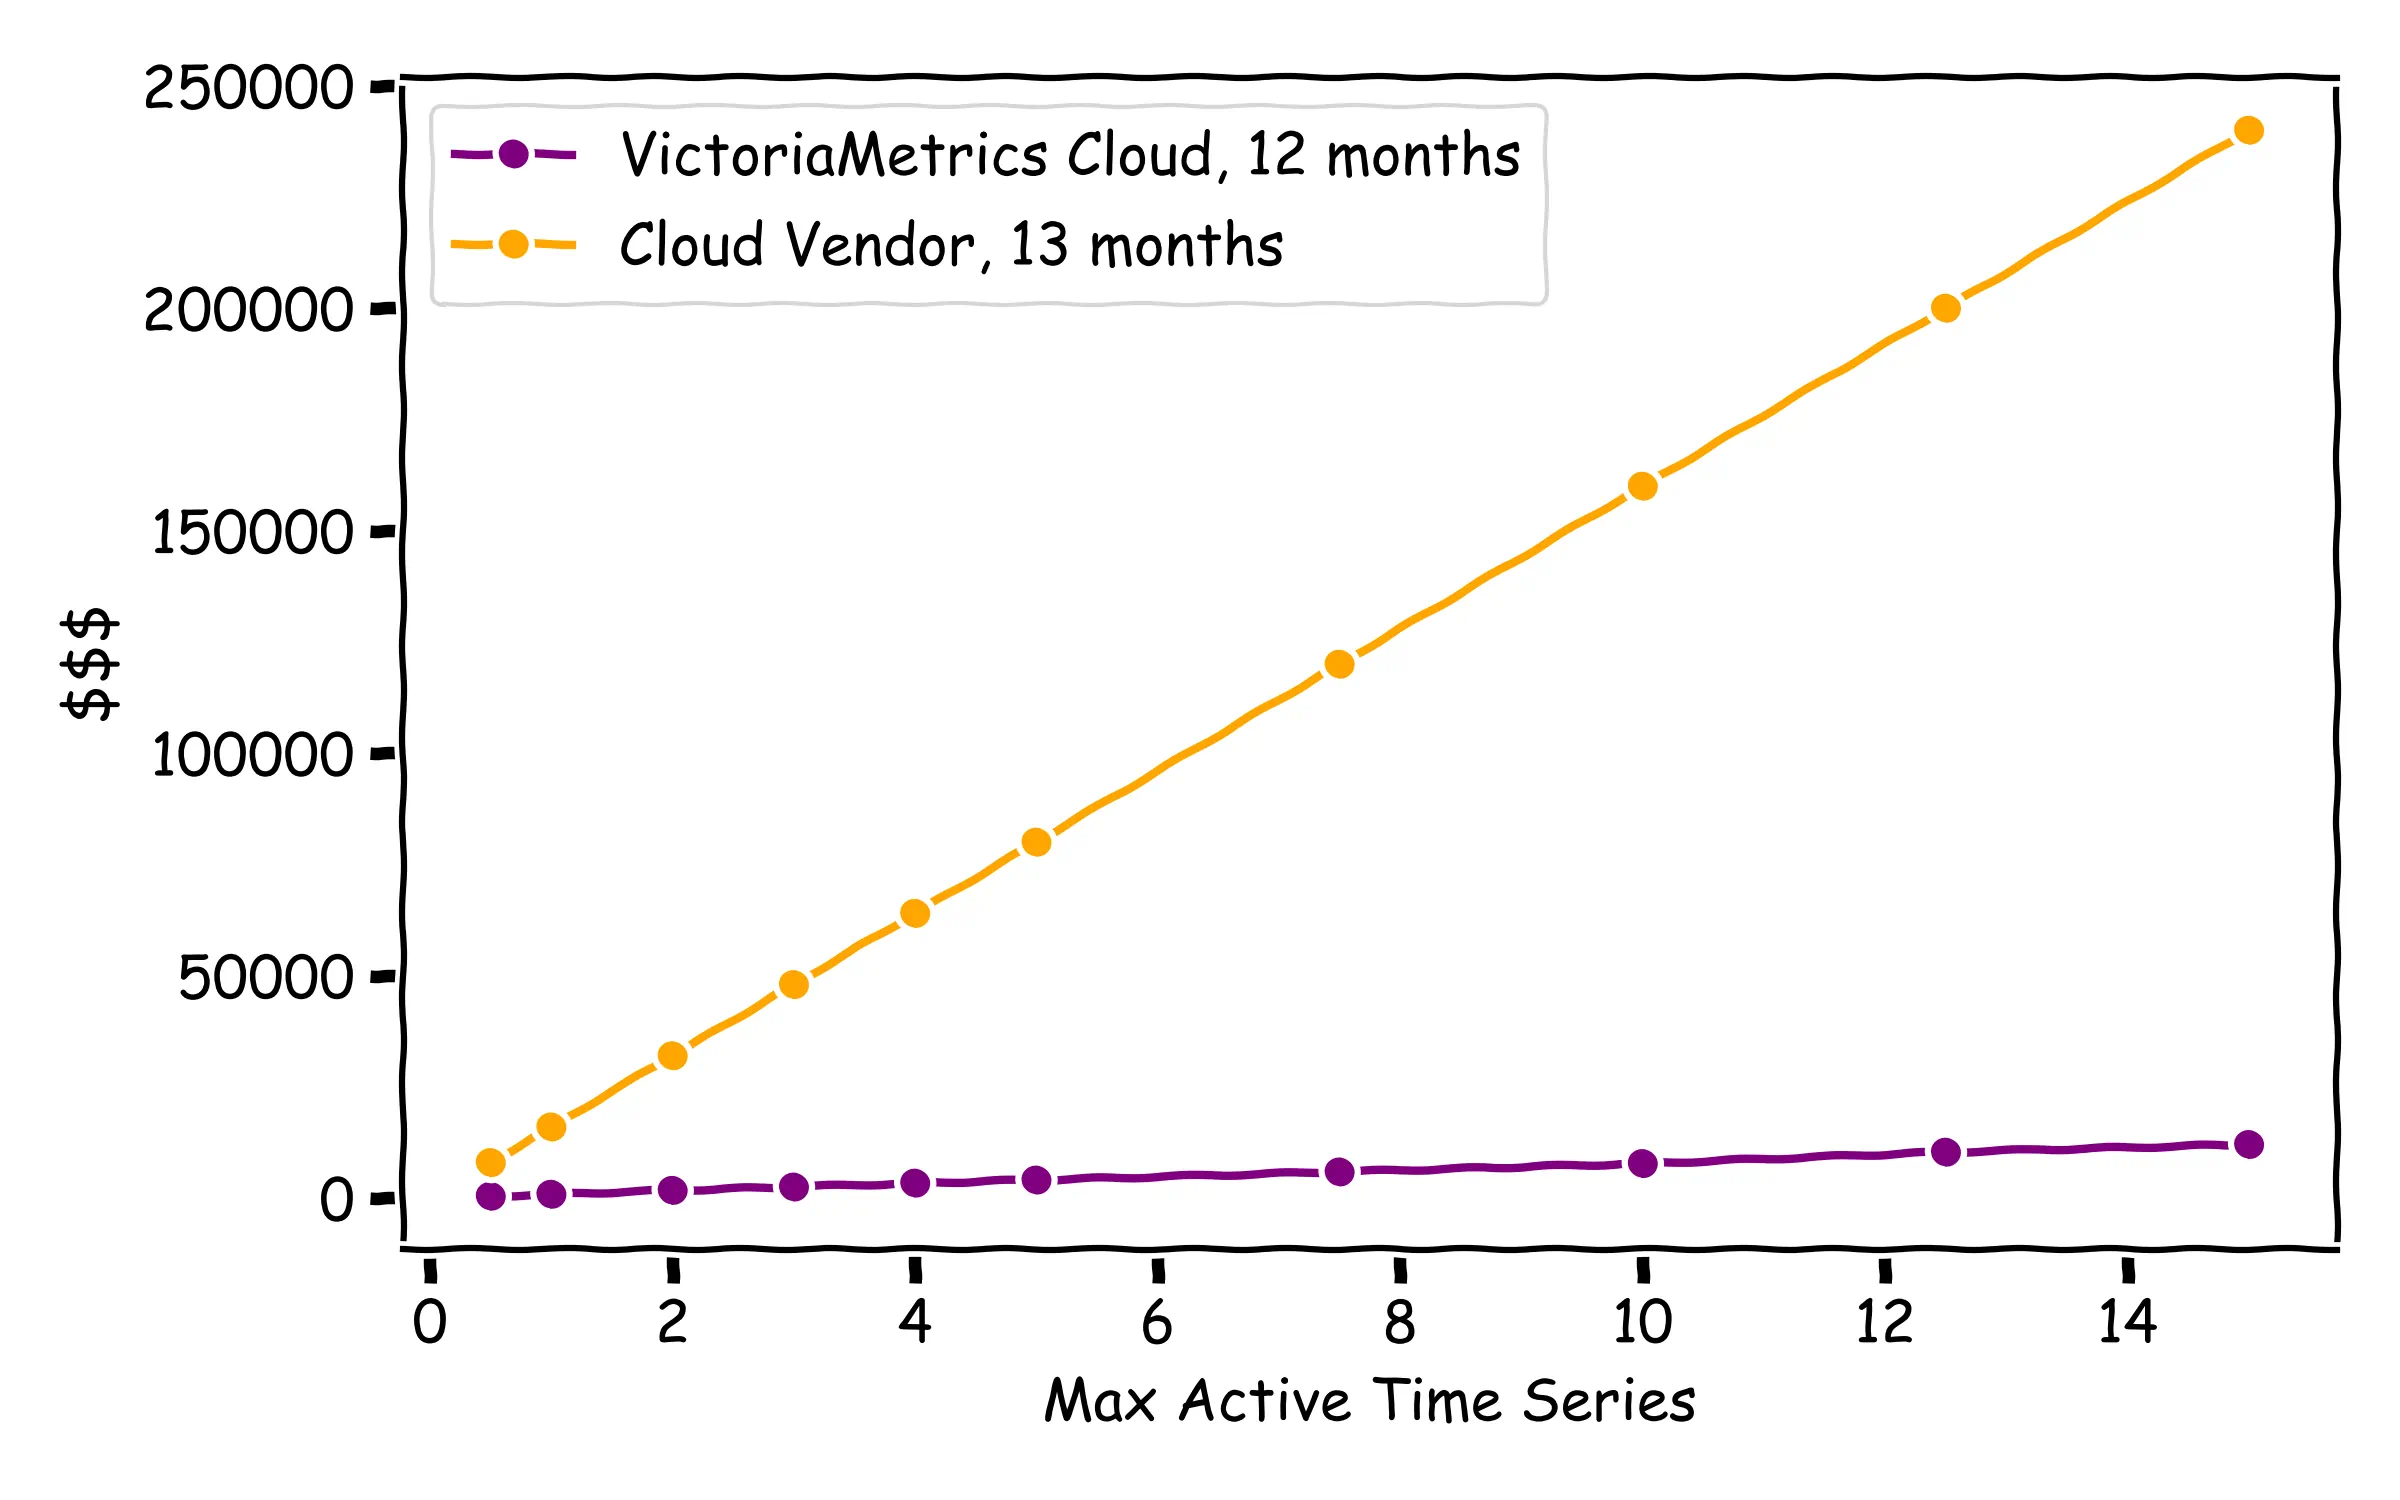
And the differences are even higher if we compare with another Cloud Observability vendor (in this case, 12 months retention is picked for VictoriaMetrics Cloud, because for the highest capacity tier, VictoriaMetrics Cloud Single instances have a limitation coming from AWS of 16TB), where differences are ~20x:
Want actual numbers?
You can always check and plan actual costs when creating a VictoriaMetrics Cloud deployment at https://console.victoriametrics.cloud/deployments/create.
How does this change affect to existing users?
#
If you are already a VictoriaMetrics Cloud user, and you are happy with your current deployment, you can perfectly continue using the same setup. No changes are required. These changes will only apply for newly installed deployments.
Upgrades to the new Capacity Tiers from legacy ones can easily be performed in the Settings
section of your deployment. Of course, based on what we have been explaining in this post (and,
specially, based on the new Compute Units allocation) we believe that these new tiers are able to
provide much more value.
What about the VictoriaMetrics Cluster version?
#
We’ve also learnt that, at scale, every use case is special: some users may read a lot without writing much, while others generate tons of alerts and keep their churn rate very low. Some even just send all their data and need it to be ready for sporadic investigations.
When we talk about VictoriaMetrics Cluster, it normally means high scales. However it always
means that a tailored approach is needed. That’s why we have decided to substitute the Cluster
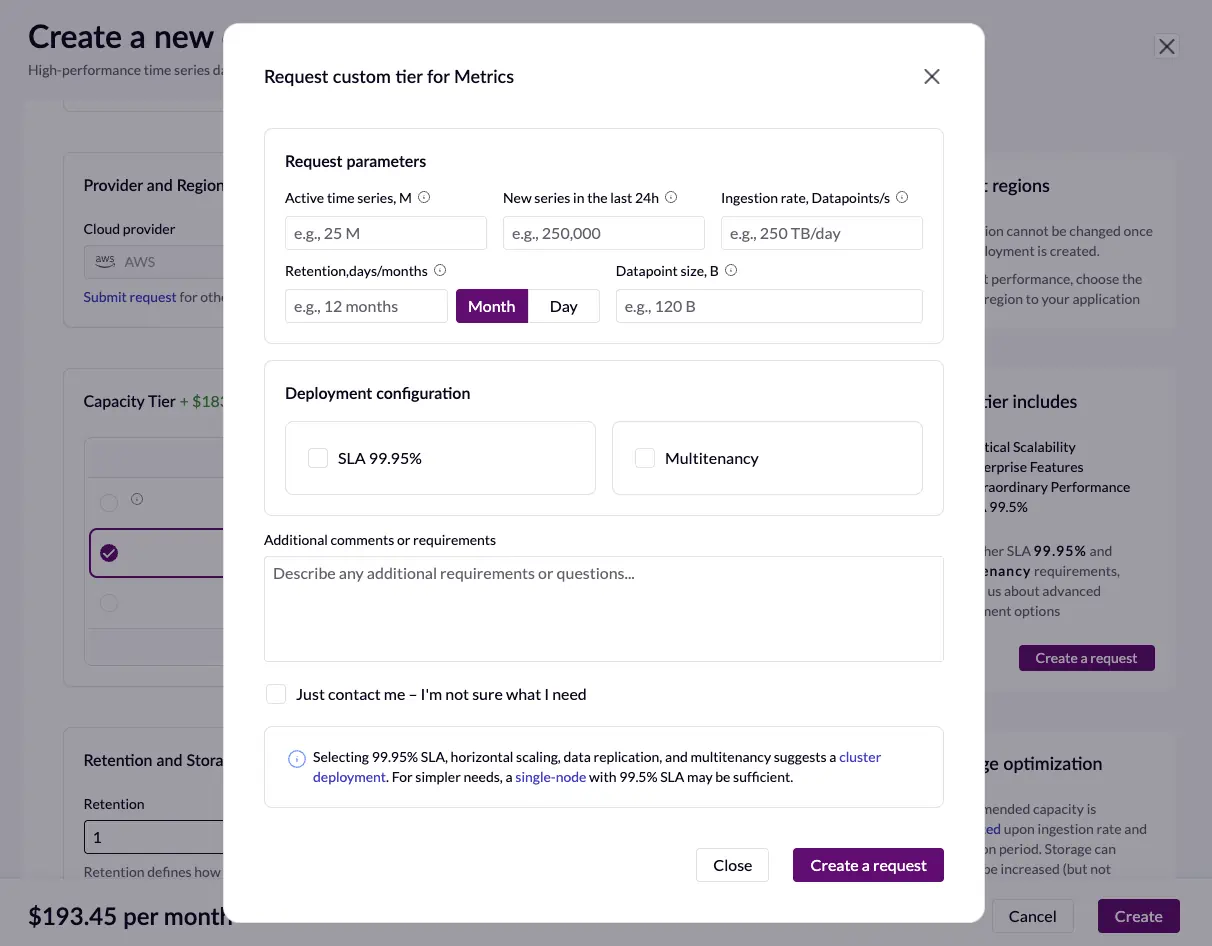
creation option by a Create request form, in which users can ask for their customized deployments.
As previously mentioned, we found that conducting a PoC
together helps to optimize costs by creating ad-hoc VictoriaMetrics Cluster deployments helping to
only pay for those Compute Units that are actually needed.
Conclusion
#
The redesigned Capacity Tiers deliver a more predictable, scalable, and capable foundation for running VictoriaMetrics Cloud. With clearer sizing, expanded compute resources, updated pricing, and enhanced visibility into the deployments behavior, users can now grow their systems together with us in a much smoother way.
The move toward tailored Cluster deployments ensures that large-scale environments receive configurations that match their exact needs. These changes reflect the lessons learned from real production workloads and reinforce our goal of providing a fast, efficient, and cost-effective observability platform.
What’s Next?
#
We will continue monitoring and adjusting our tiers to help our customers succeed. As we approach 2026, we are planning big things that we can’t wait to share. In the meantime, we are also improving our Credits based system inside the platform to allow using them in the indistinctly between VictoriaMetrics and the imminent rollout of VictoriaLogs deployments.
Thanks for all your support. We’ll be back with more updates soon!
Further reading
#
- VictoriaMetrics Cloud Tiers and Deployment Types
- What’s New in VictoriaMetrics Cloud Q3 2025?
- Pricing comparison for Managed Prometheus
- VictoriaMetrics Cloud reduces monitoring costs by 5x
- https://victoriametrics.com/products/cloud/
- https://victoriametrics.com/products/victorialogs/
Leave a comment below or Contact Us if you have any questions!
comments powered by Disqus