- Blog /
- Never-firing alerts: What they are and how to deal with them

Never-firing alerts: What they are and how to deal with them
Share:


Alerting is one of the main reasons for having a monitoring system. It is always better to be notified about an issue before an unhappy user or customer gets to you. For this, engineers build systems that would check for certain conditions all the time, day and night. And when the system detects an anomaly - it raises an alert.
Monitoring could break, so engineers make it reliable.
Monitoring could get overwhelmed, so engineers make it scalable.
But what if monitoring was just poorly instructed? What if it was checking for a wrong condition? This is what’s referred to as ’never-firing alerts’ in the monitoring world. This blog post looks at what these are, what they mean, and how to deal with them.
Alerting rules
#
VictoriaMetrics’ approach to alerting is very similar to the Prometheus one. Except that the ruler isn’t built-in in the database, but is a separate service - vmalert:
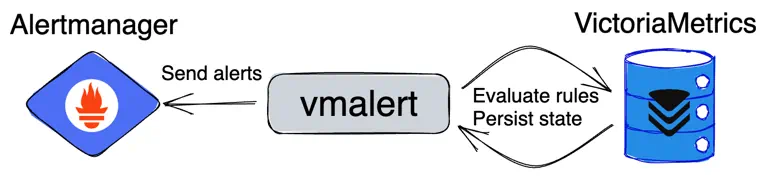 vmalert as an external Ruler for VictoriaMetrics
vmalert accepts rules configuration in the same format as Prometheus does. For example, a simple alerting rule definition looks like the following:
  - alert: TooManyErrors
    expr: increase(http_errors_total[5m]) > 0
The logic of rules evaluation is very simple:
- If expression from field
exprreturns no results, then alerting condition isn’t met and no alerts will be fired; - If expression from field
exprreturns results, then fire an alert for each returned time series.
For example:
expr: http_errors_totalwill fire an alert if database at least containshttp_errors_totalmetric.expr: increase(http_errors_total[5m]) > 0will fire if this metric was recently increased.expr: increase(http_errors_total[5m]) > 10will fire only if metrichttp_errors_totalincreased by at least 10.
vmalert doesn’t understand the difference between http_errors_total and increase(http_errors_total[5m]) > 0.
These are just expressions it needs to evaluate via query API
and check if they return a response. That’s it.
The response from the query API has the following format:
{
  "status": "success",
  "data": {
    "result": [
      {
        "metric": {<labels>},
        "value": [<timestamp>, "<value>"]
      },
      ...
    ]
  }
}
If we update our expression with a condition that we unlikely meet, like expr: increase(http_errors_total[5m]) > 10000,
then we’ll get an empty response:
{
  "status": "success",
  "data": {
    "result": []
  }
}
Getting an empty response for vmalert (as well as for Prometheus) means the condition wasn’t met. Hence, no need to fire
any alerts. But the problem is that there is no way to distinguish whether we got an empty response because some threshold
wasn’t reached. Or is it just that http_errors_total metric doesn’t exist because we don’t scrape it. Or we just
made a typo in the metric name.
This type of error is very subtle and dangerous. Users may think they receive no alerts because everything is Ok. When, in fact, the alerting rule just contains a typo and will never ever fire.
How to validate alerting rules for typos?
#
Prometheus or vmalert can check the syntax for correctness, but they can’t catch a typo in the metric name. Users can manually verify if the query is correct and contains no typos. But this is a one-time event. What if a specific metric ceased to exist in a newer version of the application - how to verify that?
Lukasz Mierzwa from Cloudflare published a very
detailed blog post elaborating more on this problem.
I really enjoyed reading it!
Lukasz suggests using pint - an opensource tool developed by Cloudflare
to do an additional validation for rules.
For example, pint can understand increase(http_errors_total[5m]) > 10000 expression
and do an extra check by evaluating just increase(http_errors_total[5m]) to see if it returns at least something.
And that’s a good solution, I recommend taking a look at pint if you’re going serious about alerting rules. But pint is an extra tool you need to install and integrate into CI/CD pipeline to get this extra validation. Could it be simpler?
Alerts that never fire
#
Starting from v1.90, VictoriaMetrics returns an extra object in response to read queries:
"stats": {"seriesFetched": "42"}
The stats object contains a field seriesFetched with a number of time series read from the storage before
the comparison operator was applied. So if you get seriesFetched: 0 it effectively means that expression doesn’t match
a single time series. If it is > 0 but you still get an empty response - then matched time series were filtered out
by the comparison operator.
vmalert can read and understand
this new field in VictoriaMetrics response starting from v1.91.
Based on that, it exposes a new metric vmalert_alerting_rules_last_evaluation_series_fetched showing how
many time series were fetched during the last evaluation.
The following expression would return you alerting rules which are likely to contain a typo or wrong time series selector:
max(vmalert_alerting_rules_last_evaluation_series_fetched) by(group, alertname) ==0
Alerting rules that do not match any series during evaluation will be highlighted in vmalert web UI:
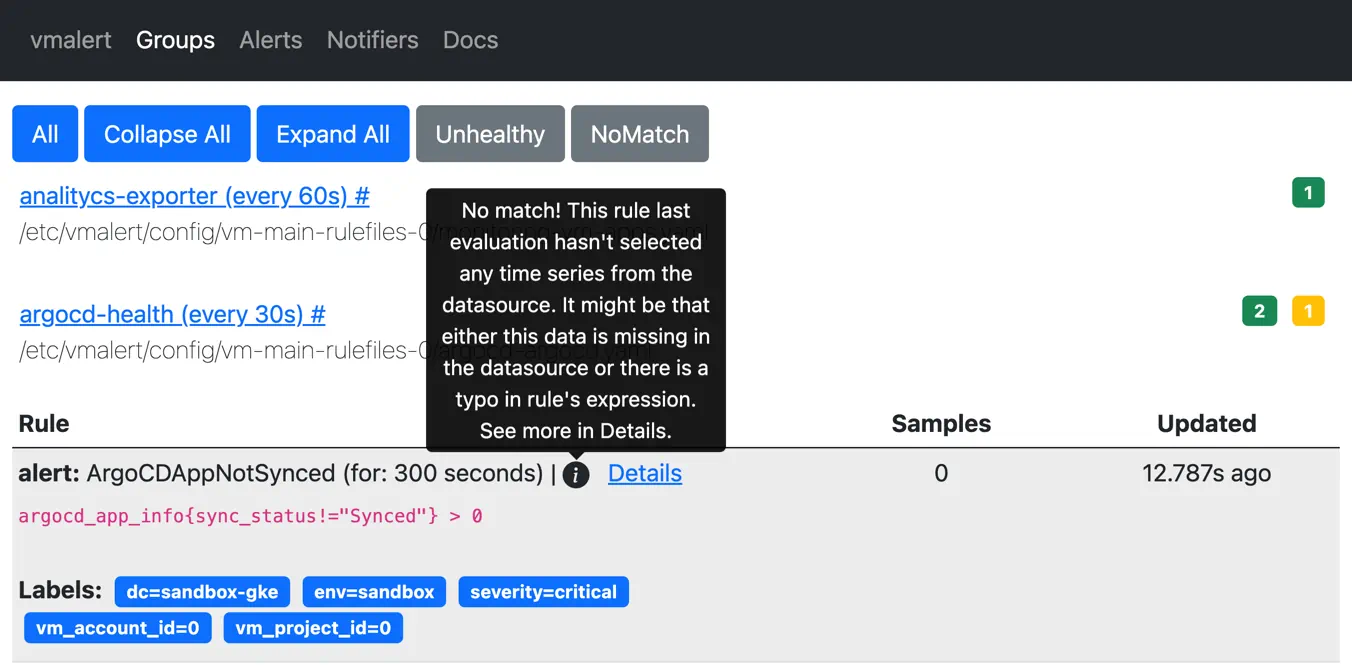 vmalert displays alerting rule matching no time series
Recording rules
#
Not-working recording rules are much easier to find compared to alerting rules. Simply because it is expected for the recording rule to always produce data samples, without conditions. To find recording rules which produce no data, run the following query:
sum(vmalert_recording_rules_last_evaluation_samples) by(group, recording) < 1
You can find this and many other useful alerting rules here.
False positives
#
Detecting never-firing alerts helped us to identify poorly configured alerting rules for internal infrastructure. However, we also had a few false positives. For example, we’re using ArgoCD for CI/CD purposes, and we use some recommended alerting rules like the following:
- alert: ArgoCDAppNotSynced
  expr: argocd_app_info{sync_status!="Synced"} > 0
This alerting rule will be highlighted by vmalert as never-firing because changing sync_status label
for argocd_app_info metric means that metric with the previous status will be deleted. This results into short-living
time series and is recognized as anti-pattern in monitoring.
Because of this, the mentioned alerting rule will match no series until the sync_status stops being Synced.
Conclusion
#
Never-firing alerts is a real thing in modern monitoring. It is very easy to make a mistake while copy&pasting alerting rules. Or deploy a new version of the software with breaking changes in metric names. Such subtle errors don’t reveal themselves until it is too late. We hope that vmalert will help users to identify such problems quicker. Try it in new v1.91!
Leave a comment below or Contact Us if you have any questions!
comments powered by Disqus