- Blog /
- Multi-tiered Observability: A Practical Way to Handle Diverse Workloads
Multi-tiered Observability: A Practical Way to Handle Diverse Workloads
Share:


Summary: In this article, we explain how a multi-tiered architecture approach improves observability architecture by separating metrics into different tiers, such as default workloads, high-cardinality data, and business-critical monitoring. Multiple tiers bring many benefits to observability at scale, including better cost control, more reliable alerting, workload isolation, and more flexible data retention. The main advantage of a multi-tier architecture is that each type of observability data can be handled according to its real value and operational importance, rather than forcing everything through the same infrastructure.
Observability in large companies is rarely one-size-fits-all. The VictoriaMetrics topologies guide shows why different deployment patterns are needed as scale, isolation, and reliability requirements grow. Different workloads require different trade-offs: some need long retention for audits and trend analysis, while others need higher resolution for debugging. Business-critical systems also demand dependable alerting and high availability, often with several 9s of reliability.
A single observability configuration cannot effectively support such a wide range of profiles. A better approach is to recognize these differences upfront and design an architecture that matches each workload’s needs for retention, resolution, alerting, and cost. This article presents a different take: multi-tier observability. With this, the team responsible for observability can standardize observability service profiles for the rest of the company.
The specific implementation that we show today is based on a real use case scenario kindly shared by a large trading firm using VictoriaMetrics OSS. We want to thank the engineers who approached us with their solution. We appreciate the remarkable effort they put into sharing their challenges and how they solved them, and hope to honor that effort by sharing their ideas with the larger open-source community.
Shared Observability at Scale
#
Companies with a team dedicated to observability services typically start with a centralized, highly available cluster that serves all internal systems via a shared backend.
This model can work well for a long time because:
- It keeps the experience simple.
- Allows for long-term retention.
- Provides a global view that aggregates data from all systems.
- Presents a central point to configure alerts and recording rules.
When One Backend Is Not Enough
#
As systems grow, the trade-offs of centralization become apparent. Beyond a certain point, a single shared observability backend struggles to meet all the diverse requirements. A noisy or misbehaving system can saturate capacity and introduce high cardinality issues, which in turn can cause out-of-memory issues, slow queries, or even bring down the observability backend.
Business-critical teams are most affected: their alarms fire with a lag or not at all. In general, the observability experience degrades when the backend is under heavy load, forcing operations to make compromises such as disconnecting non-critical systems, filtering data, or reducing retention.
If you are in this situation and your company expects more growth, adding more capacity isn’t likely to be the answer. This is the point where going multi-tier starts to make sense.
Multi-tiered Observability with VictoriaMetrics
#
The key question stops being “can we store and query metrics?” and becomes “can we do it with clear tiers, predictable cost, and strong isolation between environments and workloads?”
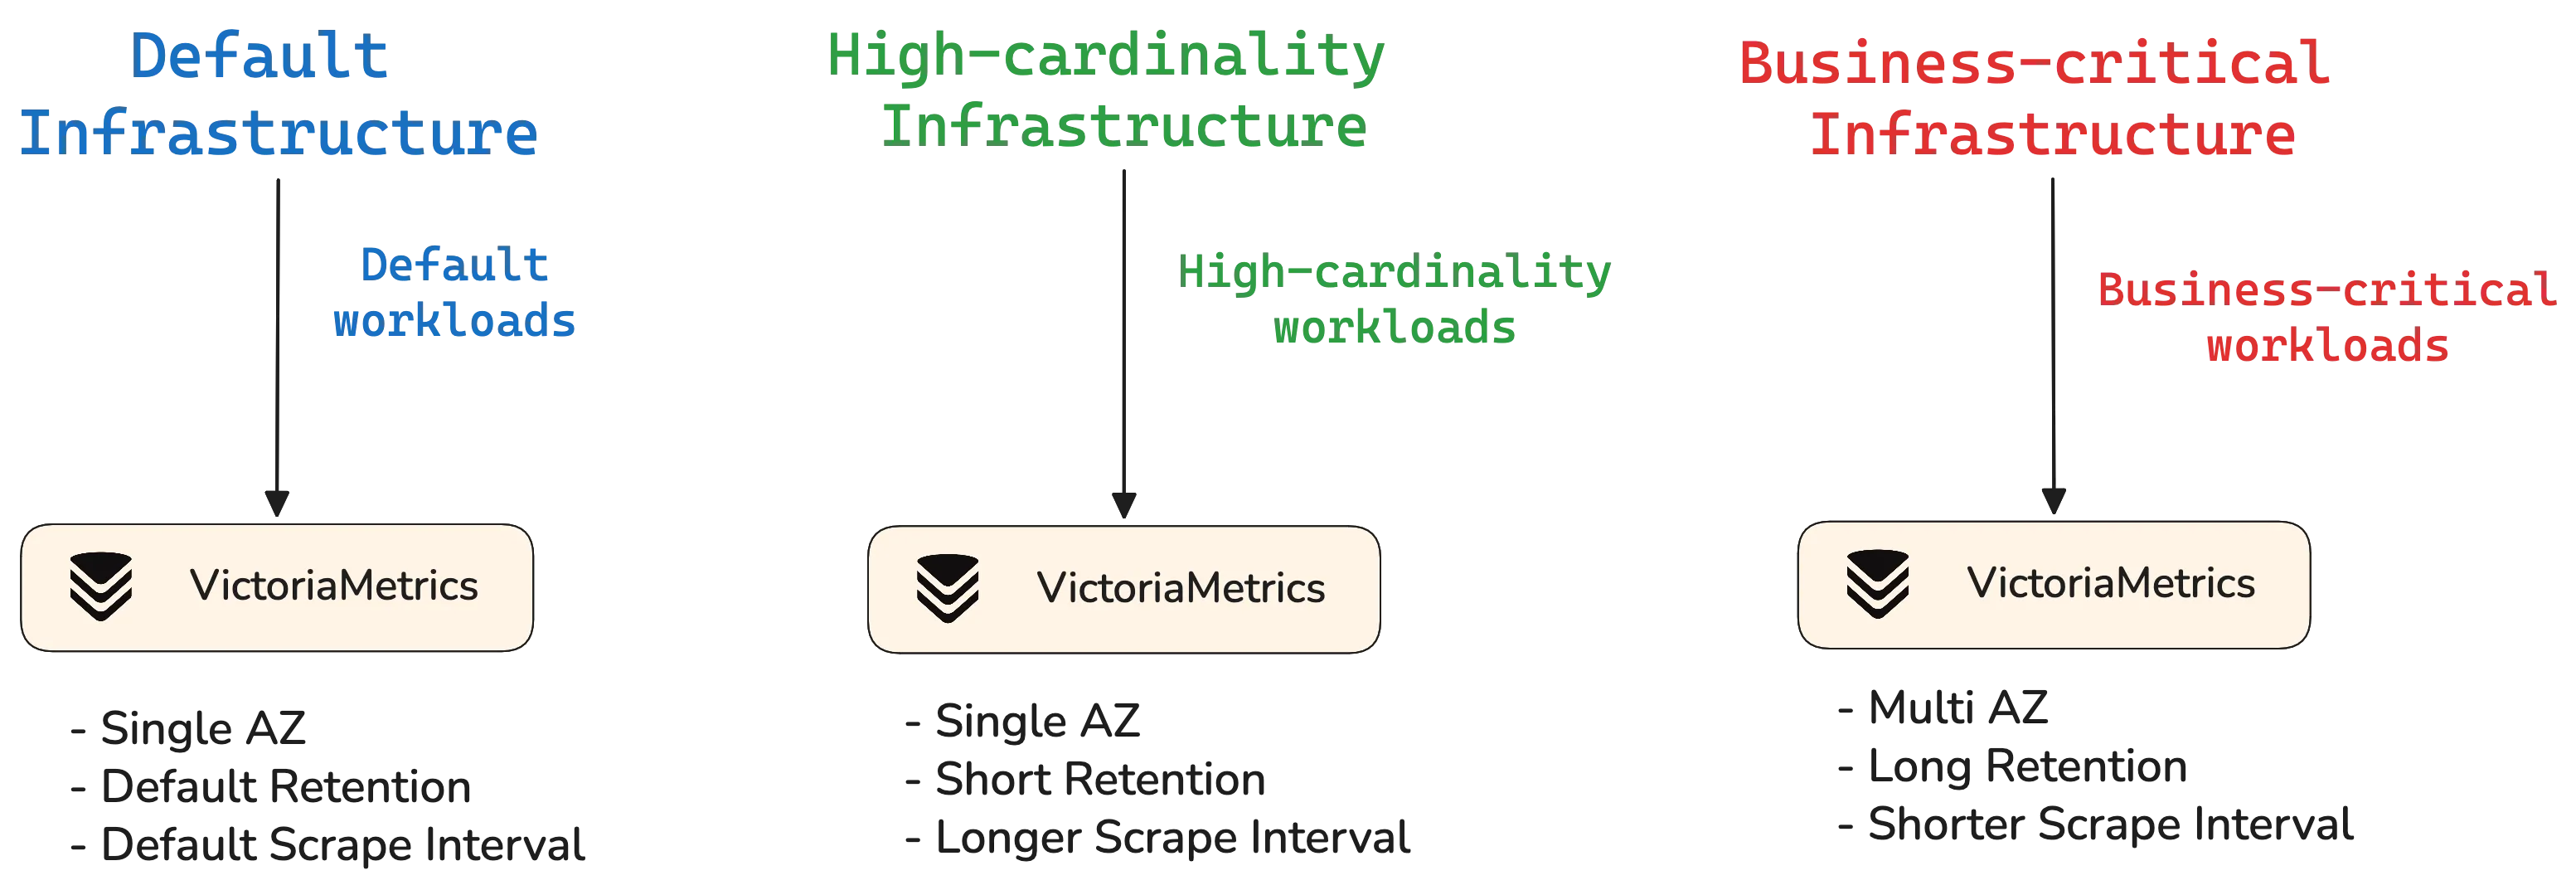
A solution we saw applied to great effect is a three-tiered architecture with different Quality of Service (QoS) objectives, each running on its own infrastructure. Each tier provides a different service profile:
- Default tier: For standard applications where high reliability or strict SLAs are unnecessary, this tier maintains existing scraping, labeling, and alerting. It offers a familiar experience for most services without over-provisioning for non-critical needs.
- High-cardinality tier: For workloads with high-cardinality metrics or large telemetry-like experiments, development, or spammy exporters. This separation contains resource-intensive workloads and reduces impact on other tiers.
- Business critical tier: Reserved for business-critical workloads needing high availability and performance. It enforces multi-availability zone deployment, strict cardinality limits, and compliance requirements.
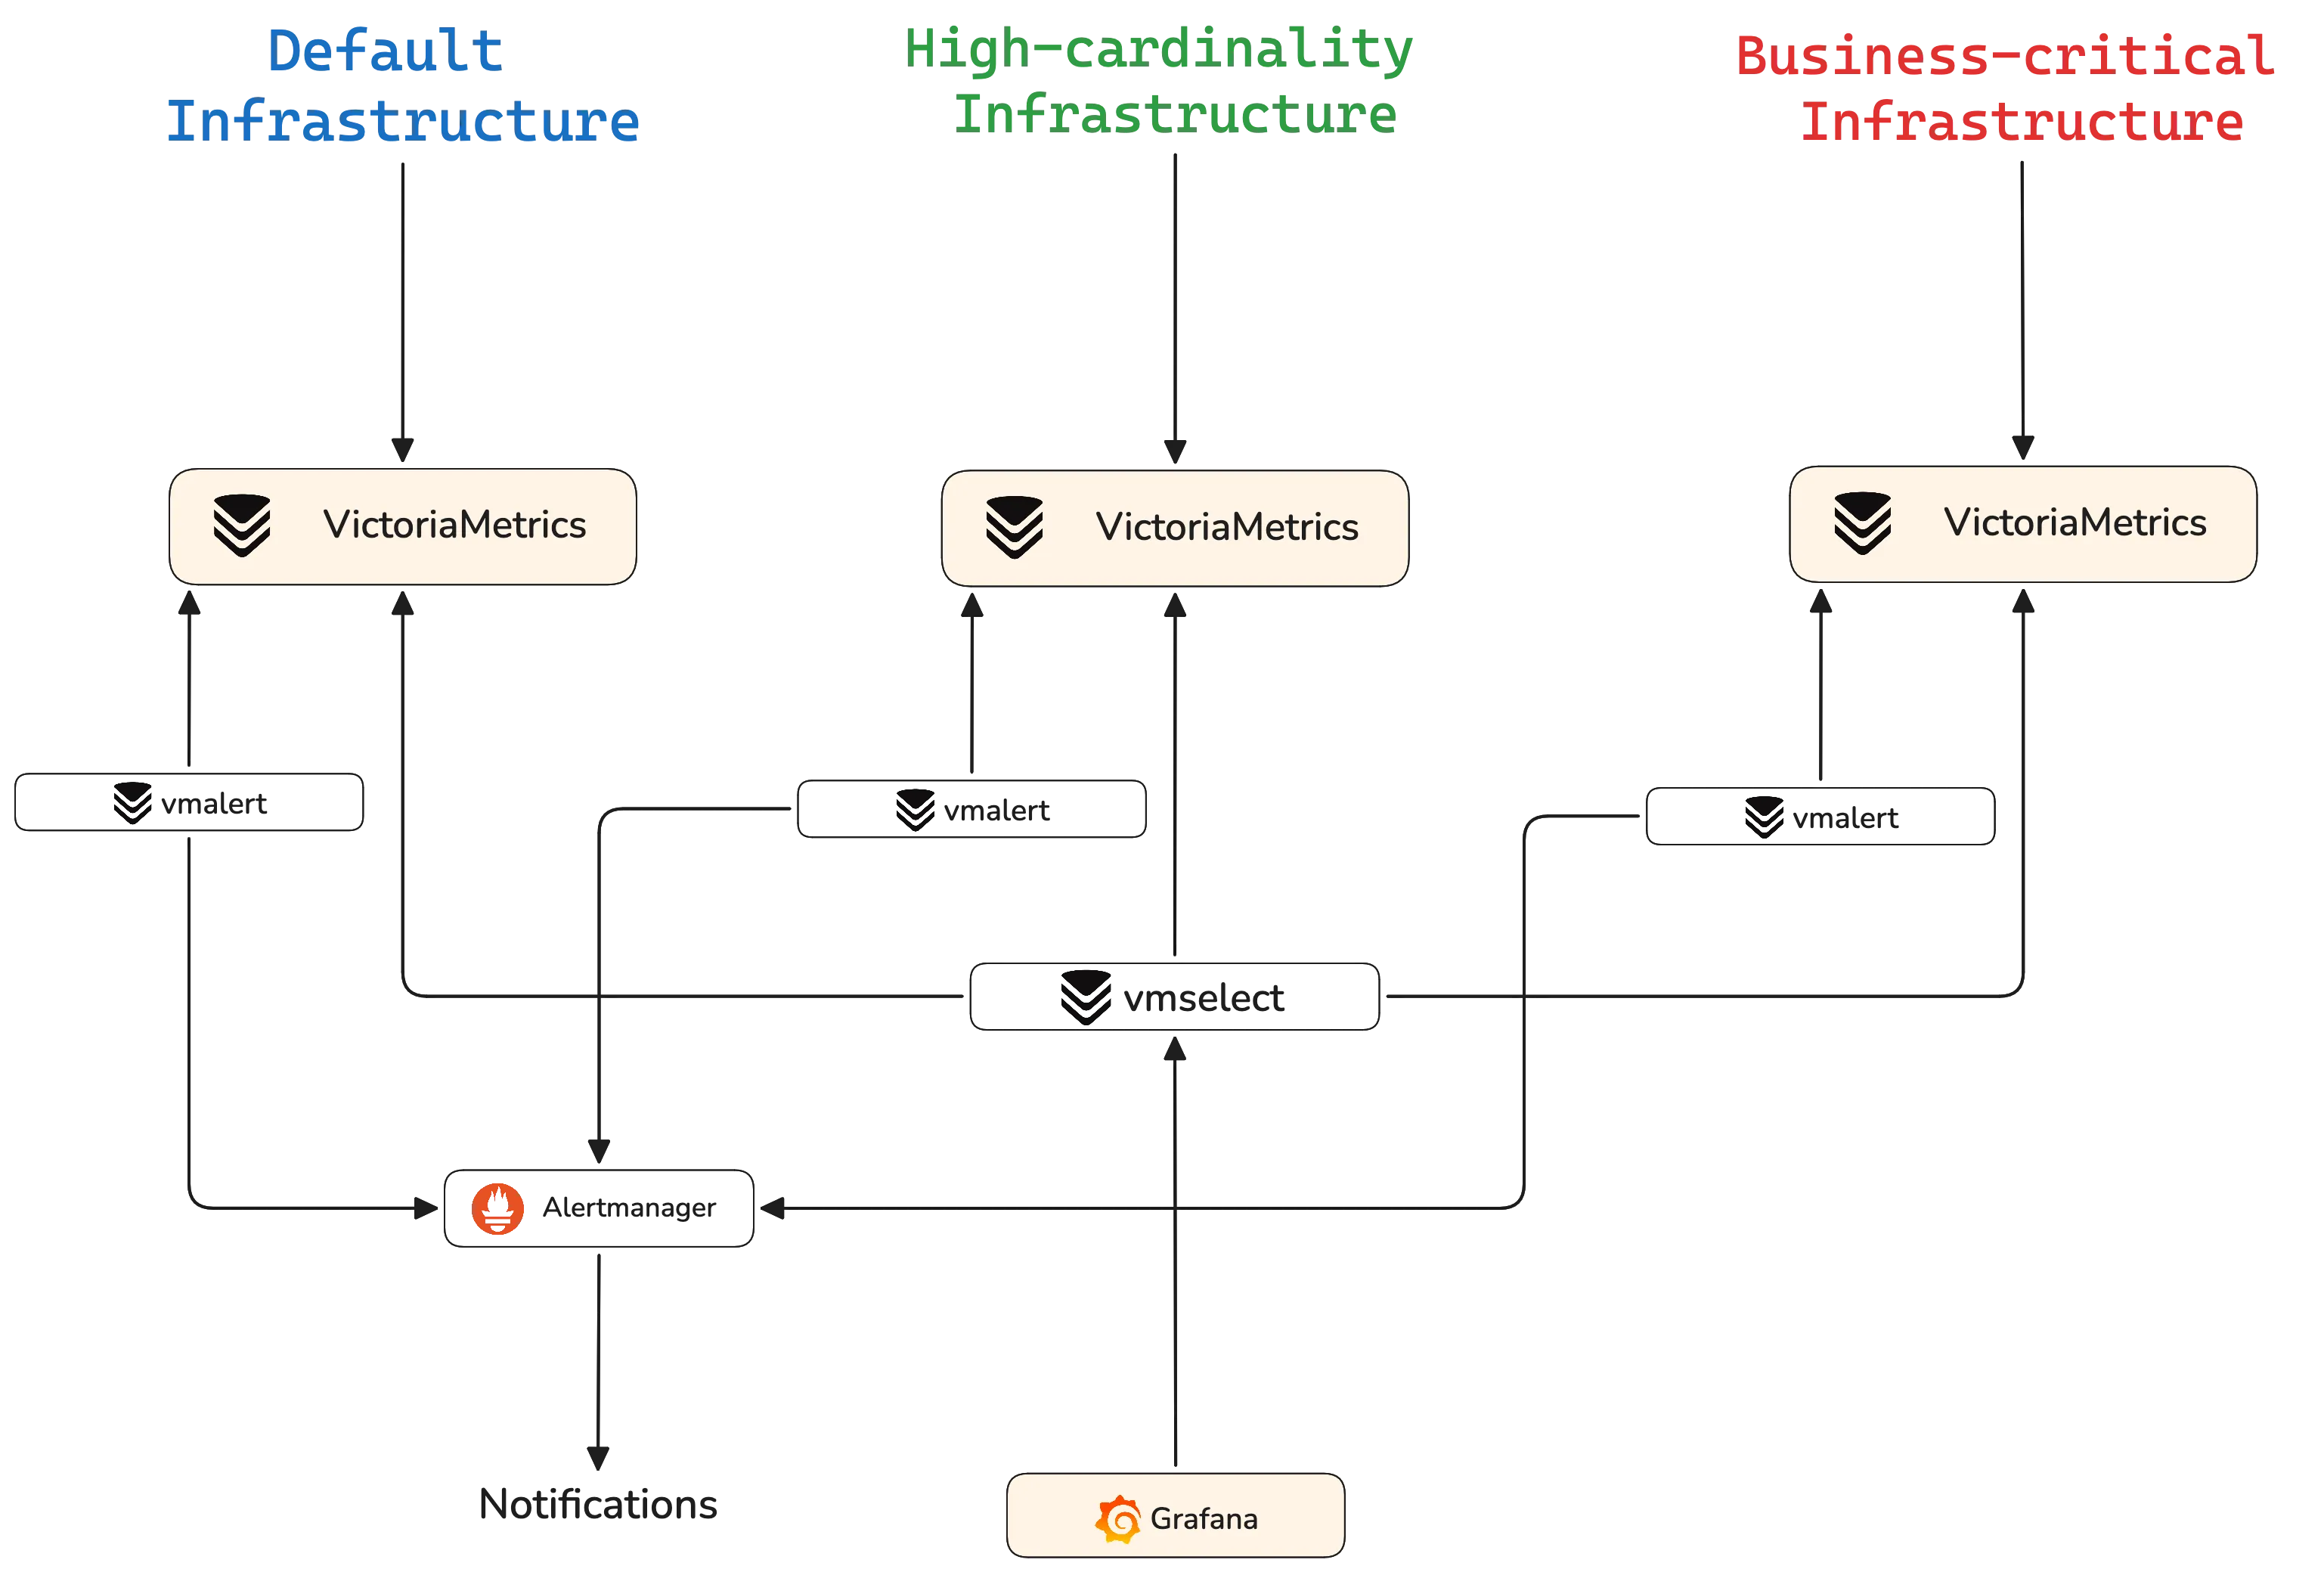
We can implement this architecture with vmagent and VictoriaMetrics clusters:
- vmagent: scrapes and forwards metrics to the appropriate cluster.
- VictoriaMetrics cluster: behind vmagent, storage is split across multiple VictoriaMetrics clusters, each dedicated to a specific quality‑of‑service tier. The cluster version of VictoriaMetrics has been benchmarked to be highly resource‑efficient, is horizontally scalable with separate components for ingestion, storage, and query paths, and supports multi‑node, multi‑availability‑zone topologies.
We can obtain global view by plugging Grafana into every tier via global vmselect. For alerting rules, we can plug in a separate vmalert in each tier for better isolation. The alerting notifications are then forwarded to the global Alertmanager installation.
Quality of Service Levels
#
When designing a multi-tiered setup, it’s important to define the service levels for each tier. These should align with business values and operational needs.
The following table shows a few example parameters for each tier. Adjust as necessary for your requirements.
| Parameter | Default tier | High-cardinality tier | Business-critical tier |
|---|---|---|---|
| Retention Period | Enough for day-to-day debugging, usually 3-6 months. | Default 1 month retention | 1 Year (or more) to support audits, incident reviews, and long‑term SLO analysis. |
| Scrape interval | Default (30-60s) is good enough for routine monitoring while keeping costs manageable. | Long enough (>60s) to control storage costs. | Short (e.g., 15-30s) to enable fast anomaly detection and high-fidelity SLO tracking for critical systems. |
| Cardinality limiter | Moderate limits: allow normal growth while alerting on unusual spikes. | Strict limits: aggressively cap cardinality and enforce clear label hygiene, dropping overly detailed series. | Tight but predictable limits: allow necessary labels for SLOs and root cause analysis, but limit labels. |
| Availability/topology | Single region or AZ, simple HA (e.g., a small cluster with redundancy but no strict failover guarantees). | Single region, minimal redundancy; optimized for cost and easy rebuild rather than maximum uptime. | Multi‑AZ or multi‑node cluster with redundancy and failover tuned for strict availability and durability requirements. |
| Query limits | Moderate: Balances query performance for typical dashboards while preventing runaway ad-hoc exploration from overwhelming shared resources. | High: Allows large-scale data scans needed for debugging noisy telemetry or experimental workloads without artificial caps. | Low: Enforces tight predictability to guarantee fast, reliable SLO dashboards and alerting, even under peak troubleshooting load; without risks of impacting the system reliability. |
Running multi-tier vmagents
#
vmagent supports limiting, relabeling, deduplication, and stream aggregation for all metric samples, scraped or pushed. This allows us to manipulate metric samples, replicate, route and shard them before storing them in the VictoriaMetrics cluster. You can read all about the process in “Life of a Sample”.
Here are a few examples of flags that let you control how data flows through vmagent:
| Flags | Description |
|---|---|
Cardinality limiter at ingestremoteWrite.maxHourlySeries, remoteWrite.maxDailySeries | Limit how many unique series vmagent will send per hour or per day to a remote endpoint. |
Scrape configuration and resolutionpromscrape.config , scrape_interval, scrape_timeout, sample_limit, series_limit, label_limit | Points vmagent at your Prometheus-style scrape configurations. Use shorter intervals and tighter per-target limits for business‑critical jobs. |
Global and per-destination relabelingremoteWrite.relabelConfig, remoteWrite.urlRelabelConfig | Apply relabeling on per-remote destination before sending them on, allowing you to drop low‑value metrics, route only certain environments to a given tier, or normalize labels. |
Complexity limitsmaxLabelsPerTimeseries, maxLabelNameLen, maxLabelValueLen | Cap labels to limit too many labels from entering your system. |
Stream aggregation and deduplicationstreamAggr.config, streamAggr.dedupInterval, remoteWrite.streamAggr.config, remoteWrite.streamAggr.dedupInterval | Configure global or per‑destination aggregation and deduplication intervals so vmagent can aggregate or downsample samples before sending them. |
Buffering and durabilityremoteWrite.tmpDataPath, remoteWrite.maxDiskUsagePerURL, remoteWrite.disableOnDiskQueue | Control how vmagent buffers unsent data on disk when the remote storage is unavailable, including maximum disk usage per destination and whether on‑disk queues are disabled. |
Sharding and replication across backendsremoteWrite.shardByURL, remoteWrite.shardByURLReplicas, remoteWrite.shardByURL.labels, remoteWrite.shardByURL.ignoreLabels | Decide whether vmagent replicates metrics to all configured remoteWrite.url targets or shards series between them based on labels, with optional replicas; useful for horizontally scaling a tier or replicating business‑critical data to multiple regions. |
Running multi-tier VictoriaMetrics clusters
#
For a VictoriaMetrics cluster, we configure vmstorage, vmselect, and vminsert to let you encode different retention, cardinality, and availability policies per tier. Here are a few notable parameter examples:
| Flags | Description |
|---|---|
Data retention (vmstorage)retentionPeriod | Sets how long data is stored before being removed. |
Cardinality limiting in storage (vmstorage)storage.maxHourlySeries, storage.maxDailySeries | Enforces limits on the number of active and daily unique time series per vmstorage node, forming the cluster‑wide cardinality limiter. |
Disk safety and readonly behavior (vmstorage)storage.minFreeDiskSpaceBytes | Controls when vmstorage automatically switches to read‑only mode if free disk space falls below a threshold, which in turn affects how vminsert reroutes data; critical tiers often use a higher safety margin to reduce the risk of write outages. |
Replication and availability (vmselect)replicationFactor, globalReplicationFactor | Specify how many vmstorage nodes or groups must be available to serve full responses without being marked partial, and how replication behaves across storage groups; business‑critical tiers typically use higher replication and possibly multiple storage groups. |
Consistency vs availability (vmselect)search.denyPartialResponse | Tells vmselect whether to return partial results when some vmstorage nodes are down, or to fail the query instead. |
Topology and tier separation (vmselect)storageNode=groupName/addr, clusternativeListenAddr | Use storageNode with group names to assign storage nodes into logical groups and set different replication factors per group.clusternativeListenAddr lets you build multi‑level cluster topologies where a top‑level vmselect fans out to tier‑specific clusters. |
The Benefits of Multiple Tiers
#
The main benefit is isolation: each tier runs in a separate system, preventing one from affecting the others.
In addition, this approach brings other benefits such as:
- Better resource allocation
- Seamless migration
- Reliable alerting
Better Resource Allocation
#
A multi-tiered approach allows us to align the value of each metric class with its actual business value.
Critical production workloads benefit from dedicated clusters configured with multi‑AZ redundancy and sufficient CPU and IO headroom. In contrast, less critical and high‑cardinality data is handled by clusters optimized for cost rather than strict SLAs. This separation dramatically reduces the risk that load tests, experimental labels, or misconfigured exporters in non‑production environments will impact production observability.
Seamless Migration
#
Users experience seamless migration: Grafana continues to work through VictoriaMetrics’ MetricsQL-compatible interface, so existing PromQL dashboards usually function without change. VMUI enables direct query exploration and troubleshooting.
Labels, filters, and dashboards can be organized to hide multi-tier complexity from users, allowing them to select the systems and environments relevant to them.
Reliable Alerting
#
Alerts can scale with your observability stack, and each tier can have its own alerting policy. For example, the critical tier may have 24/7 alerting while the noisy tier can be limited to business hours.
Instead of relying solely on remote‑write paths into a distant long‑term store, alerts for critical systems can be evaluated close to where their data is ingested, with VictoriaMetrics providing consistent query performance even under heavy load.
Conclusion
#
For observability teams facing similar growth and reliability pressures, this approach offers a practical path forward.
The goal is not just to collect and query metrics; it is to do so with the right balance of stability, isolation, and efficiency for each workload class. That is the kind of observability problem VictoriaMetrics is designed to solve.
Thanks to the open-source community for sharing real-world observability challenges with us. Our users’ willingness to document challenges and solutions helps the entire community build better systems.
Frequently Asked Questions
#
What is a multi-tier architecture in observability?
#
A multi-tier architecture in observability separates monitoring data into distinct layers, or tiers, based on how it is used. For example, business-critical metrics may need high availability and strong alerting guarantees, while high-cardinality metrics may need separate limits and retention policies. This allows each type of observability workload to use the appropriate storage, retention, and reliability profiles without competing for the same resources.
What are the advantages of multi-tier architecture for observability?
#
The main advantages of multi-tier architecture for observability are better cost control, stronger workload isolation, more reliable alerting, and more flexible data retention. Teams can provide business-critical metrics with greater protection, place high-cardinality workloads in a separate tier, and store lower-priority data more cost-effectively. This makes the overall observability system easier to scale and tune for different use cases.
Why are high cardinality metrics expensive?
#
High-cardinality metrics are expensive because each unique label combination can create a separate time series. As the number of services, pods, users, endpoints, or tenants grows, the observability backend may need to ingest, index, store, and query millions of unique series. This can increase infrastructure usage, slow down dashboards, and make observability costs harder to predict.
How does telemetry routing improve observability?
#
Telemetry routing improves observability by giving teams more control over where data goes before it reaches long-term storage or alerting systems. Instead of treating all telemetry the same, teams can route data based on source, importance, cardinality, retention needs, or alerting requirements. This can reduce cost, improve reliability, and prevent noisy workloads from affecting critical monitoring workflows.
When should a team move beyond a single observability backend?
#
A team should consider moving beyond a single observability backend when different workloads have very different needs. Common signs include rising storage costs, slow queries, noisy high-cardinality metrics, unreliable alerts, or conflicts between teams over retention and resource usage. A multi-tier approach allows teams to separate those needs rather than overloading a single shared system.
Leave a comment below or Contact Us if you have any questions!
comments powered by Disqus